
Automotive Test Equipment Market Size, Share & Analysis

Automotive Test Equipment Market by Equipment (Dynamometer, Vehicle Emission Test, Wheel Alignment, Battery Test System), Propulsion (ICE, EV), Vehicle Type (PC, CV), End Market, Application, Advanced Technology, and Region - Global Forecast to 2032


OVERVIEW
Source: Secondary Research, Interviews with Experts, MarketsandMarkets Analysis
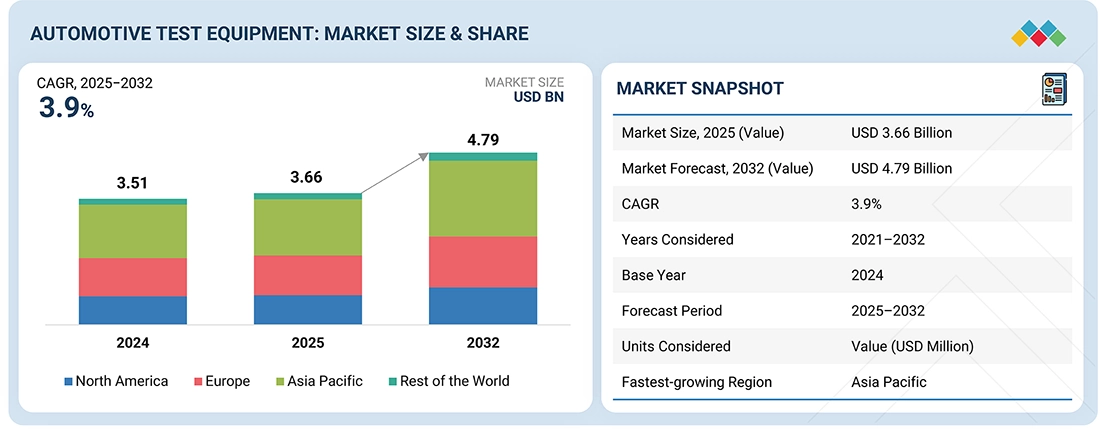
The automotive test equipment market is projected to reach USD 4.79 billion by 2032 from USD 3.66 billion in 2025, at a CAGR of 3.9%. The market is driven by the rapid integration of electric and hybrid vehicles, which has amplified the need for battery, powertrain, and high-voltage system testing. Additionally, the growing adoption of ADAS, autonomous driving technologies, and connected vehicle platforms has created a strong demand for sophisticated simulation and validation tools. Stringent global regulatory standards for vehicle safety and emissions further urge OEMs and suppliers to invest in advanced testing solutions. To leverage these trends, companies can develop modular and scalable testing solutions tailored to electric powertrains and autonomous systems, expand into Test-as-a-Service (TaaS) subscription models, and collaborate with OEMs and Tier-1 suppliers to co-develop domain-specific platforms.
Automotive Test Equipment Market Size and Forecast:
- Market Size Value in 2024: USD 3.51 Billion
- Market Size Value in 2025: USD 3.66 Billion
- Revenue Forecast in 2032: USD 4.79 Billion
- Growth Rate: CAGR of 3.9% from 20265 to 2032
- Data available from 2021 to 2032
- Base year: 2024
- Forecast period: 2025–2032
Key Market Trends and Insights
- Market Growth: Growth is driven by increasing EV adoption, ADAS development, and stringent vehicle safety and emissions testing requirements.
-
IoT Impact: IoT enables real-time vehicle diagnostics, connected testing, and predictive maintenance, increasing demand for advanced automotive test equipment.
- Growing Trends: The market is witnessing increased adoption of AI-driven testing, digital twins, software validation, and cloud-based testing solutions.
- Growth Opportunities: Opportunities are driven by the adoption of X-in-the-Loop (XiL) testing, digital twins, and virtual vehicle validation technologies.
KEY TAKEAWAYS
-
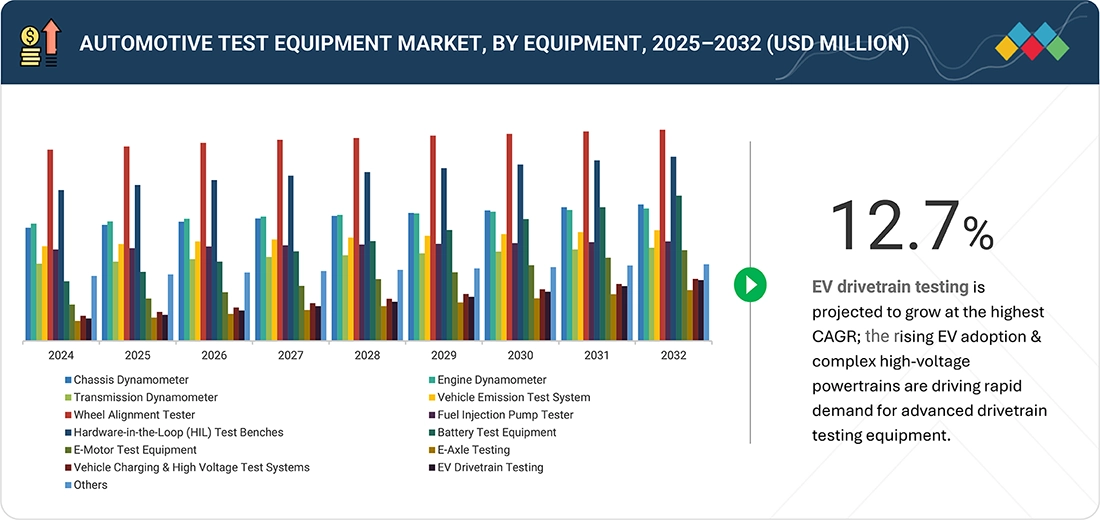
BY EQUIPMENTThe automotive test equipment market is witnessing a clear shift toward advanced, integrated, and electrification-focused solutions across equipment categories. Traditional systems such as chassis dynamometers, emission test benches, and wheel alignment testers remain critical for regulatory compliance and vehicle safety, but their growth is comparatively stable as OEMs and service centers modernize existing infrastructure. In contrast, strong momentum is observed in eMobility-oriented equipment, including battery test systems, eMotor and eAxle test rigs, EV drivetrain benches, and high-voltage/charging system testers, as manufacturers accelerate the transition to electrified platforms. Overall, these dynamics position electrification-focused test equipment and digitalized platforms as the primary growth drivers, whereas conventional systems continue to evolve in alignment with ongoing regulatory and safety requirements.
-
BY APPLICATIONThe automotive test equipment market is experiencing a clear application-level transition, with mobile and tablet-based solutions gaining rapid adoption due to their portability, ease of use, and compatibility with cloud-connected diagnostic platforms, making them increasingly preferred in workshops and field service environments. PC and laptop-based systems continue to play a vital role, particularly for complex testing, advanced calibration, and data-intensive applications, but their growth trajectory is more gradual as newer mobile platforms incorporate enhanced processing power and connectivity.
-
BY VEHICLE TYPEThe automotive test equipment market by vehicle type reflects a clear divergence in growth momentum, with passenger cars driving faster adoption due to the increasing integration of electrification, advanced driver assistance, and digital validation systems, while commercial vehicles exhibit steady, compliance-driven demand centered on durability, emissions, and safety testing. This dual-track development highlights how passenger car testing is becoming more technology-intensive, whereas commercial vehicle testing remains focused on operational robustness and regulatory conformity.
-
BY PROPULSIONThe automotive test equipment market by propulsion is witnessing a structural shift, with EV-related testing rapidly gaining prominence alongside the established ICE testing domain. While ICE vehicles continue to require extensive validation for engines, transmissions, and emissions, the EV segment is driving new demand for battery, e-motor, inverter, and high-voltage system testing. This transition underscores a dual focus within the industry, sustaining traditional ICE requirements while scaling advanced solutions tailored to electrification, positioning EV testing as the faster-growing segment, and reshaping long-term market dynamics.
-
BY END MARKETThe automotive test equipment market by end market reflects distinct growth dynamics across OEM assembly plants, R&D/technical centers, and authorized service centers. OEM plants continue to drive demand for large-scale, precision end-of-line systems to guarantee compliance and quality before vehicles reach customers. R&D centers are accelerating investment in advanced simulation and validation platforms to support the development of EVs, ADAS, and autonomous driving technologies. Meanwhile, authorized service centers are emerging as the largest and fastest-growing segment, supported by expanding vehicle parc, OEM-driven aftersales control, and the need for certified diagnostics and EV-specific testing.
-
BY ADVANCED TECHNOLOGYThe automotive test equipment market is witnessing strong momentum toward advanced technologies such as ADAS validation, ECU and sensor testing, simulation platforms, perception system assessment, data logging, edge computing, and V2X testing. These technologies are becoming central to the industry as vehicles transition toward higher automation, connectivity, and electrification, requiring highly precise, software-driven validation processes. Growth is led by the increasing integration of intelligent electronics and autonomous features, which demand multi-domain testing environments capable of handling real-time data, connectivity, and system-level interaction
-
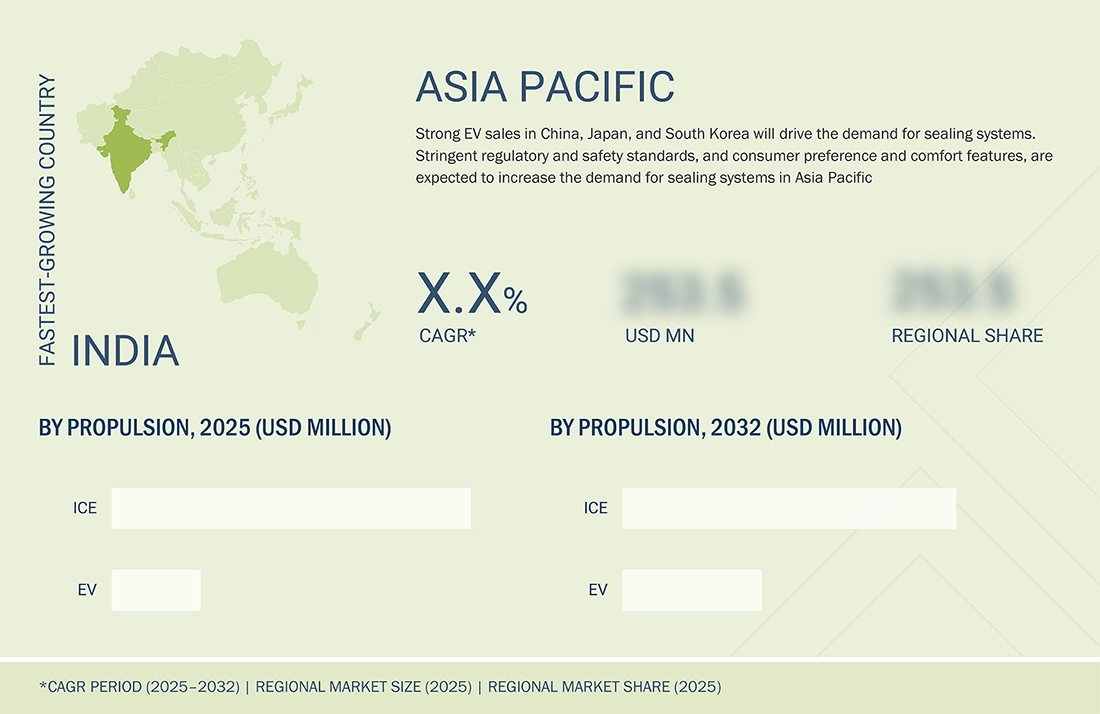
BY REGIONAsia Pacific is emerging as the most dynamic region in the automotive test equipment market, fueled by rapid electrification, expanding vehicle production, and the growing penetration of semi-autonomous and connected vehicles. The region’s scale, combined with government-led mandates on emissions, safety, and energy efficiency, is accelerating demand for high-precision testing of EV batteries, ePowertrains, advanced driver-assistance systems (ADAS), and connected vehicle platforms. Countries such as China and India are pushing large-scale adoption of domestic testing solutions to meet regulatory compliance and reduce reliance on imports, while Japan and South Korea continue to lead in precision test technologies for hybrid and electric vehicles.
-
COMPETITIVE LANDSCAPEThe leading players in the automotive test equipment market are PHINIA Inc. (US), Robert Bosch GmbH (Germany), HORIBA, Ltd. (Japan), Illinois Tool Works, Inc. (US), and AVL (Austria). These companies have a global distribution network across Asia Pacific, North America, and Europe. They are vital in their domestic markets and explore geographic diversification alternatives to grow their businesses. They focus on increasing their market share through expansions, investments, joint ventures, collaborations, and partnerships.
The automotive test equipment market is expanding rapidly due to the rising complexity of electric vehicles (EVs), advanced driver-assistance systems (ADASs), and software-defined vehicles (SDVs). Increasingly diverse battery chemistries and powertrain architectures require highly configurable testing platforms capable of handling varied thermal, electrical, and safety parameters. Additionally, the integration of autonomous features demands sophisticated hardware-in-the-loop (HIL) and sensor simulation solutions. The growth of the market is driven by the need for modular, programmable equipment supporting multiple communication protocols and real-time data acquisition to validate hardware and software components. Regulatory compliance for emissions and safety further amplifies the demand for precise, standardized testing methods. Overall, the market’s trajectory is tightly linked to EV adoption, autonomous technology deployment, and OEMs’ focus on reducing development time and total cost of ownership.
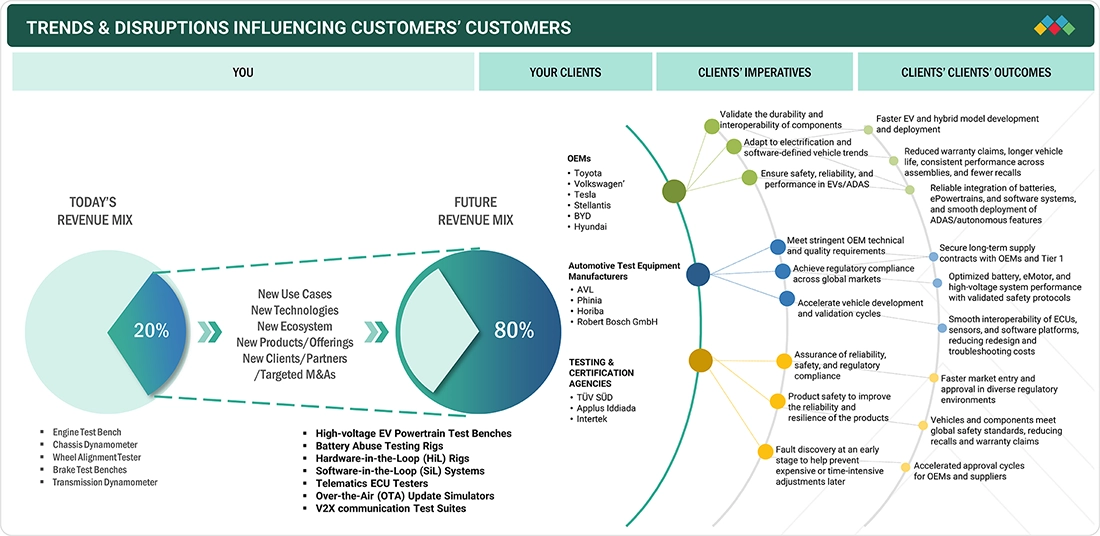
TRENDS & DISRUPTIONS IMPACTING CUSTOMERS' CUSTOMERS
The automotive test equipment industry is evolving rapidly due to electrification, SDVs, ADAS/AV complexity, connectivity, and cybersecurity demands. Battery and high-voltage testing grow as solid-state tech emerges, while software validation and cloud-based Test-as-a-Service gain importance. Digital twins and AI enable continuous testing, pushing labs toward hybrid physical-virtual setups. Regulatory and supply chain challenges require agility and localized solutions.
Source: Secondary Research, Interviews with Experts, MarketsandMarkets Analysis
MARKET DYNAMICS
Level
-
Increasing demand for specialized test systems for hybrid and EV platforms

-
Stringent regulatory standards for automotive testing

Level
-
Capital-intensive infrastructure for test equipment manufacturers

-
In-house capability preference for automotive testing

Level
-
Convergence toward X-in-the-Loop (XiL) technology

-
Localized, compact test benches for tier-2 and mid sized suppliers

Level
-
High complexity in ADAS and ECU Co-validation

-
Lack of standardization in battery testing protocols

Source: Secondary Research, Interviews with Experts, MarketsandMarkets Analysis
Driver: Increasing demand for specialized test systems for hybrid and EV platforms
According to IEA Estimates, global EV sales reached over 14.2 million units in 2024, marking a significant 35% increase over 2023. This rapid growth is largely attributed to regulatory pressure to reduce emissions, strong government subsidies (especially in China, the US, and Europe), and automakers’ accelerated shift toward zero-emission mobility. The growing consumer acceptance of EVs, alongside advancements in battery range and charging infrastructure, has created a ripple effect across the automotive value chain, including the testing equipment segment. The shift from ICE vehicles to EVs has significantly changed the requirements for automotive test equipment. Traditional engine dynamometers, while still relevant for hybrid vehicles, are being adapted for new powertrain configurations. There is also a rising need for battery testing systems that evaluate not only capacity and energy density but also thermal behavior, safety under abuse conditions, and charging performance.
Restraint: Capital-intensive Infrastructure for test equipment manufacturers
The transition to electric and software-defined vehicles has significantly raised the cost and complexity of automotive testing infrastructure, creating a substantial restraint, particularly for Tier-2 suppliers, independent labs, and SMEs. The development of next-generation test cells supporting EV, ADAS, and SDV platforms requires multi-domain integration, including electrical, thermal, cloud, and simulation capabilities, which demands capital investments ranging from USD 2–8 million per cell, according to AVL and Horiba. AVL’s E-Motor testbeds, integrated with inverter and thermal systems, cost over USD 3 million per unit, a price point unaffordable for most smaller players. These factors, such as high capital intensity, rising operating costs, declining relevance of ICE equipment, and urgent technological realignment, are collectively restraining the adoption and scalability of advanced automotive testing solutions, especially among resource-constrained stakeholders.
Opportunity: Convergence toward X-in-the-Loop (XiL) technology
The convergence of Model-in-the-Loop (MiL), Software-in-the-Loop (SiL), and Hardware-in-the-Loop (HiL) testing into a cohesive X-in-the-Loop (XiL) framework is reshaping the development and validation of automotive ECUs and autonomous systems. MiL facilitates early-stage algorithm validation via simulation models, SiL extends this to executable software verification in virtual environments, and HiL integrates actual hardware for real-time system testing. By unifying these stages, XiL accelerates iterative testing, enables comprehensive coverage of complex edge cases, and provides real-time behavioral insights critical for safety-sensitive functions such as autonomous driving and ADAS. The integration with digital twin technologies and virtual vehicle models further enhances this approach by enabling continuous integration and testing cycles without dependence on costly physical prototypes, thereby reducing time-to-market and mitigating development risks.
Challenge: High Complexity in ADAS and ECU Co-validation
Leading OEMs such as Mercedes-Benz and Audi require synchronized testing environments where ADAS, domain control ECUs, and complex simulation environments operate simultaneously in real time. These simulation environments include factors such as dynamic traffic scenarios, varying weather conditions, and sensor emulation for LiDAR and cameras. Achieving this level of integration demands highly customized test setups that ensure low-latency synchronization across multiple domains. Implementing such systems is inherently challenging due to the complexity of coordinating heterogeneous hardware and software components while maintaining real-time performance. Successfully addressing these challenges is critical for OEMs to validate integrated vehicle systems efficiently, meet stringent safety standards, and accelerate time-to-market for increasingly software-defined vehicles.
Automotive Test Equipment Market: COMMERCIAL USE CASES ACROSS INDUSTRIES
| COMPANY | USE CASE DESCRIPTION | BENEFITS |
|---|---|---|
 |
Developing advanced fuel injection and powertrain test benches integrated with emissions analyzers and thermal management systems | Ensures compliance with global emission norms, enhances equipment reliability, and supports OEMs in validating new powertrains |
 |
Deploying end-of-line chassis dynamometers, ADAS calibration rigs, and high-voltage safety testers across assembly plants in Europe and Asia | Improves vehicle quality assurance, ensures regulatory compliance, and reduces recall risks |
 |
Operating independent testing centers with battery abuse rigs, crash simulation platforms, and vehicle-in-the-loop systems for global automakers | Provides neutral certification, accelerates homologation, and reduces OEM investment in in-house test labs |
 |
Offering simulation software, ECU validation platforms, and HIL systems for ADAS, V2X, and autonomous driving feature testing. | Accelerates software development cycles, enhances safety validation, and reduces time-to-market for OEMs and Tier-1s |
 |
Supplying semiconductors, microcontrollers, and sensor chips for integration into automotive test equipment (e.g., battery testers, ECU testers) | Enables high-precision testing, supports next-gen EV and ADAS validation, and drives scalability in test equipment design |
Logos and trademarks shown above are the property of their respective owners. Their use here is for informational and illustrative purposes only.
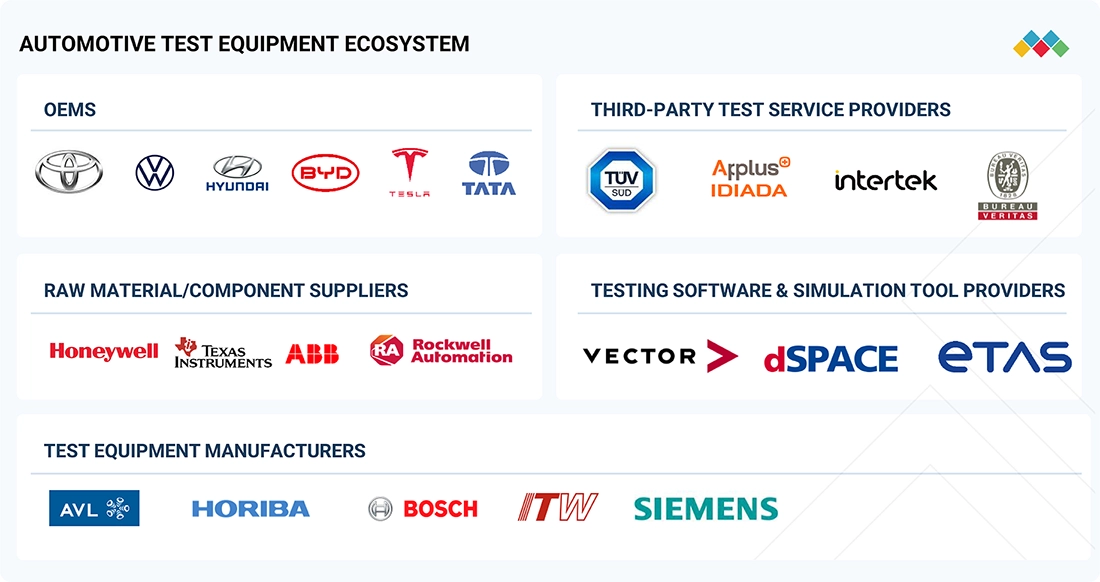
MARKET ECOSYSTEM
The ecosystem mapping highlights various players in the automotive test equipment market, mainly including raw material/component suppliers, test equipment manufacturers, testing software & simulation tool providers, third-party test service providers, and end users. The leading players in the market are AVL (Austria), Horiba, Ltd. (Japan), Robert Bosch GmbH (Germany), Phinia Inc. (US), and Illinois Tool Works (US), which are shifting toward advanced automotive technologies such as ADAS testing, ECU testing, and simulation testing, among others.
Logos and trademarks shown above are the property of their respective owners. Their use here is for informational and illustrative purposes only.
MARKET SEGMENTS
Source: Secondary Research, Interviews with Experts, MarketsandMarkets Analysis
Automotive Test Equipment Market, By Application
PC/laptop-based testing equipment is estimated to dominate the automotive test equipment market due to its versatility, scalability, and ability to support advanced diagnostics, real-time data logging, fuel efficiency measurement, and powertrain testing. These systems enable complex tasks such as ECU programming, ADAS calibration, and connected vehicle updates, making them critical across ICE, hybrid, and EV platforms. Their growth is fueled by rising vehicle complexity with more ECUs and sensors, the shift toward EVs and ADAS, and the need for data-intensive diagnostics. Recent advancements, such as Ford’s 2023 update to its Integrated Diagnostic Software for ECU programming and Micro Focus’s 2024 AI-powered UFT One upgrades, highlight the role of laptop-based testing in improving efficiency, scalability, and accuracy for modern vehicle validation.
Automotive Test Equipment Market, By Vehicle Type
Passenger car testing equipment is projected to be the fastest-growing segment in the automotive test equipment market, with demand shifting from traditional engine and chassis dynamometers toward advanced systems for EVs, ADAS, and connectivity. Growing EV adoption is driving the need for high-capacity battery validation, charge/discharge cyclers, thermal management testers, and durability rigs, while ADAS and autonomous features are boosting adoption of simulators, calibration rigs, cybersecurity tools, and vehicle-in-the-loop systems. Regulatory changes, such as India’s BS-VI Phase II and Euro NCAP’s updated crash protocols, are further accelerating investments in portable emission systems, crash simulators, and integrated ADAS validation platforms.
Automotive Test Equipment Market, By Equipment Type
Wheel alignment testers are shifting from low-cost tools to high-value diagnostic platforms, with modern 3D camera systems offering accuracy up to 0.010 angular measurement and faster results compared to older laser models. Advanced units now integrate ADAS calibration frames, making them critical for post-repair calibration and boosting the average selling price from under USD 10,000 for legacy systems to USD 25,000–40,000 for 3D/ADAS-integrated models. OEM assembly plants in Europe and North America increasingly mandate these testers for end-of-line validation, driving steady capital investment, while authorized service centers are upgrading outdated systems to meet compliance and service requirements. Key suppliers include Hunter, John Bean, and Bosch in premium markets, while cost-effective regional players such as Manatec and Tech Fanatics are gaining adoption in the Asia Pacific.
Automotive Test Equipment Market, By Propulsion
The EV testing equipment market is growing faster than the ICE testing due to the increasing complexity and safety requirements of electric powertrains. EVs drive demand for advanced validation systems for high-voltage batteries, e-axles, and power electronics. Battery testing, including thermal runaway and lifecycle assessments, has become a major growth driver, with new labs and facilities being commissioned by AVL, Horiba, and Applus+ IDIADA in 2024. eAxle testing has also advanced with high-torque, high-speed rigs, highlighting how EV testing is reshaping automotive validation more dynamically than mature ICE testing, which remains focused on compliance-driven emission and durability checks.
REGION
Asia Pacific is estimated to be the largest region in the global automotive test equipment market during the forecast period.
Asia Pacific is estimated to be the largest market for automotive test equipment, driven by production scale, regulatory requirements, and technological adoption. Rising emissions, safety, and durability standards across China, India, Japan, and Southeast Asia are accelerating demand for advanced emissions analyzers, battery testing rigs, HIL systems, and all-weather reliability chambers. Growing vehicle and component exports further increase the need for standardized, flexible, and automated test solutions to meet diverse international certifications. Asia Pacific leads due to its concentrated manufacturing base in China, Japan, India, and South Korea, with OEMs such as BYD, Tata, Hyundai, Toyota, and Suzuki driving procurement and R&D alongside equipment providers such as Horiba, Chroma, AVL, and Yokogawa. Growth is focused on regional test labs, AI-enabled automation, and strategic partnerships. Key demand is rising for battery cyclers, end-of-line state-of-health testers, vibration and crash rigs, and high-voltage safety analyzers to meet regulatory and export requirements.
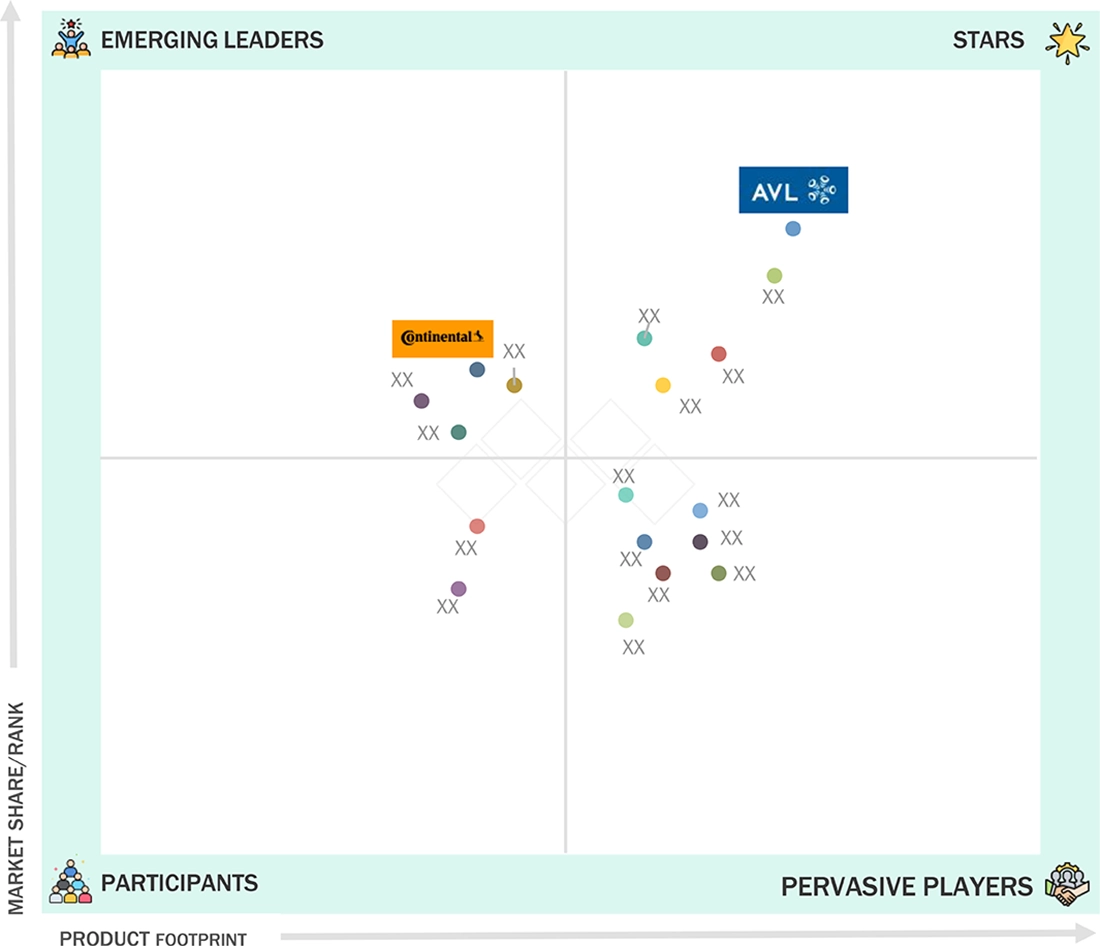
Automotive Test Equipment Market: COMPANY EVALUATION MATRIX
Microquadrant provides information on major automotive test equipment players and outlines the findings and analysis of how well each vendor performs within the predefined criteria. The company evaluation matrix for the automotive test equipment market positions players based on market share/rank and product footprint. In the Stars quadrant, AVL leads the market with strong market presence and a wide product portfolio.
Source: Secondary Research, Interviews with Experts, MarketsandMarkets Analysis
KEY MARKET PLAYERS
MARKET SCOPE
| REPORT METRIC | DETAILS |
|---|---|
| Market Size, 2025 (Value) | USD 3.66 Billion |
| Revenue Forecast, 2032 (Value) | USD 4.79 Billion |
| Growth Rate | CAGR of 3.9% from 2025 to 2032 |
| Actual data | 2021–2032 |
| Base Year | 2024 |
| Forecast Period | 2025–2032 |
| Units Considered | Value (USD Billion and USD Thousand) |
| Report Coverage | Revenue forecast, company ranking, competitive landscape, growth factors, and trends |
| Segments Covered | • By Application: Mobile/Tablet-based Equipment and PC/Laptop-based Equipment • By Vehicle Type: Passenger Cars and Commercial Vehicles • By End Market: OEM Assembly Plant, R&D/ Technical Center, and Authorized Service Center • By Equipment: Chassis Dynamometer, Engine Dynamometer, Transmission Dynamometer, Vehicle Emission Test System, Wheel Alignment Tester, Fuel Injection Pump Tester, Hardware-in-the-Loop (HIL) Test Benches, Battery Test Equipment, eMotor Test Equipment, E-Axle Testing, Vehicle Charging & High Voltage Test Systems, EV Drivetrain Testing, and Others |
| Regional Scope | Asia Pacific, Europe, North America, and Rest of the World |
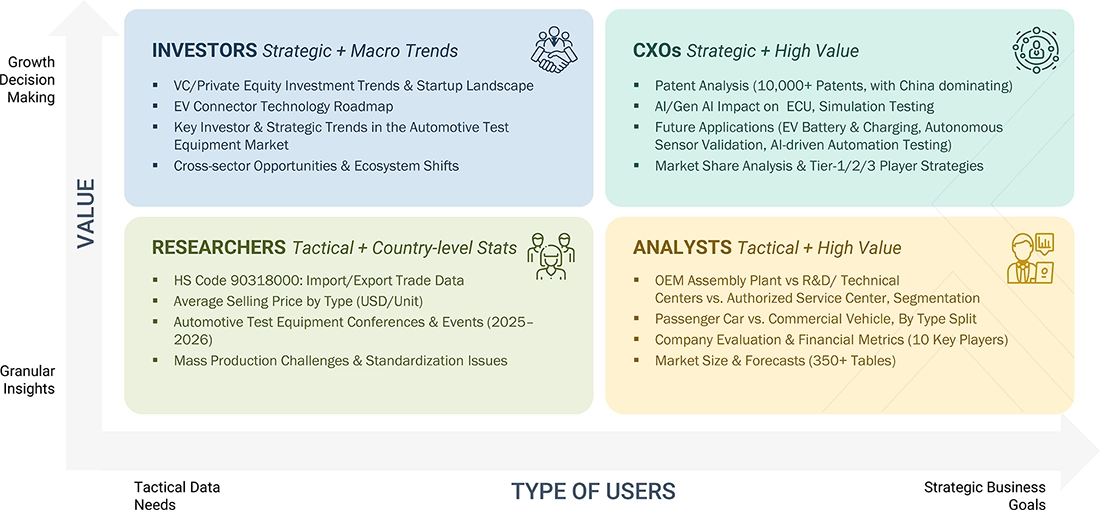
WHAT IS IN IT FOR YOU: Automotive Test Equipment Market REPORT CONTENT GUIDE
DELIVERED CUSTOMIZATIONS
We have successfully delivered the following deep-dive customizations:
| CLIENT REQUEST | CUSTOMIZATION DELIVERED | VALUE ADDS |
|---|---|---|
| APAC-based automotive test equipment manufacturers | • Detailed company profiles of automotive test equipment competitors (financials, product portfolio) • Customer landscape mapping by end-use sector | • Identified & profiled 20+ automotive test equipment companies • Track adoption trends in high-growth APAC industries (EVs and ICEs) • Highlight new customer clusters driven by sustainability mandates |
| Predictive maintenance of test equipment and validation of EV/ICE components | • Hardware-in-the-loop (HIL) and software-in-the-loop (SIL) platforms with AI-based predictive maintenance and automated reporting | • Reduced unplanned equipment downtime, extended asset life, and improved lab and workshop utilization |
| Monitoring battery performance, high-voltage systems, and thermal management in EVs | • Battery cyclers, thermal chambers, and high-voltage analyzers integrated with IoT telematics for real-time performance tracking | • Enhanced safety, ensures accurate EV validation, supported regulatory compliance, and reduced battery-related failures |
RECENT DEVELOPMENTS
- April 2025 : Horiba Group launched the C05-LT, a compact, entry-level 100W PEM benchtop fuel cell test station designed for researchers and engineers. This product offers precise temperature, pressure, and flow control for testing single-cell fuel cells and small stacks, combining high repeatability and accuracy with user-friendly, plug-and-play software. It supports PEM fuel cell performance testing, catalyst and membrane development, and system optimization, and is backed by Horiba’s global service network.
- April 2025 : Mustang Advanced Engineering installed a below-ground custom dynamometer at Texas A&M’s TEES Headquarters for R&D of heavy-duty trucks, including EVs; the system simulates various road and temperature conditions and supports 80,000-pound GVWR testing in collaboration with the Texas Department of Transportation.
- March 2025 : Horiba Group launched the MEXAcube, a compact emissions measurement system integrating IRLAM technology to measure nine emission components, including NH3, N2O, and HCHO, aligning with Euro 7 and other upcoming Horiba Group launched the MEXAcube, a compact emissions measurement system integrating IRLAM technology to measure nine emission components, including NH3, N2O, and HCHO, aligning with Euro 7 and other upcoming regulations; it supports both laboratory and on-road RDE tests, reduces power consumption by 80%, and lowers part replacement frequency by 30%, addressing the growing demand for carbon-neutral fuel emission testing such as hydrogen and ammonia.
- February 2025 : AVL India launched a cell testing lab in Pune, Maharashtra, equipped with a climatic chamber for precise environmental testing. The facility is designed to enable high-safety, high-precision innovation in battery cell testing.
Table of Contents
 Exclusive indicates content/data unique to MarketsandMarkets and not available with any competitors.
Methodology
The research study involved extensive use of secondary sources such as company annual reports/presentations, industry association publications, magazines, directories, technical handbooks, World Economic Outlook, trade websites, technical articles, and databases to identify and collect information on the automotive test equipment market. In-depth interviews were conducted with various primary sources—experts from related industries, automobile OEMs, and suppliers—to obtain and verify critical information and assess the growth prospects and market estimations.
Secondary Research
In the secondary research process, various secondary sources were used to identify and collect information on the automotive test equipment for this study. The secondary sources referred to for this research study include automotive industry organizations (such as Organisation Internationale des Constructeurs d'Automobiles (OICA), automotive test equipment manufacturers, Automotive Services Association (ASA), and automotive testing service providers companies, regulatory bodies, corporate filings (such as annual reports, investor presentations, and financial statements) and trade, business, and automotive associations. Secondary data has been collected and analyzed to arrive at the overall market size, which has been further validated through primary research.
Primary Research
Extensive primary research has been conducted after acquiring an understanding of the automotive test equipment market scenario through secondary research. Several primary interviews have been conducted with market experts from both the demand (OEM, authorized service centers, and R&D centers) and supply sides (automotive test equipment manufacturers and distributors), and players across four major regions: North America, Europe, the Asia Pacific, and the Rest of the World. Approximately 50% primary interviews from the demand side and 50% from the supply side have been conducted. Primary data has been collected through questionnaires, emails, and telephonic interviews.
In our canvassing of primaries, various departments within organizations, such as sales, operations, and administration, were covered to provide a holistic viewpoint in the report. After interacting with industry participants, brief sessions with highly experienced independent consultants were conducted to reinforce the findings from our primaries. This, along with the in-house subject-matter experts’ opinions, led to the findings described in the remainder of this report.

To know about the assumptions considered for the study, download the pdf brochure
Market Size Estimation
A detailed market estimation approach was followed to estimate and validate the size of the automotive test equipment market and other dependent submarkets, as mentioned below:
- Key players in the automotive test equipment market were identified through secondary research, and their global market share was determined through primary and secondary research.
- The research methodology included the study of automotive testing spending by Tier-1 companies and estimates on the outsourcing of different applications to testing service providers.
- The research methodology included the study of the annual and quarterly financial reports and regulatory filings of major market players, as well as interviews with industry experts for detailed market insights.
- All major penetration rates, percentage shares, splits, and breakdowns for the applications & services of the automotive test equipment market were determined by using secondary sources and verified through primary sources.
- All key macroindicators affecting the revenue growth of the market segments and subsegments were accounted for, viewed in extensive detail, verified through primary research, and analyzed to get the validated and verified quantitative & qualitative data.
- The gathered market data was consolidated and added with detailed inputs, analyzed, and presented in this report.
Automotive Test Equipment Market : Top-Down and Bottom-Up Approach

Data Triangulation
After arriving at the overall market size of the global market through the above-mentioned methodology, this market was split into several segments and subsegments. The data triangulation and market breakdown procedures were employed, wherever applicable, to complete the overall market engineering process and arrive at the exact data for the market by value for the key segments and subsegments. The extrapolated market data was triangulated by studying various macroindicators and regional trends from both the demand and supply-side participants.
Market Definition
Automotive test equipment refers to specialized tools and systems designed to evaluate, verify, and validate the performance, safety, and compliance of automotive components, subsystems, and complete vehicles throughout their development, production, and maintenance lifecycles. This equipment encompasses a broad spectrum ranging from traditional internal combustion engine (ICE) testing devices to advanced electric vehicle (EV) test platforms.
Stakeholders
- ADAS Manufacturers
- Aftermarket Service Providers
- Associations, Forums, and Alliances Related to Automotive Software
- Authorized and Independent Automobile Service Centers
- Automotive Component Manufacturers
- Automotive Dealers and Distributors
- Automotive Electronic Control Unit Manufacturers
- Automotive OEMs
- Automotive Test Equipment Manufacturers
- Autonomous Vehicle Manufacturers
- Autonomous Vehicle System Suppliers
- ECU Manufacturers
- Electrical and Electronic Component Suppliers
- EV Charging Manufacturers and Service Providers
- EV Component Manufacturers
- Government & Regulatory Bodies
- Legal and Regulatory Authorities
- Raw Material Suppliers for Automotive Test Equipment
- Research & Development (R&D) Centers
- Software Providers & Simulation Specialists
- Tier-1 and Tier-2 Suppliers
- Vehicle Safety Regulatory Bodies
Report Objectives
-
To segment and forecast the size of the automotive test equipment market in terms of value (USD million) from 2021 to 2032
- To define, describe, and forecast the market based on application, equipment type, vehicle type, end market, propulsion, and region
- To segment and forecast the market size of the automotive test equipment market by application (mobile/tablet-based equipment and PC/Laptop-based equipment)
- To segment and forecast the market size of the automotive test equipment market by vehicle type (passenger car and commercial vehicle)
- To segment and forecast the market size by end market (OEM assembly plant, R&D/ Technical center, and authorized service center)
- To segment and forecast the market size of automotive test equipment market by equipment (chassis dynamometer, engine dynamometer, transmission dynamometer, vehicle emission test system, wheel alignment tester, fuel injection pump tester, hardware-in-the-loop (HIL) test benches, battery test equipment, e-motor test equipment, e-axle testing, vehicle charging & high voltage test systems, EV drivetrain testing, and others)
- To forecast the market size with respect to key regions: the Asia Pacific, Europe, North America, and the Rest of the World
- To qualitatively study the market by advanced technology (sensor testing, perception system testing, ECU testing, ADAS testing, simulation testing, edge computing, and V2X testing)
- To provide detailed information regarding the major factors influencing the market growth (drivers, challenges, restraints, and opportunities)
- To strategically analyze markets with respect to individual growth trends, prospects, and contributions to the total market
- To strategically profile key players and comprehensively analyze their market share and core competencies
-
To study the following with respect to the market:
- Supply Chain Analysis
- Ecosystem Analysis
- Technology Analysis
- HS Code Analysis
- Case Study Analysis
- Patent Analysis
- Regulatory Landscape
- Conferences and Events
- Influences of Stakeholders and Buying Criteria
- Impact of AI
- Investment and Funding Scenario
- To analyze opportunities for stakeholders and the competitive landscape for market leaders
- To track and analyze competitive developments such as product developments, deals, and others undertaken by the key industry participants
Available Customizations
With the given market data, MarketsandMarkets offers customizations in accordance with the company’s specific needs.
Automotive Test Equipment Market, By Advanced Technology at the regional level
Automotive Test Equipment Market, By Product Type at the country level
Automotive Test Equipment Market, By End Market at the country level
Company Information
- Profiling of Additional Market Players (Up to 3)
Key Questions Addressed by the Report
What is the current size of the automotive test equipment market by value?
The size of the automotive test equipment market is estimated at USD 3.66 billion in 2025.
Who are the winners in the automotive test equipment market?
The automotive test equipment market is dominated by established players such as AVL (Austria), Horiba, Ltd. (Japan), Robert Bosch GmbH (Germany), Phinia Inc.(US), and Illinois Tool Works Inc. (US).
Which region will be the fastest-growing market for the automotive test equipment market?
The Asia Pacific is the fastest-growing market for automotive test equipment as its large vehicle production base naturally drives higher testing demand. Rapid EV adoption across China, India, Japan, and South Korea further increases the need for battery, powertrain, and ADAS validation systems. Stricter emission and safety norms combined with government-led incentives for electrification act as key drivers, while cost-efficient local supply chains ensure sustained momentum, making the region the core engine of global market growth.
What are the new trends impacting the growth of the automotive test equipment market?
The key trends affecting the growth of the automotive test equipment market are the shift to EV and battery testing, adoption of HiL/SiL and digital twin platforms, and rising demand for ADAS and autonomous validation systems. Stricter regulations, automated end-of-line testing, and connected vehicle/OTA testing are further accelerating this transition toward a software- and electrification-driven ecosystem.
What countries are covered in the North American automotive test equipment market?
The countries covered are the US, Canada and Mexico.
Need a Tailored Report?
Customize this report to your needs
Get 10% FREE Customization
Customize This ReportPersonalize This Research
- Triangulate with your Own Data
- Get Data as per your Format and Definition
- Gain a Deeper Dive on a Specific Application, Geography, Customer or Competitor
- Any level of Personalization
Let Us Help You
- What are the Known and Unknown Adjacencies Impacting the Automotive Test Equipment Market
- What will your New Revenue Sources be?
- Who will be your Top Customer; what will make them switch?
- Defend your Market Share or Win Competitors
- Get a Scorecard for Target Partners

Custom Market Research Services
We Will Customise The Research For You, In Case The Report Listed Above Does Not Meet With Your Requirements
Get 10% Free CustomisationTESTIMONIALS

JIM NAAS
PRODUCT DIRECTOR, WEASLER
Weasler Engineering, a CentroMotion organization
Global Provider of Industrial Actuation & Control Solutionswww.weasler.com
Our organization was interested in learning more about the attractiveness of a particular market space. We contacted MarketsandMarkets to help us based on previous positive experiences we had with them. The results did not disappoint! We discussed our objectives with them, and the team at MarketsandMarkets developed and executed a proposal that met our needs precisely. We were very impressed by their level of expertise, the quality of the analysis and their insightful recommendations. We would not hesitate in working with them again in the future.

Matt Kardel,
Vice President
Aptiv,
A global technology company that develops safer, greener and more connected solutions.www.aptiv.com
We contracted with
MarketsandMarkets to evaluate the value chain and potential go-to-market partners related to our
interest in the Fleet Management space. The team successfully completed the work on time and at the
pricing agreed. MarketsandMarkets listened and understood our objectives and collaborated well with
us to help us get the visibility we needed to make an investment.
We have subsequently used
MarketsandMarkets again related to Smart Cities to good results.


Growth opportunities and latent adjacency in Automotive Test Equipment Market