
Edge AI Chip Market Size, Share & Trends, 2025 To 2030

Edge AI Chip Market by Device, Processor (CPU, GPU, and ASIC), Function, Power Consumption (Less than 1 W, 1-3 W, >3-5 W, >5-10 W, and More than 10 W), Vertical and Region - Global Forecast to 2030


OVERVIEW
Source: Secondary Research, Interviews with Experts, MarketsandMarkets Analysis
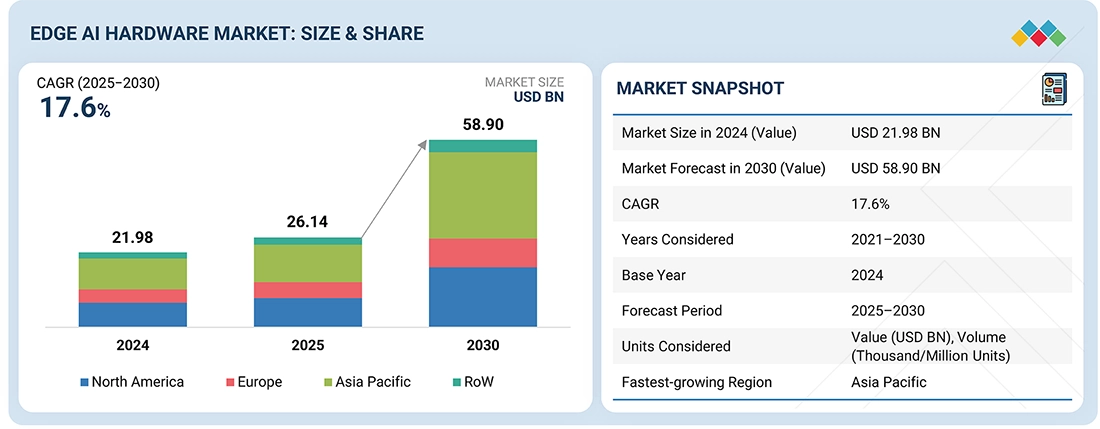
The edge AI hardware market is projected to reach USD 58.90 billion by 2030 from USD 26.14 billion in 2025, at a CAGR of 17.6% during the forecast period. A key market driver for edge AI hardware is the growing deployment of IoT devices across various industries, including smart homes, industrial automation, healthcare, and transportation. Many of these applications require real-time data processing so decision-making can occur locally rather than in the cloud.
Market Size & Forecast
KEY TAKEAWAYS
-
BY DEVICEBy device type, the smartphone segment accounted for a market share of 80.5% in terms of volume in 2024.
-
BY FUNCTIONIn 2024, the inference segment accounted for 99.8% of the market share in terms of volume.
-
BY POWER CONSUMPTIONIn 2024, devices with a power consumption of 1-3 W are expected to account for 80.5% of the market share in terms of volume.
-
BY PROCESSORBy processor, the CPU segment accounted for a market share of 88.8% in terms of volume in 2024.
-
BY VERTICALBy vertical, the consumer electronics segment accounted for a market share of 81.3% in terms of volume in 2024.
-
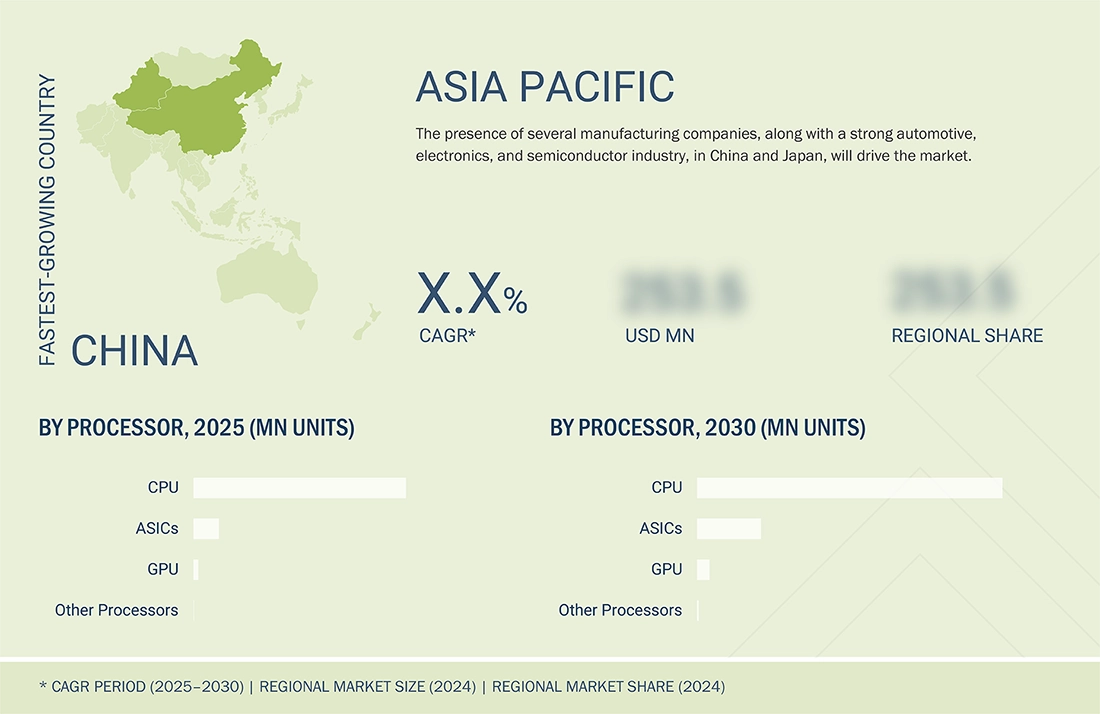
BY REGIONThe Asia Pacific dominated the edge AI hardware market, accounting for a 41.0% share in terms of volume in 2024.
-
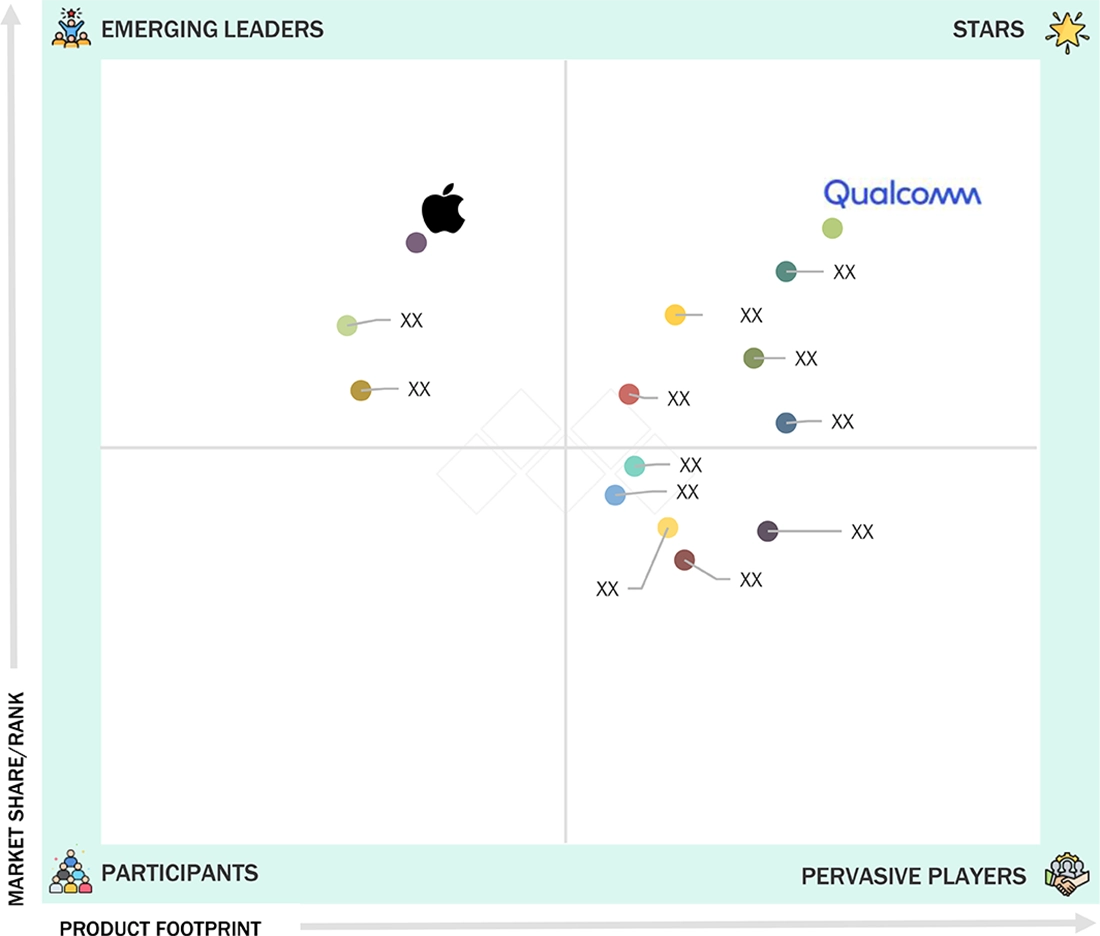
COMPETITIVE LANDSCAPEQualcomm Technologies, Inc. (US) is recognized as a leading player in the edge AI hardware market, while Apple Inc. (US) is considered an emerging leader. Key strategies employed by companies in this ecosystem to enhance their product offerings, increase market share, and expand their presence include product launches, partnerships, and acquisitions.
The edge AI hardware market is driven by several factors, including the growing demand for IoT-based edge computing solutions, the rising adoption of 5G networks that integrate IT and telecom, and the increasing need for dedicated AI processors for on-device image analytics. However, the market's growth potential is significantly hindered by limited on-device training capabilities and a notable shortage of skilled AI professionals. Additionally, designing efficient AI systems presents substantial challenges for the edge AI hardware market.
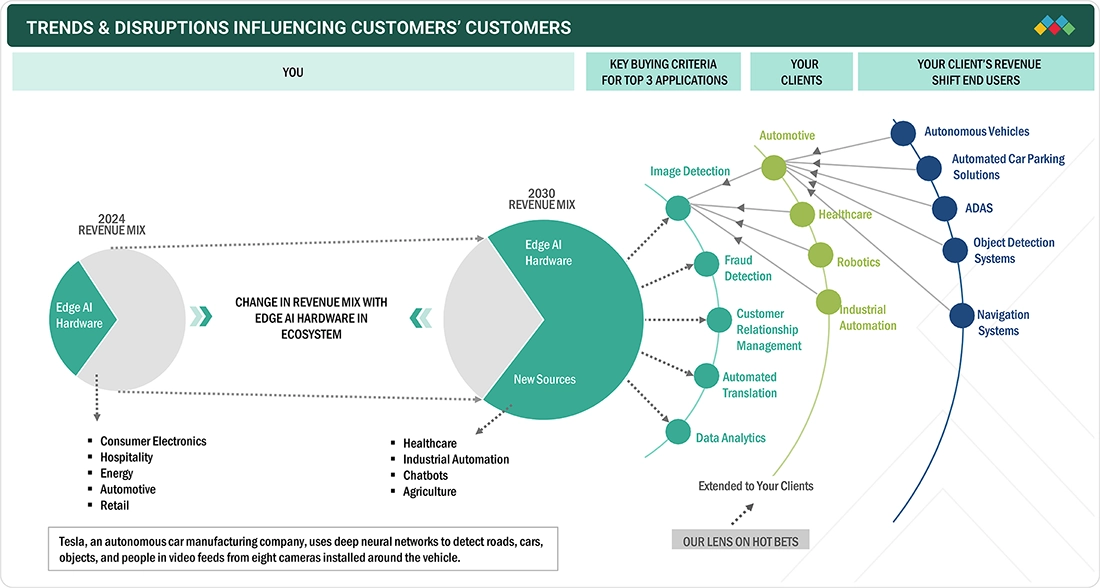
TRENDS & DISRUPTIONS IMPACTING CUSTOMERS' CUSTOMERS
The diagram illustrates the evolving role of edge AI hardware, transitioning from consumer-focused applications in 2024—such as electronics, hospitality, and retail—to more industrial and enterprise-driven applications by 2030, including healthcare, automation, chatbots, and agriculture. This shift reflects the increasing demand for edge AI in high-value use cases, such as image detection, fraud detection, data analytics, and automated translation. Industries like automotive, healthcare, and manufacturing are integrating edge AI to enable advanced functionalities, ranging from advanced driver assistance systems (ADAS) and autonomous vehicles to robotics and industrial automation. A notable example is Tesla, which utilizes edge-based deep learning for real-time object detection. Overall, the market is shifting toward mission-critical, low-latency applications, positioning edge AI as a crucial enabler of next-generation industry solutions.
Source: Secondary Research, Interviews with Experts, MarketsandMarkets Analysis
MARKET DYNAMICS
Level
-
Need for real-time data processing and reduced cloud dependency

-
Development of dedicated AI processing units for edge device applications

Level
-
Complexities associated with network implementation

Level
-
Advancements in edge AI hardware through generative AI workload optimization

-
Development of on-device visual processors for next-generation mobile AI applications

Level
-
Balancing performance and power consumption in edge AI systems

-
Developing cohesive edge AI standards across diverse industry requirements

Source: Secondary Research, Interviews with Experts, MarketsandMarkets Analysis
Driver: Development of dedicated AI processing units for edge device applications
AI processors are increasingly designed for both data centers and edge devices, with companies like Intel, Samsung, and Huawei developing SoCs featuring integrated NPUs for on-device AI tasks such as recognition and translation. The surge in IoT devices drives the need for real-time edge processing to minimize cloud latency and enable faster automated decisions.
Restraint: Complexities associated with network implementation
The widespread adoption of edge AI faces challenges such as limited computational power, restricted access to large datasets, and dependency on pre-trained models that cannot match cloud-based AI capabilities. Building and maintaining the required infrastructure is costly and complex, particularly in developing regions. Moreover, edge systems often struggle to balance performance with operational costs, sometimes sacrificing data to conserve storage.
Opportunity: Opportunities in ultra-low latency AI applications with 5G-powered edge infrastructure
The rollout of 5G networks is driving convergence between IT and telecom, enabling low-latency edge computing and advanced AI applications in sectors like autonomous vehicles, industrial automation, and robotics. This shift creates strong growth opportunities for hardware, software, and service providers offering integrated 5G-edge AI solutions.
Challenge: Balancing performance and power consumption in edge AI systems
Power consumption is a key constraint for edge AI devices, requiring developers to balance performance and energy efficiency through model optimization, hardware tuning, and power management techniques. As edge AI expands into IoT, healthcare, and autonomous systems, achieving high computational performance within limited power budgets remains a critical design challenge.
Edge AI Hardware Market: COMMERCIAL USE CASES ACROSS INDUSTRIES
| COMPANY | USE CASE DESCRIPTION | BENEFITS |
|---|---|---|
 |
Hailo-8 AI processor in smart security cameras for anomaly detection | Real-time surveillance, reduced bandwidth usage, and energy-efficient processing |
 |
Apple Neural Engine in iPhones for on-device image recognition and AR applications | Fast on-device inference, enhanced privacy, and low power consumption |
 |
Movidius Myriad X in retail for smart cameras analyzing customer behavior | Personalized shopping experiences, reduced theft, and optimized store layouts |
 |
Snapdragon Edge AI in drones for aerial inspection of infrastructure | Low-latency processing, enhanced safety, reduced operational costs |
Logos and trademarks shown above are the property of their respective owners. Their use here is for informational and illustrative purposes only.
MARKET ECOSYSTEM
The ecosystem analysis of the edge AI hardware market encompasses a diverse range of stakeholders, including original equipment manufacturers (OEMs), hardware providers, and edge AI software/platform providers. Key OEMs such as NVIDIA, Intel, Apple, MediaTek, and Huawei drive hardware innovation, while leading hardware providers such as Samsung, Micron, Microsoft, Qualcomm, and Hailo supply essential components and technologies. The ecosystem also features edge AI software and platform providers such as Synaptics, TIBCO, Octonion Group, and Tact.ai, highlighting the collaborative landscape required to deliver comprehensive edge AI solutions across industries.
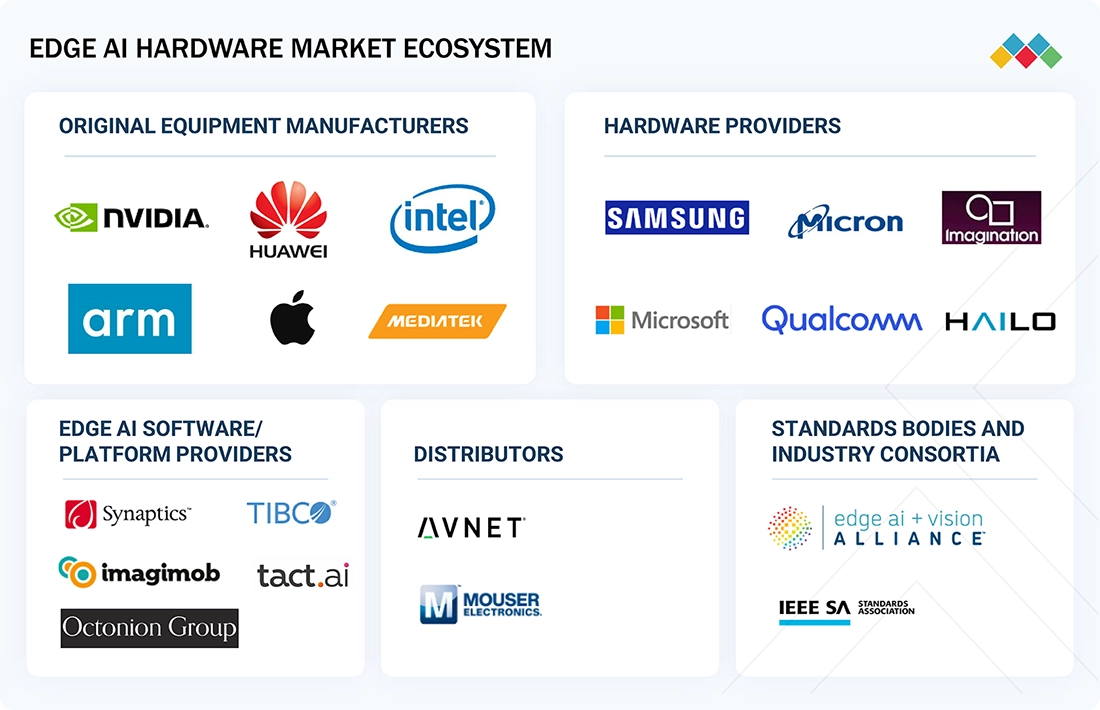
Logos and trademarks shown above are the property of their respective owners. Their use here is for informational and illustrative purposes only.
MARKET SEGMENTS
Source: Secondary Research, Interviews with Experts, MarketsandMarkets Analysis
Edge AI Hardware Market, by Device
Smartphones accounted for the largest share of the edge AI hardware market, in terms of volume, in 2024. The increasing demand for smartphones is expected to drive the growth of the edge AI hardware market in the coming years. Edge AI enhances smartphones with improved imaging, power efficiency, and security. The wearables segment is projected to experience the highest growth rate during the forecast period.
Edge AI Hardware Market, by Function
Inference is expected to dominate the edge AI hardware market because most edge applications focus on real-time data processing, where pre-trained models are used for fast decision-making. Edge devices, ranging from smartphones to industrial sensors, primarily perform inference rather than the resource-intensive task of training. Furthermore, the increasing adoption of IoT devices, autonomous systems, and AI-enabled consumer electronics is driving a high demand for efficient, low-latency inference solutions at the edge.
Edge AI Hardware Market, By Power Consumption
Edge AI devices consuming 1-3 W of electricity are likely to dominate the market throughout the forecast period, accounting for a majority of the market share. Smartphones are the major devices that consume 1-3 W of electrical energy. As the demand for smartphones increases, the market for edge AI hardware products consuming 1-3 W of electricity is likely to witness significant growth during the forecast period.
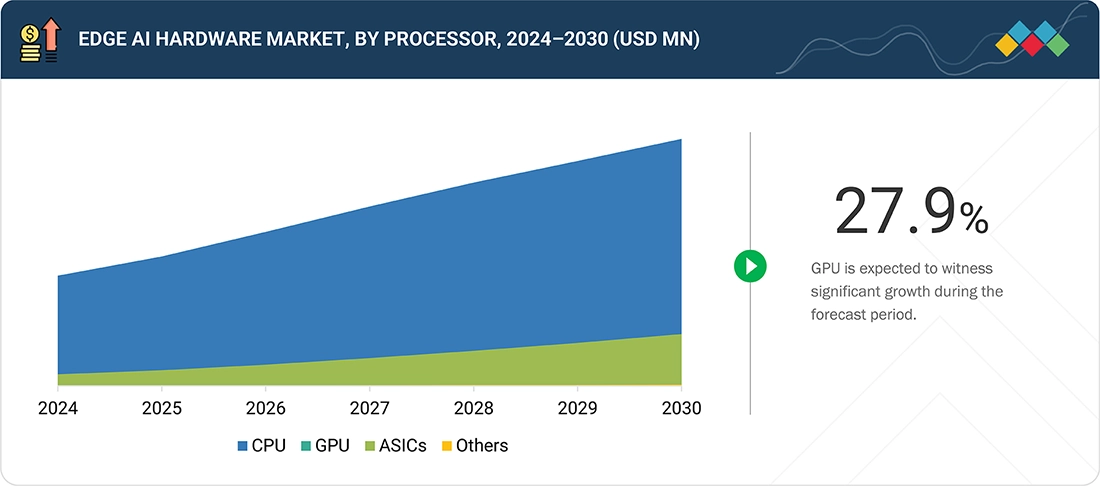
Edge AI Hardware Market, by Processor
CPU is expected to have the largest market share during the forecast period. CPU is the most used processor for on-device inference in smartphones, smart speakers, and wearables. CPUs for edge AI in smartphones include Apple's A11 and A12 Bionic chips, Qualcomm's Snapdragon 845 and 855, Samsung's Exynos 9820, and Huawei's Kirin 980.
Edge AI Hardware Market, by Vertical
The aerospace & defense vertical is expected to witness the highest CAGR in the edge AI hardware market due to the urgent need for real-time data processing, advanced threat detection, and autonomous system capabilities in mission-critical environments. The integration of edge AI hardware enables faster and more secure decision-making by processing vast volumes of sensor and surveillance data locally, which is essential for applications such as drone swarms, electronic warfare, and predictive maintenance.
By REGION
Asia Pacific is expected to be the fastest-growing region in the global edge AI hardware market during the forecast period
The Asia Pacific region is expected to be the fastest-growing market for edge AI hardware due to rapid technology adoption, strong government backing, and major manufacturing sites. Countries such as China, Japan, South Korea, and India are investing significantly in AI, IoT, and 5G infrastructure that enable AI-centric technology through edge-enabled applications.
The North American edge AI hardware market is projected to reach 716.7 million units by 2030 from 349.8 million units in 2025, at a CAGR of 15.4% during the forecast period. A key market driver is the growing deployment of IoT devices across various industries, including smart homes, industrial automation, healthcare, and transportation. Many of these applications require real-time data processing, allowing decision-making to occur locally rather than in the cloud.
The European edge AI hardware market is projected to reach 344.0 million units by 2030 from 189.7 million units in 2025, at a CAGR of 12.6% during the forecast period. The growth of the European edge AI hardware market is driven by the growing deployment of IoT devices across various industries, including smart homes, industrial automation, healthcare, and transportation. These applications require real-time data processing, allowing decision-making to occur locally rather than in the cloud.
Edge AI Hardware Market: COMPANY EVALUATION MATRIX
Star players typically receive high scores across most evaluation criteria. They possess strong service portfolios, a solid market presence, and effective business strategies. These leading market players are at the forefront of new developments, including product launches, innovative technologies, and the implementation of strategic growth plans. The star players in the edge AI hardware market are Qualcomm Technologies, Inc. (US), Intel Corporation (US), NVIDIA Corporation (US), Huawei Technologies Co., Ltd. (China), SAMSUNG (South Korea), and MediaTek Inc. (Taiwan). Emerging leaders demonstrate a more substantial product innovation than their competitors. They have a highly focused product portfolio. However, they lack effective growth strategies for their overall business. The emerging leaders in the edge Al hardware market are Apple Inc. (US), Google (US), and IBM (US).
Source: Secondary Research, Interviews with Experts, MarketsandMarkets Analysis
KEY MARKET PLAYERS
MARKET SCOPE
| REPORT METRIC | DETAILS |
|---|---|
| Market Size in 2024 (Value) | USD 21.98 Billion |
| Market Forecast in 2030 (Value) | USD 58.90 Billion |
| Growth Rate | CAGR of 17.6% from 2025–2030 |
| Years Considered | 2021–2030 |
| Base Year | 2024 |
| Forecast Period | 2025–2030 |
| Units Considered | Value (USD Billion), Volume (Thousand/Million Units) |
| Report Coverage | Revenue Forecast, Company Ranking, Competitive Landscape, Growth Factors, and Trends |
| Segments Covered |
|
| Regions Covered | North America, Asia Pacific, Europe, and Rest of the World |
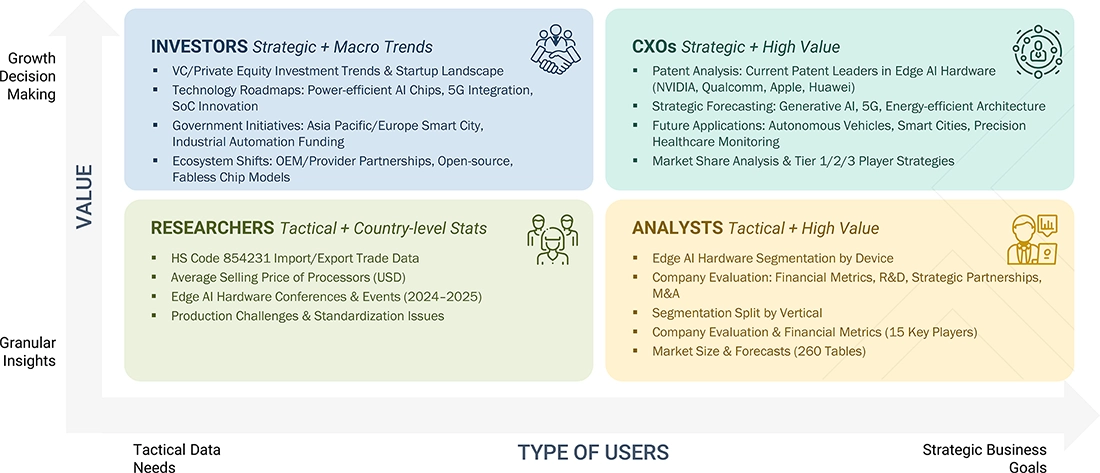
WHAT IS IN IT FOR YOU: Edge AI Hardware Market REPORT CONTENT GUIDE
DELIVERED CUSTOMIZATIONS
We have successfully delivered the following deep-dive customizations:
| CLIENT REQUEST | CUSTOMIZATION DELIVERED | VALUE ADDS |
|---|---|---|
| Qualitative Benchmarking of User Experience in Edge AI Devices | Compiled case studies and direct user feedback on edge inference in smart health wearables, focusing on user trust, privacy perceptions, and satisfaction with latency, battery life, and on-device analytics |
|
| AI Hardware Manufacturer |
|
|
RECENT DEVELOPMENTS
- May 2025 : The company released the Galaxy S25, S25+, S25 Ultra, and S25 Edge smartphones, which integrate advanced edge AI capabilities through Galaxy AI, enabling on-device processing for personalized, context-aware experiences. Features include AI agents that operate across multiple apps, real-time photo and audio editing, and privacy-focused on-device data handling powered by the Snapdragon 8 Elite Mobile Platform for Galaxy.
- February 2025 : Apple collaborated with educational institutions (e.g., UCLA’s Center for Education of Microchip Designers) to bolster AI and silicon engineering talent, which will support future edge AI initiatives.
- February 2024 : At Mobile World Congress (MWC) 2024, the company announced the launch of the Snapdragon X80. It is Qualcomm’s seventh-generation 5G modem and the second to feature dedicated AI tensor cores. It supports peak download speeds of 10 Gbps and upload speeds of 3.5 Gbps. Notably, it is the first 5G modem with integrated NB-NTN for satellite communications, enhancing global connectivity.
- April 2024 : Huawei Technologies Co., Ltd. (China) entered into a strategic partnership with the China Building Materials Federation and Conch Group to advance the deployment of edge AI solutions across key industries. The collaboration targets applications in manufacturing, such as AI-driven cement production, as well as the telecom and smart infrastructure sectors. The joint initiative emphasizes the integration of AI models with edge computing to accelerate digital transformation and enhance operational efficiency.
- November 2023 : MediaTek introduced the Dimensity 9300 flagship mobile chip with a one-of-a-kind all-big core design. The unique configuration combines extreme performance with MediaTek’s industry-leading power efficiency to deliver unmatched user experiences in gaming, video capture, and on-device generative AI processing.
Table of Contents
 Exclusive indicates content/data unique to MarketsandMarkets and not available with any competitors.
Methodology
The research process for this study included systematic gathering, recording, and analysis of data about customers and companies operating in the edge AI hardware market. This process involved the extensive use of secondary sources, directories, and databases (Factiva and OneSource) to identify and collect valuable information for the comprehensive, technical, market-oriented, and commercial study of the edge AI hardware market. In-depth interviews were conducted with primary respondents, including experts from core and related industries and preferred manufacturers, to obtain and verify critical qualitative and quantitative information and assess growth prospects. Key players in the edge AI hardware market were identified through secondary research, and their market rankings were determined through primary and secondary research. This research included studying annual reports of top players and interviewing key industry experts such as CEOs, directors, and marketing executives.
Secondary Research
Various secondary sources have been referred to in the secondary research process for identifying and collecting information pertinent to this study. The secondary sources include annual reports, press releases, and investor presentations of companies; white papers, certified publications, and articles by recognized authors; directories; and databases. Secondary research has been mainly carried out to obtain key information about the supply chain of the edge AI hardware industry, the value chain of the market, the total pool of the key players, market classification, and segmentation according to the industry trends to the bottom-most level, geographic markets, and key developments from both market- and technology-oriented perspectives.
Primary Research
In the primary research process, various sources from the supply and demand sides have been interviewed to obtain qualitative and quantitative information for this report. Primary sources from the supply side included industry experts such as CEOs, VPs, marketing directors, technology and innovation directors, and key executives from major companies and organizations operating in the edge AI hardware market. After going through the entire market engineering (which includes calculations for market statistics, market breakdown, market size estimations, market forecasting, and data triangulation), extensive primary research has been conducted to gather information and verify and validate the obtained critical numbers. Primary research has been conducted to identify segmentation types, industry trends, key players, competitive landscape, and key market dynamics such as drivers, restraints, opportunities, and challenges, along with the key strategies adopted by players operating in the market.

Note: The three tiers of the companies have been defined based on their total/segmental revenue as of 2024: Tier 1 = >USD 1 billion, Tier 2 = USD 1 billion–USD 500 million, and Tier 3 = USD 500 million. Others include sales, marketing, and product managers.
To know about the assumptions considered for the study, download the pdf brochure
Market Size Estimation
In the complete market engineering process, top-down and bottom-up approaches and several data triangulation methods have been used to estimate and forecast the size of the market and its segments and subsegments listed in the report. Extensive qualitative and quantitative analyses have been carried out on the complete market engineering process to list the key information/insights about the edge AI hardware market.
The key players in the market have been identified through secondary research, and their rankings in the respective regions have been determined through primary and secondary research. This entire procedure involved the study of the annual and financial reports of top players and interviews with industry experts such as chief executive officers, vice presidents, directors, and marketing executives for quantitative and qualitative key insights. All percentage shares, splits, and breakdowns have been determined using secondary sources and verified through primary sources. All parameters that affect the markets covered in this research study have been accounted for, viewed in extensive detail, verified through primary research, and analyzed to obtain the final quantitative and qualitative data. This data has been consolidated and enhanced with detailed inputs and analysis from MarketsandMarkets and presented in this report.
Edge AI Hardware Market : Top-Down and Bottom-Up Approach

Data Triangulation
After arriving at the overall market size from the above estimation process, the total market has been split into several segments and subsegments. Data triangulation and market breakdown procedures have been employed to complete the overall market engineering process and arrive at the exact statistics for all the segments and subsegments, wherever applicable. The data has been triangulated by studying various factors and trends from both the demand and supply sides. The market has also been validated using both top-down and bottom-up approaches.
Market Definition
Artificial intelligence (AI) technology is now implemented in smartphones, automobiles, drones, and robots. Edge AI is the combination of edge computing and artificial intelligence. Edge AI is the implementation of AI applications in devices throughout the physical world. In this technique, the computation of AI is done near the user at the edge of the network, close to where the data is located, rather than centrally in a cloud computing facility or private data centers. Edge AI offers a way to process data faster than cloud processing. The release of low-power and high-computing processors has led to integrating AI algorithms into devices. Developing dedicated AI processors for edge devices has resulted in AI inference performed on devices rather than the cloud platform.
Key Stakeholders
- Semiconductor companies
- Technology providers
- Universities and research organizations
- System integrators
- AI solution providers
- AI platform providers
- AI system providers
- Investors and venture capitalists
- Manufacturers and people implementing AI technology
- Government agencies
- IoT providers
- Consulting firms
Report Objectives
- To define, describe, and forecast the edge artificial intelligence (AI) hardware market, in terms of volume, by processor, power consumption, device, function, vertical, and region
- To describe and forecast the market, in terms of value, by region—North America, Europe, Asia Pacific, and RoW (South America, Africa, and the Middle East)
- To define, describe, and forecast the global edge AI hardware market, in terms of value
- To provide detailed information regarding factors (drivers, restraints, opportunities, and challenges) influencing market growth
- To provide a detailed overview of the process flow of the edge AI hardware market
- To analyze supply chain, market/ecosystem map, trend/disruptions impacting customer business, technology analysis, Porter's five force analysis, trade analysis, case study analysis, patent analysis, key conferences & events, and regulations related to the edge AI hardware market
- To analyze opportunities for stakeholders in the edge AI hardware market by identifying the high-growth segments
- To strategically analyze micro markets concerning individual growth trends, prospects, and contributions to the overall market
- To strategically profile the key players and comprehensively analyze their market shares and core competencies, along with detailing the competitive leadership and analyzing growth strategies, such as product launches and developments, expansions, acquisitions, and partnerships of leading players
- Analyzing opportunities in the market for stakeholders and providing a competitive landscape for the market
Key Questions Addressed by the Report
What will the edge AI hardware market size be in 2025 and 2030?
The edge AI hardware market is projected to reach USD 58.90 billion by 2030 from USD 26.14 billion in 2025, at a CAGR of 17.6%.
What are the major driving factors and opportunities in the edge AI hardware market?
Optimizing edge AI hardware with generative AI workloads and launching 5G networks are a few major opportunities in the market.
Who are the leading global edge AI hardware market players?
The major players in edge AI hardware include Qualcomm Technologies, Inc. (US), Huawei Technologies Co., Ltd. (China), SAMSUNG (South Korea), Apple Inc. (US), and MediaTek Inc. (Taiwan), among others.
Which vertical is expected to have the major market size during the forecast period?
Consumer electronics is likely to be the major vertical in the edge AI hardware market.
Which will be the fastest-growing region?
The Asia Pacific region is expected to experience the fastest growth in the market, driven by several manufacturing companies and the strong presence of automobile, electronics, and semiconductor companies in China and Japan.
Need a Tailored Report?
Customize this report to your needs
Get 10% FREE Customization
Customize This ReportPersonalize This Research
- Triangulate with your Own Data
- Get Data as per your Format and Definition
- Gain a Deeper Dive on a Specific Application, Geography, Customer or Competitor
- Any level of Personalization
Let Us Help You
- What are the Known and Unknown Adjacencies Impacting the Edge AI Chip Market
- What will your New Revenue Sources be?
- Who will be your Top Customer; what will make them switch?
- Defend your Market Share or Win Competitors
- Get a Scorecard for Target Partners

Custom Market Research Services
We Will Customise The Research For You, In Case The Report Listed Above Does Not Meet With Your Requirements
Get 10% Free CustomisationTESTIMONIALS

Tetsuya Ohhira
Business Development Manager-Technology Business
Nikon Corporation,
Leading Japanese MNC specializing in optics and imaging productswww.nikon.com
MarketsandMarkets™ response
is quick. Their attitude is flexible and positive. Analyst Insights are globally considered and
significant. Client Services quickly respond to our inquiry and demand. Their wide range of global
surveys help us make our strategic plan.
We hope Knowledge Store will be easier to search
for a report.
VP - Marketing & Business Development
Leading Provider of Process Control Solutions
We engaged with MarketsandMarkets on a study to perform an analysis and recommend a Go-To-Market strategy for metrology and process control in the semiconductor market. The study was tailored to our targets and needs with well-defined milestones. Our overall experience with the MarketsandMarkets team was very good throughout the project in all aspects including the analysis methodologies used, the quality and depth of primary and secondary data sets, the professionalism and flexibility of the team and the ability to meet the target schedule and milestones. We want to thank MarketsandMarkets team for a job well done.

Still Researching the
Edge AI Chip Ecosystem?
See the competitors, opportunity evaluation, and growth signals shaping it - Instantly!
Generate 15+ consulting-grade strategic intelligence outputs - from competitor analysis to board-ready strategy decks, tailored to your Edge AI Chip growth question.


Growth opportunities and latent adjacency in Edge AI Chip Market