The study involved four major activities for estimating the current size of the global electronic chemicals and materials market. Exhaustive secondary research was carried out to collect information on the market, the peer product market, and the parent product group market. The next step was to validate these findings, assumptions, and sizes with the industry experts across the value chain of electronic chemicals and materials through primary research. Both the top-down and bottom-up approaches were employed to estimate the overall size of the electronic chemicals and materials market. After that, market breakdown and data triangulation procedures were used to determine the size of different segments and sub-segments of the market.
Secondary Research
In the secondary research process, various secondary sources such as Hoovers, Factiva, Bloomberg BusinessWeek, and Dun & Bradstreet were referred to, to identify and collect information for this study on the electronic chemicals and materials market. These secondary sources included annual reports, press releases & investor presentations of companies; white papers; certified publications; articles by recognized authors; regulatory bodies, trade directories, and databases.
Primary Research
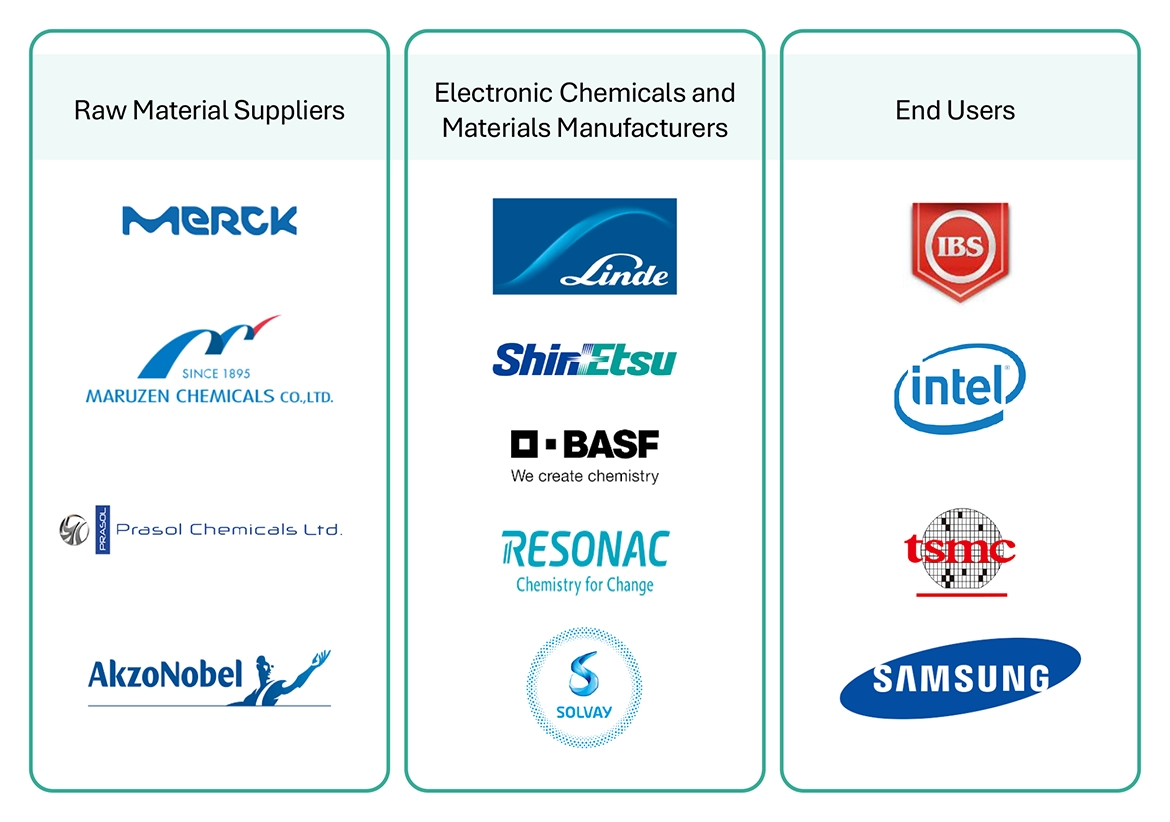
The electronic chemicals and materials market comprises several stakeholders in the supply chain, which include raw material suppliers, processors, end-product manufacturers, buyers, and regulatory organizations. Various primary sources from the supply and demand sides of the markets have been interviewed to obtain qualitative and quantitative information. The primary participants from the demand side include key opinion leaders, executives, vice presidents, and CEOs of companies in the electronic chemicals and materials market. Primary sources from the supply side include associations and institutions involved in the electronic chemicals and materials industry, key opinion leaders, and processing players.
Following is the breakdown of primary respondents

Notes: Other designations include product, sales, and marketing managers.
Tiers of the companies are classified based on their annual revenues as of 2022: Tier 1 = >USD 5 Billion, Tier 2 = USD 1 Billion to USD 5 Billion, and Tier 3= <USD 1 Billion.
To know about the assumptions considered for the study, download the pdf brochure
Market Size Estimation
Both the top-down and bottom-up approaches were used to estimate and validate the size of the global electronic chemicals and materials market. These approaches were also used extensively to estimate the size of various segments of the market. The research methodology used to estimate the market size included the following details:
-
The key players in the industry were identified through extensive secondary research.
-
The supply chain of the industry and market size, in terms of value, were determined through primary and secondary research.
-
All percentage share splits and breakdowns were determined using secondary sources and verified through primary sources.
-
All possible parameters that affect the markets covered in this research study were accounted for, viewed in extensive detail, verified through primary research, and analyzed to obtain the final quantitative and qualitative data.
-
The research includes the study of reports, reviews, and newsletters of key industry players, along with extensive interviews with key officials, such as directors and marketing executives.

To know about the assumptions considered for the study, Request for Free Sample Report

Data Triangulation
After arriving at the overall market size from the estimation process explained above, the total market was split into several segments and sub-segments. The data triangulation and market breakdown procedures were employed, wherever applicable, to complete the overall market engineering process and arrive at the exact statistics for all the segments and sub-segments of the electronic chemicals and materials market. The data was triangulated by studying various factors and trends from both the demand- and supply-side.
In addition, the market size was validated by using both the top-down and bottom-up approaches. Then, it was verified through primary interviews. Hence, for every data segment, there are three sources—top-down approach, bottom-up approach, and expert interviews. The data were assumed to be correct when the values arrived at from the three sources matched.
Market Definition
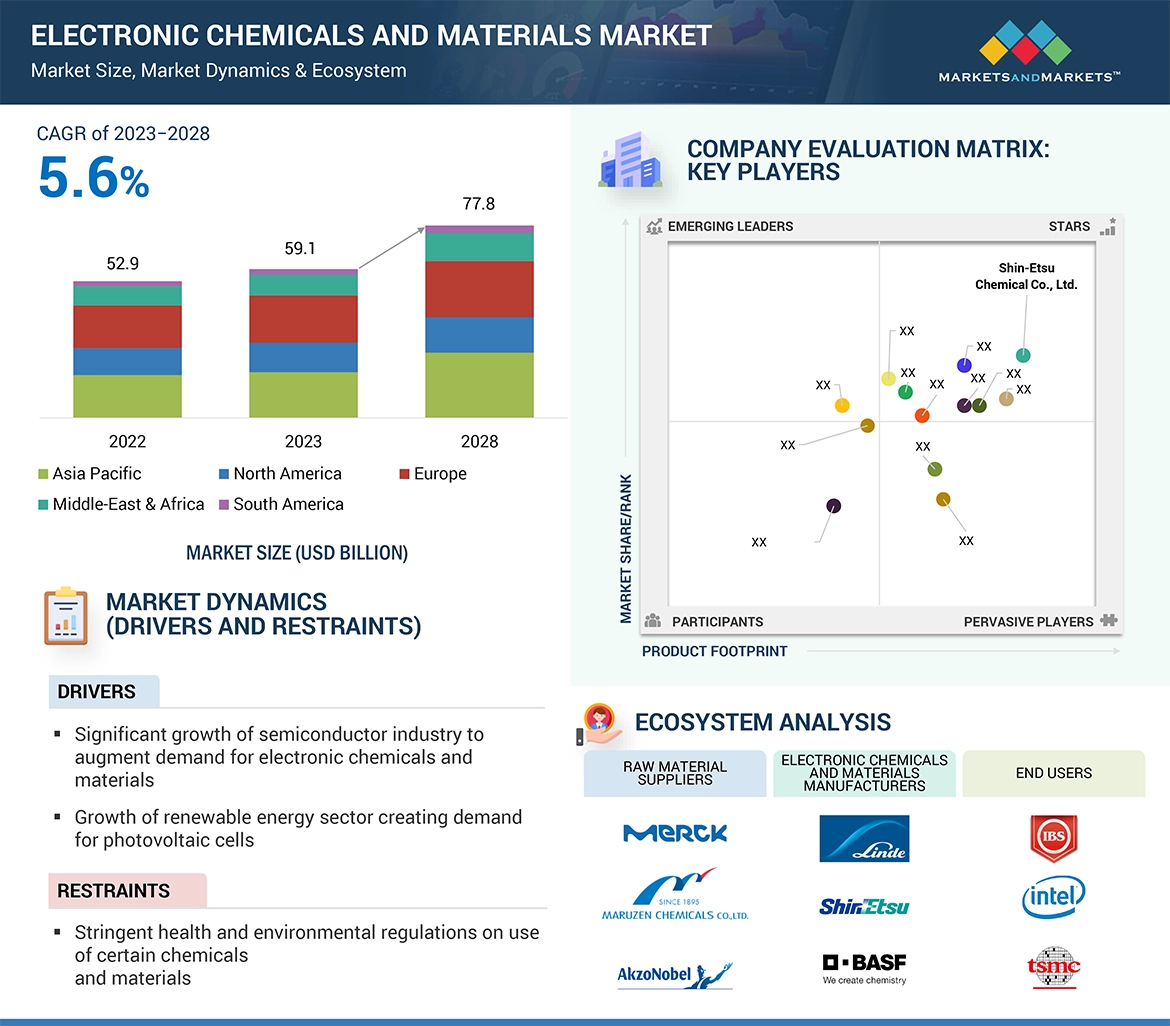
The electronic chemicals and materials market refers to the industry involved in the production, distribution, and sale of chemicals and materials specifically designed for use in the manufacturing of electronic components and devices. These chemicals and materials play crucial roles in various stages of electronics production, including semiconductor fabrication, printed circuit board (PCB) assembly, and display manufacturing. Key segments within this market typically include materials such as Specialty Gases, CMP Slurries, Conductive Polymers, Photoresist Chemicals, Low K Dielectrics, Wet Chemicals, Silicon Wafers, and PCB Laminates. The market encompasses a wide range of products tailored to meet the specific needs of electronic manufacturers, ensuring the performance, reliability, and longevity of electronic devices. As technology advances and electronic devices become more sophisticated, the demand for advanced electronic chemicals and materials continues to grow, driving innovation and expansion within the industry.
Key Stakeholders
-
Electronics chemicals and materials manufacturers
-
Electronics chemicals and materials traders, distributors, and suppliers
-
End-use industry participants of different segments of electronics chemicals and materials
-
Government and research organizations
-
Associations and industrial bodies
-
Research and consulting firms
-
R&D institutions
-
Environment support agencies
-
Investment banks and private equity firms
Report Objectives
-
To define, analyze, and project the size of the electronic chemicals and materials market in terms of value based on type, application, and region.
-
To project the size of the market and its segments with respect to the five main regions, namely, North America, Europe, Asia Pacific, Middle East & Africa, and South America
-
To provide detailed information about the key factors, such as drivers, restraints, opportunities, and challenges, influencing the growth of the market
-
To analyze the opportunities in the market for stakeholders and provide a detailed competitive landscape of the market leaders.
-
To analyze the competitive developments, such as new product launches, expansions, and acquisitions, in the electronic chemicals and materials market
-
To strategically profile the key players operating in the market and comprehensively analyze their market shares and core competencies.
Available Customizations
Along with the given market data, MarketsandMarkets offers customizations as per the specific needs of the companies. The following customization options are available for the report:
Product Analysis:
-
Product Matrix which gives a detailed comparison of the product portfolio of each company
Regional Analysis:
-
Further breakdown of the Rest of APAC market
-
Further breakdown of Rest of Europe market
Company Information:
-
Detailed analysis and profiling of additional market players (up to 5)


Growth opportunities and latent adjacency in Electronic Chemicals and Materials Market