
Flame Retardants for Engineering Resins Market

Flame Retardants for Engineering Resins Market by Type (Brominated, Phosphorous), Application (Polyamide, ABS, PET & PBT, PC/ABS Blends), End-use Industries (Electrical & Electronics, Automotive & Transportation), and Region - Global Forecast to 2030


OVERVIEW
Source: Secondary Research, Interviews with Experts, MarketsandMarkets Analysis
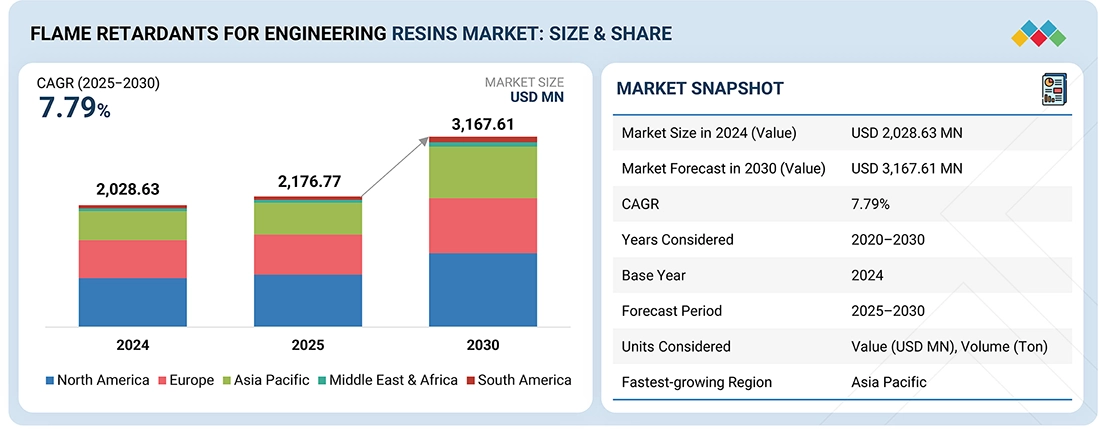
The flame retardants for engineering resins market is projected to reach USD 3,167.61 million by 2030 from the estimated USD 2,176.77 million in 2025, at a CAGR of 7.79%. The growth of the flame retardants for engineering resins market is driven by the increasing fire and safety standards in the construction, electrical, and automotive sectors. The demand is also driven by the growing use of lightweight engineering plastics in electronics and electric cars. The developments of eco-friendly and halogen-free flame retardant technologies are further propelling the market expansion.
KEY TAKEAWAYS
-
BY TYPEThe phosphorous flame retardants segment accounted for the second-largest share of the overall flame retardants for engineering resins market in 2024. These flame retardants are effective in reducing flammability and meeting safety standards. They are perceived as more environmentally friendly compared to other types like brominated flame retardants, aligning with growing sustainability concerns. Moreover, their versatility allows them to be used in various engineering resin formulations without compromising performance, contributing to their significant market share.
-
BY APPLICATIONThe polycarbonate segment is estimated to the second-largest application in the flame retardants for engineering resins market in 2024. Polycarbonate is widely favored for its exceptional mechanical properties, including high impact strength and optical clarity, making it a preferred choice for various applications such as automotive parts, electronic housings, and construction materials. Stringent safety regulations and standards across industries necessitate the use of flame retardant additives in polycarbonate formulations to ensure compliance and mitigate fire risks. Additionally, the versatility of polycarbonate allows for the incorporation of flame retardant agents without compromising its desirable properties, further bolstering its position as a key application in the market.
-
BY END-USE INDUSTRIESThe electrical & electronics segment is the largest end-use industry for flame retardants for engineering resins. The increasing demand for electronic devices across various sectors is driving the demand for flame retardant materials to ensure safety and regulatory compliance. Advancements in technology and the proliferation of electronic components in everyday products further boosted the demand for engineering resins with enhanced fire resistance properties. Additionally, stringent safety standards and regulations in the electrical & electronics industry mandated the incorporation of flame retardant additives in engineering resin formulations, solidifying their dominant position in the market segment.
-
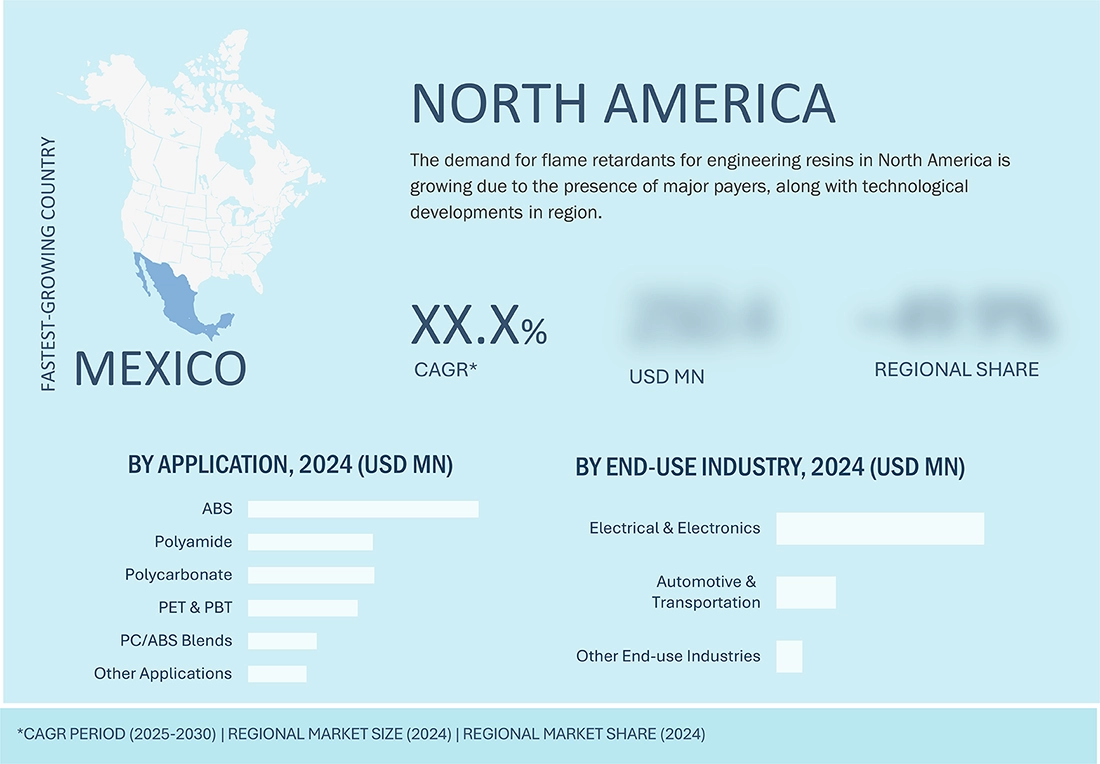
BY REGIONNorth America is poised to lead the flame retardants for engineering resins market during the forecast period, primarily owing to its robust industrial landscape. Key sectors like automotive & transportation, electrical & electronics, and others, which are major users of flame retardant for engineering resins, drive demand across the region. The region's strong manufacturing infrastructure and technological advancements facilitated the production of top-tier flame retardant engineering resins. The presence of major industry players and well-established distribution networks reinforced North America's leadership in the flame retardants for engineering resins market. The region houses major companies for flame retardants for engineering resins, such as Albemarle Corporation (US) and Huber Engineered Materials (US).
-
COMPETITIVE LANDSCAPEMajor market players have adopted both organic and inorganic strategies, including partnerships and investments. For instance, Clariant AG inaugurated its new state-of-the-art production facility for halogen-free flame retardants in Daya Bay, Huizhou. The USD 66.82 million investment in the plant’s first production line will provide local customers with access to innovative and sustainable Exolit OP flame retardants and related technical expertise to support the significant growth of engineering plastics applications in E-mobility and electrical and electronic segments.
The flame retardants for engineering resins market is projected to increase from USD 2.2 billion in 2025 to USD 3.2 billion by 2030, at a CAGR of 7.79%. Flame retardants are used in engineering resins to enhance the fire resistance of materials used in various industries. Engineering resins, such as ABS, polycarbonate, and polyamide, are commonly employed in applications where fire safety is paramount, such as automotive components, electrical enclosures, and construction materials. They are widely used in automotive & transportation, electrical & electronics, and other industries.
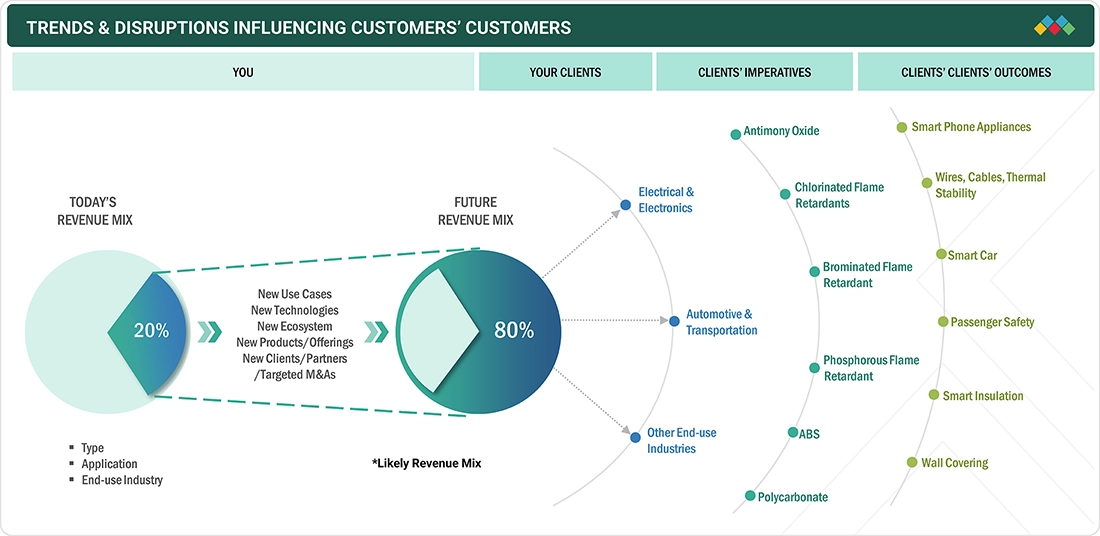
TRENDS & DISRUPTIONS IMPACTING CUSTOMERS' CUSTOMERS
The megatrends includes a significant trend toward sustainable and halogen-free flame retardants, fueled by stringent safety and environmental standards. The need for high-performance, heat-resistant materials is being driven by the development of 5G electronics, electric vehicles, and renewable energy infrastructure. Lightweighting, recyclability, and circular economy principles are also becoming more important. The market's future is also shaped by technological developments that make it possible to create formulations based on nitrogen and phosphorus that are more effective and less harmful.
Source: Secondary Research, Interviews with Experts, MarketsandMarkets Analysis
MARKET DYNAMICS
Level
-
High rate of fire incidents worldwide

-
Implementation of stringent fire safety standards and regulations

Level
-
High loading levels of mineral-based flame retardants

-
Use of harmful chemicals in flame retardants

Level
-
Introduction of synergist compounds with high efficacy

-
Rising demand for consumer electronics

Level
-
Emphasis on environmental protection

-
Health risks associated with flame retardant chemicals

Source: Secondary Research, Interviews with Experts, MarketsandMarkets Analysis
Driver: High rate of fire incidents worldwide
The market for flame retardants for engineering resins is expanding due in large part to the high number of fire incidents that occur globally. The risk of fire hazards has increased dramatically due to growing urbanization, industrialization, and the widespread use of plastics in consumer goods, automobiles, and electronic devices. In order to prevent catastrophic losses, engineering resins—which are frequently used in electrical housings, connectors, and interior automotive parts—must now adhere to strict fire safety regulations. Industry integration of flame-retardant additives, which improve material resistance to ignition and flame spread, has been driven by growing concerns about property damage, life safety, and business continuity. Stricter fire safety regulations are also being implemented by governments and regulatory agencies worldwide, especially in the electronics, transportation, and construction industries. As a result, manufacturers are increasingly adopting halogen-free, phosphorus- and nitrogen-based flame retardants to ensure compliance, improve safety, and support the development of high-performance, sustainable engineering materials.
Restraint: High loading levels of mineral-based flame retardants
The market for flame retardants for engineering resins is significantly constrained by the high loading level of mineral-based flame retardants. To achieve effective flame retardancy, mineral-based additives like magnesium hydroxide (MDH) and aluminum hydroxide (ATH) need high dosage levels, frequently more than 50% by weight. Reduced tensile strength, poor surface finish, and increased material density are just a few of the detrimental effects of this excessive loading on engineering resins' mechanical, thermal, and processing characteristics. Because of this, manufacturers find it difficult to strike a balance between performance requirements and flame resistance, particularly in high-end applications like electronics, aerospace, and automobiles. Additionally, the high filler content raises the energy and processing costs of molding and compounding. To overcome these drawbacks, the industry is gradually shifting toward phosphorus-, nitrogen-, and synergistic-based systems, which provide efficient flame retardancy at lower loadings, helping maintain material integrity while meeting stringent fire safety standards.
Opportunity: Introduction of synergist compounds with high efficacy
The introduction of synergist compounds with high efficacy offers a substantial opportunity in the flame retardants for engineering resins market. Additives known as synergists increase the efficacy of primary flame retardants while lowering the total additive loading. Manufacturers can now achieve better mechanical performance, thermal stability, and flame retardancy without sacrificing the physical characteristics of the resin thanks to this innovation. Antimony trioxide, zinc borate, and nanoclays are examples of compounds that work in concert to improve charring, lower smoke emissions, and increase the dispersion of flame retardant ingredients. The creation of synergistic systems based on metal hydroxide or phosphorus–nitrogen is especially gaining popularity because it is halogen-free and environmentally benign. These sophisticated formulations support sustainability objectives while facilitating adherence to strict fire safety regulations.
Challenge: Emphasis on environmental protection
The increased focus on environmental protection is a major challenge in the flame retardants for engineering resins market. Because of their possible toxicity, persistence, and environmental bioaccumulation, traditional flame retardants, especially halogenated compounds, are being subject to more and more restrictions. When these materials are burned or disposed of, they may release toxic gases that endanger ecosystems and human health. Global laws like REACH and RoHS are, therefore, forcing producers to switch to environmentally friendly, halogen-free substitutes like systems based on phosphorus, nitrogen, and inorganic materials. It is still difficult to create these environmentally friendly alternatives that are as effective and affordable as traditional flame retardants. Significant R&D, testing, and certification expenditures are necessary for the research and reformulation process, which may raise production costs and delay the commercialization of the product. Therefore, balancing fire safety performance, environmental compliance, and economic feasibility continues to be a complex issue for producers in the flame retardants for engineering resins market.
Flame Retardant Market for Engineering Resins Market: COMMERCIAL USE CASES ACROSS INDUSTRIES
| COMPANY | USE CASE DESCRIPTION | BENEFITS |
|---|---|---|
 |
Flame-retardant engineering plastics in automotive components such as dashboards, connectors, under-the-hood parts, and electrical enclosures using PA or PBT resins | Enhances vehicle safety, prevents ignition in case of electrical faults or high engine heat, ensures compliance with fire safety standards |
 |
High-performance thermoplastic components in vehicles like fuse boxes, seatbelt parts, HVAC components, and electronic modules using PA66 or PC/ABS blends with flame retardants | Improves passenger safety, reduces fire risk, meets FMVSS 302 and UL 94 requirements, extends component durability |
 |
Flame-retardant resins in industrial and electrical equipment such as switchgear housings, circuit breaker parts, and industrial pump enclosures using epoxy or polyester resins with FR additives | Minimizes fire hazards, ensures safety in high-voltage and high-temperature environments, increases equipment reliability |
 |
Advanced flame-retardant polymers in aerospace and electronics for aircraft interior panels, sensor housings, electrical connectors, and insulation materials using PA, PEEK, or PPS resins | Meets strict fire safety standards (e.g., FAR 25.853), enhances safety in aerospace and industrial applications, ensures long-term material performance |
 |
Flame-retardant engineering plastics in electrical equipment such as motor housings, circuit breaker casings, relay components, and busbar insulations using PA, PC, or PPO resins | Ensures electrical safety, prevents short-circuit fires, complies with IEC and UL standards, enhances operational reliability |
Logos and trademarks shown above are the property of their respective owners. Their use here is for informational and illustrative purposes only.
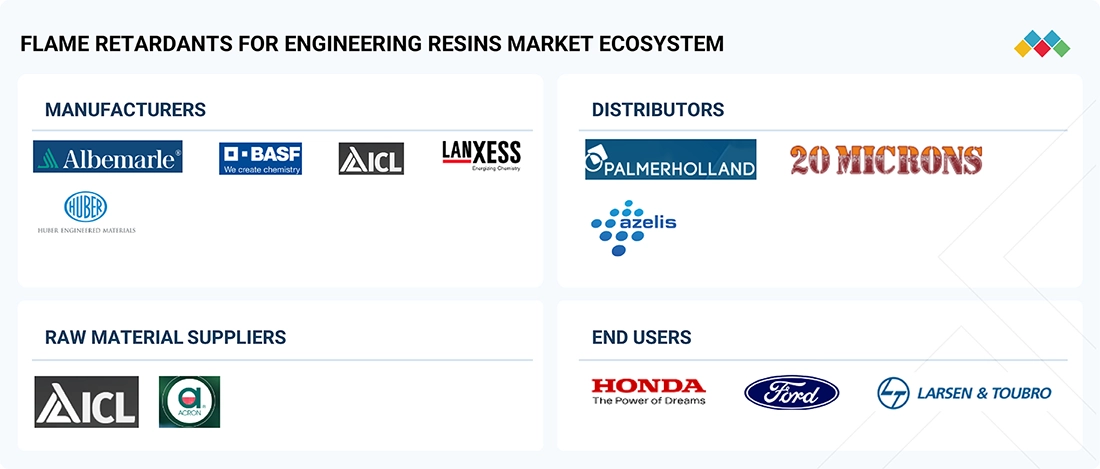
MARKET ECOSYSTEM
The flame retardants for engineering resins ecosystem includes companies manufacturing various types of flame retardants, such as brominated flame retardants, phosphorous flame retardants, and other types. These are produced by companies such as Clariant AG (Switzerland), LANXESS AG (Germany), Albemarle Corporation (US), BASF SE (Germany), Israel Chemicals Ltd. (Israel), Nabaltec AG (Germany), Huber Engineered Materials (US), Italmatch Chemicals S.p.A (Italy), RTP Company (US), and Chemische Fabrik Budenheim KG (Germany).
Logos and trademarks shown above are the property of their respective owners. Their use here is for informational and illustrative purposes only.
MARKET SEGMENTS
Source: Secondary Research, Interviews with Experts, MarketsandMarkets Analysis
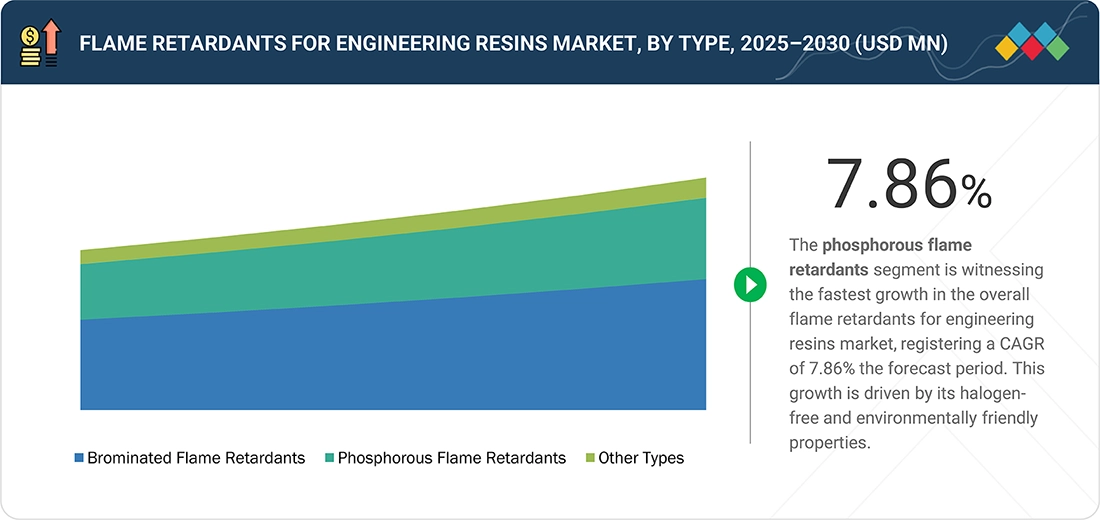
Flame Retardants For Engineering Resins Market, By Type
Brominated flame retardants (BFRs) have dominated the overall flame retardants for engineering resins market due to their wide range of applications, accessibility, and high degree of adaptability. These materials' remarkable effectiveness in lowering flammability, reliable performance, and affordability make them ideal for improving fire safety in a variety of applications. Their well-established use and compatibility with a variety of engineering resins further boost adoption. They also provide a tried-and-true way to satisfy strict flammability requirements. The steady demand from the automotive and electrical & electronics industries has supported the market dominance of brominated flame retardants.
Flame Retardants for Engineering Resins Market, By Application
Acrylonitrile butadiene styrene (ABS) holds the largest market share, primarily due to its widespread and crucial use in the electrical & electronics sector. ABS is a common and economical thermoplastic polymer known for its excellent impact strength, stiffness, and easy processability, making it ideal for electronics housings, computer casings, and consumer appliance components where strict fire safety standards (like UL 94) are mandatory. Its dominance is driven by the massive and consistently growing global electronics manufacturing industry. Polycarbonate, polyamide, PET & PBT, and PC/ABS blends are the other resins catering to specialized fire safety needs in automotive components, electrical connectors, and various other industrial and consumer applications.
Flame Retardants for Engineering Resins Market, By End-use Industry
The electrical & electronics end-use industry dominates the overall flame retardants for engineering resins market. The strict and required fire safety standards (like UL 94) that apply to a wide range of products, such as circuit boards, connectors, electrical enclosures, and consumer electronic casings, are driving the demand in this end-use industry. Flame-retardant engineering resins, such as ABS and polycarbonate, are commonly used in these applications to stop fires from spreading in current-carrying devices. The automotive & transportation segment is the second-largest end-use industry. The market in the automotive & transportation segment is driven by strict fire safety regulations, particularly for under-the-hood and interior components, and the rising need for flame-retardant materials in electric vehicle (EV) battery packs.
REGION
North America to be largest region in global flame retardant for engineering resins market during forecast period
North America dominated the flame retardants for engineering resins market in 2024 due to the strong presence of the automotive, aerospace, electrical, and electronics industries that demand high-performance, fire-safe materials. Stringent fire safety standards set by organizations like UL, NFPA, and EPA have accelerated the adoption of advanced flame-retardant resins. Additionally, the region’s focus on sustainable and halogen-free solutions, combined with significant R&D investments and technological advancements by key players, supports market expansion. The increasing use of engineering plastics in electric vehicles and smart devices further strengthens North America’s leading market position.
Flame Retardant Market for Engineering Resins Market: COMPANY EVALUATION MATRIX
In the flame retardants for engineering resins market, Albemarle Corporation (Star) leads with a strong market share and extensive product footprint, which enables it to serve the most regions in the world. Arkema S.A. (Emerging Leader) is gaining visibility with its solutions in flame retardants for engineering resins market, maintaining its position through innovation and niche product offerings. While Albemarle Corporation dominates through scale and a diverse portfolio, Arkema S.A. shows significant potential to move toward the leaders’ quadrant as demand for flame retardant for engineering resins is rising continuously.

Source: Secondary Research, Interviews with Experts, MarketsandMarkets Analysis
KEY MARKET PLAYERS
MARKET SCOPE
| REPORT METRIC | DETAILS |
|---|---|
| Market Size in 2024 (Value) | USD 2028.63 Million |
| Market Forecast in 2030 (Value) | USD 3,167.61 Million |
| Growth Rate | CAGR of 7.79% from 2025 to 2030 |
| Years Considered | 2020-2030 |
| Base Year | 2024 |
| Forecast Period | 2025-2030 |
| Units Considered | Value (USD Million), Volume (Ton) |
| Report Coverage | Revenue forecast, company ranking, competitive landscape, growth factors, and trends |
| Segments Covered |
|
| Regions Covered | North America, Asia Pacific, Europe, Middle East & Africa, and South America |
WHAT IS IN IT FOR YOU: Flame Retardant Market for Engineering Resins Market REPORT CONTENT GUIDE
DELIVERED CUSTOMIZATIONS
We have successfully delivered the following deep-dive customizations:
| CLIENT REQUEST | CUSTOMIZATION DELIVERED | VALUE ADDS |
|---|---|---|
| Asia Pacific-based Flame Retardants For Engineering Resins Manufacturer |
|
|
| Europe-based Flame Retardants For Engineering Resins Manufacturer |
|
|
RECENT DEVELOPMENTS
- October 2023 : Clariant AG inaugurated its new state-of-the-art production facility for halogen-free flame retardants in Daya Bay, Huizhou. The USD 66.82 million investment in the plant’s first production line will provide local customers with access to innovative and sustainable Exolit OP flame retardants and related technical expertise to support the significant growth of engineering plastics applications in E-mobility and electrical & electronic segments.
- July 2022 : BASF SE and THOR GmbH announced the collaboration of their expertise in non-halogenated flame-retardant additives to provide customers with a comprehensive solution that will enhance the sustainability and performance of specific plastic compounds and meet stringent fire safety requirements. The experts at THOR GmbH and BASF SE have collaborated for many years in developing sophisticated solutions to meet the demanding flame-retardant specifications, focusing on alternatives to halogen-containing additives.
- April 2022 : BASF SE is expanding its portfolio of color-stable tailor-made engineering plastics for use in electric cars. The new PA66 type is flame-retardant and shines bright orange. It meets all the color stability and heat aging resistance criteria.
Table of Contents
 Exclusive indicates content/data unique to MarketsandMarkets and not available with any competitors.
Methodology
The study involved four major activities in estimating the size of the flame retardants for engineering resins market. Intensive secondary research was done to gather information on the market, the peer market, and the parent market. The next step was to validate these findings, assumptions, and sizing with industry experts across the value chain through primary research. Both top-down and bottom-up approaches were employed to estimate the complete market size. Post that, the market breakdown and data triangulation procedures were used to estimate the market size of the segments and subsegments.
Secondary Research
Secondary sources used in this study included annual reports, press releases, and investor presentations of companies; white papers; certified publications; articles from recognized authors; and gold standard & silver standard websites such as Factiva, ICIS, Bloomberg, and others. The findings of this study were verified through primary research by conducting extensive interviews with key officials such as CEOs, VPs, directors, and other executives. The breakdown of profiles of the primary interviewees is illustrated in the figure below:
Primary Research
The flame retardants for engineering resins market comprises several stakeholders, such as raw material suppliers, end-product manufacturers, and regulatory organizations in the supply chain. The demand side of this market is characterized by key opinion leaders in various applications for flame retardants for engineering resins. The supply side is characterized by advancements in technology and diverse application industries. Various primary sources from both the supply and demand sides of the market were interviewed to obtain qualitative and quantitative information.
Breakdown of Primary Participants

Notes: Tier 1, Tier 2, and Tier 3 companies are classified based on their market revenue in 2024 available in the public domain, product portfolios, and geographical presence.
Other designations include consultants and sales, marketing, and procurement managers.
To know about the assumptions considered for the study, download the pdf brochure
| COMPANY NAME | DESIGNATION | |
|---|---|---|
| Albemarle Corporation | Global Strategy & Innovation Manager | |
| LANXESS AG | Technical Sales Manager | |
| BASF SE | Senior Supervisor | |
| Israel Chemicals Ltd. | Production Supervisor | |
| Huber Engineered Materials | Production Manager | |
Market Size Estimation
Both top-down and bottom-up approaches were used to estimate and validate the total size of the flame retardants for engineering resins market. These methods were also used extensively to estimate the size of various subsegments in the market. The research methodology used to estimate the market size includes the following:
- The key players in the industry have been identified through extensive secondary research.
- The supply chain of the industry has been determined through primary and secondary research.
- All percentage shares, splits, and breakdowns have been determined using secondary sources and verified through primary sources.
- All possible parameters that affect the markets covered in this research study have been accounted for, viewed in extensive detail, verified through primary research, and analyzed to obtain the final quantitative and qualitative data.
Flame Retardants for Engineering Resins Market: Bottom-Up and Top-Down Approach

Data Triangulation
After arriving at the overall market size—using the market size estimation processes as explained above—the market was split into several segments and subsegments. To realize the overall market engineering process and arrive at the exact statistics of each market segment and subsegment, the data triangulation and market breakdown procedures were employed, wherever applicable. The data was triangulated by studying several factors and trends from both the demand and supply sides of the flame retardants for engineering resins market.
Market Definition
According to the National Institute of Environmental Health Sciences of the US, “Flame retardants are applied to engineering resins to prevent the start or slow the growth of the fire. They have been used in many consumer goods and industrial products to decrease the ability of resins to ignite.” Flame retardants are key components used in reducing the devastating effects of fire mishaps on people, property, and the environment. The most common elements used as flame retardants are bromine and phosphorous. The compounds of these elements are added to treat potentially flammable materials. Flame retardants stop the fire by interacting with the fire cycle in the gaseous phase to stop the chemical chain reaction. Flame retardants act in two ways: they either prevent the fire from starting or slow it down significantly. They are added to engineering resins to enhance fire-resistant properties, without altering the properties of the parent material.
Stakeholders
- Manufacturers of flame retardants for engineering resins
- Raw material manufacturers
- Government planning commissions and research organizations
- Industry associations
- End-use industries
- R&D institutions
Report Objectives
- To analyze and forecast the size of the flame retardants for engineering resins market in terms of value and volume
- To provide detailed information regarding the key factors, such as drivers, restraints, challenges, and opportunities, influencing the growth of the market
- To define, describe, and segment the flame retardants for engineering resins market based on type, application, and end-use industry
- To forecast the size of the market segments for regions such as Asia Pacific, North America, Europe, South America, and the Middle East & Africa
- To strategically analyze the market segments with respect to individual growth trends, prospects, and contribution to the overall market
- To identify and analyze opportunities for stakeholders in the market
- To strategically profile key players and comprehensively analyze their core competencies
Key Questions Addressed by the Report
What is the flame retardant market for engineering resins?
It is the market for additives used to reduce flammability in engineering plastics such as ABS, PC, PET/PBT and polyamides for safety-critical applications.
Why is this flame retardant market for engineering resins growing?
Growth is driven by stricter fire safety regulations and rising use of electronics, EVs and advanced components that require flame-retardant resins.
Which types of flame retardants are most common in engineering resins?
Brominated and phosphorus-based systems currently dominate due to their effectiveness, cost balance and compatibility with multiple resin systems.
How are sustainability trends affecting the flame retardant market for engineering resins?
There is a clear shift toward halogen-free, more environmentally benign chemistries and recyclable flame-retardant resin formulations.
Where are flame-retardant engineering resins mainly used?
Key end-use sectors are electrical and electronics, followed by automotive and transportation components that must meet stringent flammability standards.
Need a Tailored Report?
Customize this report to your needs
Get 10% FREE Customization
Customize This ReportPersonalize This Research
- Triangulate with your Own Data
- Get Data as per your Format and Definition
- Gain a Deeper Dive on a Specific Application, Geography, Customer or Competitor
- Any level of Personalization
Let Us Help You
- What are the Known and Unknown Adjacencies Impacting the Flame Retardants for Engineering Resins Market
- What will your New Revenue Sources be?
- Who will be your Top Customer; what will make them switch?
- Defend your Market Share or Win Competitors
- Get a Scorecard for Target Partners

Custom Market Research Services
We Will Customise The Research For You, In Case The Report Listed Above Does Not Meet With Your Requirements
Get 10% Free CustomisationTESTIMONIALS

We at Nissan Chemicals Corporation have been clients of MarketsandMarkets for more than a year now. We recently consulted MarketsandMarkets for a study, the team at MarketsandMarkets was extremely professional and organized. The business insights were very detailed and aligned well with our expectations that really helped us formulate the Business Plans and device new strategies for development themes. MarketsandMarkets offers a unique combination of expertise and dedicated engagement model. Their research findings have helped us in designing our Pricing Strategy which will make it easier for us to predict the future sales and profits for the next ten years. We look forward to working with MarketsandMarkets in the future.
VP of Strategy & New Business Development
Leading Specialty Chemical Company
The MarketsandMarkets Engagement Model, composed of both the Knowledge Store and advisory custom research, has greatly helped us in understanding our markets and making strategic decisions. The Knowledge Store is a fast way to allow everyone in our organization to understand more about most any market they are interested in. The ability to then get custom research done and get answers to specific strategic questions and market insight has been spectacular. The Markets and Markets team feel more like colleagues than vendors and their services have helped us change our culture where statements of things like growth opportunities and competitive position are always backed by industry research.

Rich Gibson,
Director, Corporate Strategy
Milliken & Company,
Leading Industrial Manufacturer of specialty chemical, floor covering, performance and protective textile materials, and healthcaremilliken.com
MarketsandMarkets is a trusted resource that helps us to better understand markets that are near-adjacencies-whether its technology, value chain or geography. Their Knowledge Store platform provides a dashboard of markets and their characteristics which is easy to use and saves us time.
Adam Shaw,
Market Development and Strategy Manager
AdvanSix Inc. USA,
An American Leader in Chemicalswww.advansix.com
The Knowledge Store from MarketsandMarkets is a valuable tool which has helped my team acquire greater insight in to the end markets that our business serves. This has enabled us to help our company build stronger strategies throughout our planning process.
TOSHIO KINOSHITA
Senior Chif Consultion Research & Consulting Division
Mitsubishi Chemical Research Corporation,
Leading Manufacturer of Chemical Productswww.mitsubishichem-res.co.jp/en/

We recently engaged with MarketsandMarkets for a study, the team not only clearly understood our business objectives but was also extremely professional in the way they handled the entire project. The study was efficiently conducted in a phase-wise manner, and the engagement model furnished us with high-quality business insights that far exceeded our expectations at each phase. We were especially happy that MarketsandMarkets could provide us with both, an English as well as a Japanese version of the study. A special thanks to the Analyst Team and Client Services Team, whose fluency in Japanese enhanced our comfort level, as we could converse with them in our preferred language.
Independent entrepreneurs
Arrow Precision
We approached MarketsandMarkets for study on Proppants Market, and their work exceeded our expectations. The study conducted was comprehensive and enabled us to view the market through the various dimensions. In addition, the team was extraordinarily responsive throughout the process and resolved our queries on time. I strongly recommend MarketsandMarkets and will certainly consider them for additional market assessments we will need in the future.
Global engineering company, Japan
Deputy Manager,
Strategic Planning OfficeThe high-quality insights shared by the MarketsandMarkets team helped us understand the pharmaceutical plant designers in a specific geography. It also captured the risks that we may likely face in communicating with our potential partners. The study would enable us identify partners, which would impact our future growth.


Growth opportunities and latent adjacency in Flame Retardants for Engineering Resins Market