
Europe AI in Oncology Market (2024-2029)

The Europe AI in Oncology Market was valued at $691.1 Million in 2024 and projected to reach to $3302.2 Million by 2029, representing a compound annual growth rate of 29.8%. Europe's AI in Oncology market is poised for exceptional growth, driven by increasing healthcare digitalization, rising cancer incidence, and substantial investment in precision medicine infrastructure.


| Market Size in | USD 26.32 MN |
| Market Forecast in | |
| CAGR | |
| Forecast Period | |
| Units Considered | Value (USD MN) |
Europe AI in Oncology Market Trends and Insights
- This growth trajectory reflects Europe's strong commitment to digital health innovation and precision medicine adoption across oncology centers.
- Europe is leveraging advanced AI algorithms for diagnostic imaging, treatment planning, and patient outcome prediction, supported by robust regulatory frameworks and healthcare infrastructure investments. The European market benefits from high healthcare spending, established cancer research networks, and collaborative initiatives across member states.
- Europe's emphasis on data privacy through GDPR compliance has shaped AI development in oncology, ensuring patient safety while enabling innovation.
- By 2029, Europe is expected to consolidate its position as a leading region for AI-driven oncology solutions, driven by increasing cancer prevalence, physician adoption of AI tools, and integration with existing electronic health record systems across European healthcare systems..
Key Market Statistics
- CAGR (2024-2029) 29.8% CAGR
- Market Size, 2024 ~USD 691.1 Million
- Forecast, 2029 ~USD 3302.2 Million
- Geography Europe
Europe AI in Oncology Market Overview
Market Valuation & Growth :
Europe's AI in Oncology market is valued at $691.1 million in 2024, with a robust CAGR of 29.8% projected through 2029, reaching $3,302.2 million. This growth significantly outpaces global expansion, positioning Europe as a key innovation hub.
Diagnostic Imaging Leadership :
European oncology centers are rapidly adopting AI-powered diagnostic imaging solutions for early cancer detection and precision analysis. Advanced algorithms are enhancing radiologist capabilities and reducing diagnostic turnaround times across major healthcare systems.
Precision Medicine Integration :
Europe's strong commitment to digital health and personalized treatment planning is driving AI adoption in oncology. Healthcare providers are leveraging machine learning for treatment optimization and patient outcome prediction across diverse cancer types.
Regulatory & Clinical Excellence :
Europe's stringent regulatory framework and emphasis on clinical validation are fostering trust in AI oncology solutions. GDPR compliance and data privacy standards are establishing Europe as a benchmark for responsible AI implementation in healthcare.
Europe AI in Oncology Market Dynamics
- Leading European nations are establishing AI research centers and fostering public-private partnerships to accelerate innovation in cancer diagnostics and treatment planning. The market expansion is supported by favorable reimbursement policies, growing clinical evidence, and healthcare provider demand for AI-enabled efficiency.
- European oncology institutions are prioritizing AI integration to improve patient outcomes, reduce treatment costs, and enhance operational efficiency.
- This trajectory positions Europe as a global leader in AI-driven oncology solutions through 2029..
Market Ecosystem
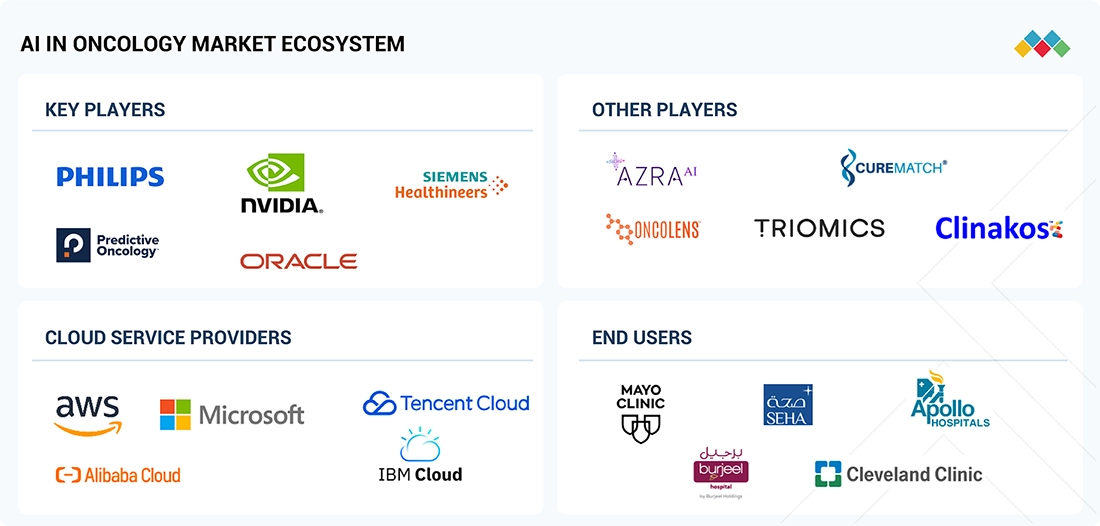
AI IN ONCOLOGY MARKET: GROWTH, SIZE, SHARE, AND TRENDS: COMMERCIAL USE CASES ACROSS INDUSTRIES
| COMPANY | USE CASE DESCRIPTION | BENEFITS |
|---|---|---|
 |
AI models for oncology imaging that support tumor detection, segmentation, radiomics analysis, and multi-modal decision-support using high-performance GPUs | Enhances accuracy in tumor identification, accelerates image interpretation, supports precision oncology, and reduces radiologist workload. |
 |
AI-powered oncology imaging and digital pathology tools integrated into cloud platforms to improve cancer detection, triaging, and clinical workflows. | Improves early cancer detection, streamlines oncology reporting, enhances clinical decision-making, and optimizes hospital workflow efficiency. |
 |
AI-enabled oncology imaging platforms and radiotherapy planning tools that support tumor contouring, treatment simulation, and predictive modelling. | Accelerates treatment planning, improves tumor segmentation accuracy, reduces manual contouring effort, and enhances radiotherapy precision. |
 |
AI-driven digital pathology and biomarker analysis tools for cancer diagnosis, tumor grading, and molecular profiling. | Improves diagnostic consistency, accelerates pathology workflows, supports personalized treatment decisions, and reduces manual review burden. |
 |
AI platform for oncology drug discovery that predicts targets, designs novel molecules, and optimizes candidates using deep learning and generative AI. | Shortens oncology drug development timelines, enhances hit discovery efficiency, reduces R&D cost, and supports next-generation precision therapeutics. |
Logos and trademarks shown above are the property of their respective owners. Their use here is for informational and illustrative purposes only.
Related Ecosystem
Healthcare Analytics
- Machine Learning
- Natural Language Processing (NLP)
- Blood Pressure Monitors
- Computed Tomography (CT)
- Magnetic Resonance Imaging (MRI)
- Oracle Corporation
- PHILIPS HEALTHCARE
- Siemens healthineers
- Zensar Technologies Limited
- EPIC SYSTEMS CORPORATION
Healthcare It
- Computed Tomography (CT)
- Machine Learning
- Magnetic Resonance Imaging (MRI)
- Natural Language Processing (NLP)
- Predictive Analytics
- CERNER CORPORATION
- PHILIPS HEALTHCARE
- Oracle Corporation
- GE HealthCare Technologies Inc.
- Siemens healthineers
Key Takeaways
- Europe's AI in Oncology market is projected to grow from $691.1M (2024) to $3,302.2M (2029) at a 29.8% CAGR.
- Europe leads in regulatory compliance and data privacy standards, shaping responsible AI development in oncology.
- High healthcare expenditure and established cancer research infrastructure accelerate AI adoption across Europe.
- European healthcare systems are integrating AI tools for diagnostic imaging, treatment planning, and personalized medicine by 2029.
AI in Oncology Market Report Scope
| Report Metric | Details |
|---|---|
| Base Year | 2024 |
| Fastest Growing Segment | DEEP LEARNING (Type) |
| Forecast Period | 2024-2029 |
| Growth Rate | CAGR of 29.4% from 2024 to 2029 |
| Largest Segment | SOLID TUMORS (Cancer Type) |
| Market Size Base Year (Billions) | ~USD 2.45 (2024) |
| Revenue Forecast (Billions) | ~USD 8.9 (2029) |
| Segments Covered | Technology, Type, Application, Cancer Type, End User, Player Type, Deployment Model |
Europe AI in Oncology Market Report Segmentation
7 segment dimensions are covered across the global market.
By Technology
- Computer Vision
- Context-Aware Processing & Computing
- Image Analysis
- Machine Learning
- Natural Language Processing
- Natural Language Processing (Nlp)
By Type
- Adaptive Trial Design & Monitoring
- AI-Guided Drug Delivery
- Brain Tumors
- Breast Cancer
- Candidate Selection & Validation
- Chemotherapy
- Clinical Trial Optimization
- Colorectal Cancer
- Combination & Dose Optimization
- Computed Tomography
- Computed Tomography (Ct)
- Deep Learning
- Digital Pathology & Histopathology
- Genetic Risk Prediction
- Hit Identification & Prioritization
- Hit-To-Lead Identification/Lead Generation
- Hospitals & Clinics
- Imaging & Radiology
- Immunotherapy
- Intraoperative Guidance & Robotics
- Intraoperative Guidance And Robotics
- Laboratories & Diagnostic Centers
- Lead Optimization
- Leukemia
- Liquid Biopsy & Biomarker Detection
- Long-Term Prediction
- Lung Cancer
- Lymphoma
- Magnetic Resonance Imaging (Mri)
- Mammography
- Mental Health & Support Systems
- Multiple Myeloma
- Nuclear Imaging
- Other Healthcare Providers
- Other Hematologic Malignancies
- Other Hematological Malignancies
- Other Imaging Modalities
- Other Machine Learning Technologies
- Other Solid Tumors
- Other Tumors
- Others Healthcare Providers
- Patient Education & Empowerment
- Personalized Treatment Planning
- Postoperative Analysis & Recovery
- Precision Medicine & Genomic Analysis
- Preclinical Testing
- Predictive Modeling For Human Trials
- Predictive Modelling For Human Trials
- Predictive Models For Treatment Response
- Preoperative Imaging & 3D Modeling
- Preoperative Imaging And 3D Modeling
- Prostate Cancer
- Radiation Therapy
- Radiomics & Radiogenomics
- Radiomics And Radiogenomics
- Recurrence Monitoring
- Reinforcement Learning
- Remote Patient Monitoring
- Specialty Centers
- Supervised Learning
- Surgical Planning & Assistance
- Symptom Management & Virtual Assistance
- Target Identification & Validation
- Targeted Therapy
- Treatment Recommendation Systems
- Ultrasound
- Unsupervised Learning
- X-Ray Imaging
By Application
- Data Management & Analytics
- Diagnosis & Early Detection
- Drug Development
- Drug Discovery
- Other Applications
- Patient Engagement & Remote Monitoring
- Post Treatment Surveillance & Survivorship Care
- Post-Treatment Surveillance & Survivorship Care
- Treatment Planning & Personalization
By Cancer Type
- Hematologic Malignancies
- Hematological Malignancies
- Other Cancer Types
- Other Cancers
- Others Cancer Types
- Solid Tumors
By End User
- Academic & Research Institutions
- Government & Regulatory Agencies
- Healthcare Payers
- Healthcare Providers
- Medical Device/ Equipment Companies
- Medical Device/Equipment Companies
- Other End Users
- Pharmaceutical & Biotechnology Companies
By Player Type
- Business Process Service Providers
- Integrated Suite/Platform Providers
- Niche/Point Solution Providers
- Technology Providers
By Deployment Model
- Cloud-Based Model
- Hybrid Model
- On-Premises Model
REST OF EUROPE: AI IN ONCOLOGY MARKET, BY END USER, 2022–2030
| Segment | 2022 | 2023 | 2024 | 2025 | 2026 | 2027 | 2028 | 2029 | 2030 | CAGR (%) |
|---|---|---|---|---|---|---|---|---|---|---|
| ACADEMIC & RESEARCH INSTITUTIONS | 8.2 | 10.8 | 13.7 | 17.3 | 22.1 | 28.2 | 36.1 | 46.3 | 59.7 | 27.9 |
| GOVERNMENT & REGULATORY AGENCIES | 3 | 3.9 | 4.8 | 6 | 7.6 | 9.5 | 12.1 | 15.3 | 19.4 | 26.1 |
| HEALTHCARE PAYERS | 2 | 2.6 | 3.3 | 4.1 | 5.2 | 6.7 | 8.5 | 10.9 | 14 | 27.3 |
| HEALTHCARE PROVIDERS | 36.5 | 48.4 | 61.7 | 79 | 101.4 | 130.5 | 168.5 | 218.1 | 283 | 28.9 |
| MEDICAL DEVICE/ EQUIPMENT COMPANIES | 6.9 | 9 | 11.2 | 14.1 | 17.8 | 22.5 | 28.5 | 36.2 | 46.2 | 26.6 |
| OTHER END USERS | 1.7 | 2.2 | 2.8 | 3.5 | 4.4 | 5.5 | 6.9 | 8.6 | 10.8 | 25.3 |
| PHARMACEUTICAL & BIOTECHNOLOGY COMPANIES | 18.9 | 24.9 | 31.7 | 40.4 | 51.6 | 66.2 | 85.1 | 109.7 | 141.8 | 28.4 |
| TOTAL | 77.1 | 101.7 | 129.2 | 164.5 | 210.1 | 269.1 | 345.6 | 445.1 | 574.8 | 28.2 |
EUROPE: AI IN ONCOLOGY MARKET, BY END USER, 2022–2030
| Segment | 2022 | 2023 | 2024 | 2025 | 2026 | 2027 | 2028 | 2029 | 2030 | CAGR (%) |
|---|---|---|---|---|---|---|---|---|---|---|
| ACADEMIC & RESEARCH INSTITUTIONS | 42.5 | 56.5 | 72.3 | 92.8 | 119.5 | 154.4 | 200.1 | 260.1 | 339.2 | 29.4 |
| GOVERNMENT & REGULATORY AGENCIES | 16.8 | 22 | 27.8 | 35.1 | 44.6 | 56.8 | 72.6 | 93.1 | 119.7 | 27.6 |
| HEALTHCARE PAYERS | 10.5 | 13.9 | 17.7 | 22.6 | 29 | 37.3 | 48.1 | 62.3 | 81 | 28.9 |
| HEALTHCARE PROVIDERS | 191.3 | 256.3 | 330.7 | 427.9 | 555.5 | 723.4 | 944.9 | 1238.2 | 1627.8 | 30.4 |
| MEDICAL DEVICE/ EQUIPMENT COMPANIES | 36.9 | 48.5 | 61.5 | 78.2 | 99.7 | 127.5 | 163.6 | 210.5 | 271.8 | 28.1 |
| OTHER END USERS | 8.5 | 11.2 | 14.2 | 18 | 22.9 | 29.1 | 37 | 47.1 | 60 | 27.1 |
| PHARMACEUTICAL & BIOTECHNOLOGY COMPANIES | 97.4 | 130 | 167 | 215.3 | 278.4 | 361.1 | 469.8 | 613.1 | 802.8 | 29.9 |
| TOTAL | 403.9 | 538.3 | 691.1 | 890 | 1149.6 | 1489.6 | 1936.1 | 2524.5 | 3302.2 | 29.8 |
Target Audience
- Healthcare Technology Vendors : AI oncology solution providers need Europe-specific market data to develop localized products, navigate regulatory requirements, and identify high-potential markets for commercial expansion and partnership development.
- Hospital & Oncology Center Administrators : Healthcare leaders require market insights to justify AI investment decisions, benchmark adoption rates against peers, and understand competitive advantages of implementing precision medicine and diagnostic AI solutions.
- Investment & Private Equity Firms : Investors evaluating oncology AI companies need comprehensive European market data to assess growth potential, identify acquisition targets, and make informed funding decisions in this high-growth healthcare segment.
- Pharmaceutical & Biotech Companies : Pharma firms integrating AI into oncology workflows require market intelligence on adoption trends, reimbursement landscapes, and clinical integration opportunities across European healthcare systems.
- Healthcare Consultants & Analysts : Strategy consultants and market researchers need detailed European oncology AI data to support client advisory work, competitive analysis, and long-term healthcare transformation planning across the region.
Countries within Europe - compare and drill down
| Country | 2025 size (native) |
|---|---|
| Germany | USD 925.3 Million |
| UK | USD 646.4 Million |
| France | USD 675.1 Million |
| Italy | USD 274 Million |
| Spain | USD 206.6 Million |
| Rest Of Europe | USD 574.8 Million |
Country market size visualization
Reasons to Buy this Report
- Market Size & Growth Validation : Comprehensive data on Europe's $691.1M market with 29.8% CAGR through 2029 enables accurate forecasting and investment planning for oncology AI solutions targeting European healthcare systems.
- Country-Level Intelligence : Detailed market breakdown across Germany ($925.3M), France ($675.1M), UK ($646.4M), and other European nations provides granular insights for regional expansion strategies and competitive positioning.
- Regulatory & Compliance Insights : Understanding Europe's GDPR-compliant AI implementation landscape and stringent clinical validation requirements is critical for vendors seeking market entry and long-term sustainability in regulated healthcare environments.
- Competitive Landscape Analysis : Identify leading European oncology AI providers, emerging startups, and partnership opportunities. Benchmark your solutions against regional competitors and understand market consolidation trends.
- Strategic Investment Decisions : Data-driven insights support capital allocation decisions, M&A strategies, and go-to-market planning for AI oncology companies targeting Europe's high-growth, innovation-focused healthcare sector.
Frequently asked questions
What is the current size of Europe's AI in Oncology market?
Europe's AI in Oncology market was valued at $691.1 million in 2024 and is expected to grow significantly through 2029.
What is the projected market size for Europe's AI in Oncology by 2029?
Europe's AI in Oncology market is forecast to reach $3,302.2 million by 2029, representing substantial growth from 2024 levels.
What is the CAGR for Europe's AI in Oncology market?
Europe's AI in Oncology market is expected to grow at a compound annual growth rate (CAGR) of 29.8% between 2024 and 2029.
What factors are driving growth in Europe's AI in Oncology market?
Europe's market growth is driven by high healthcare spending, strong regulatory frameworks, increasing cancer prevalence, physician adoption of AI tools, and integration with electronic health record systems.
How does Europe's regulatory environment impact AI in Oncology development?
Europe's GDPR compliance and strict data privacy standards shape responsible AI development in oncology, ensuring patient safety while enabling innovation across the region.
RESEARCH METHODOLOGY
The study involved significant activities to estimate the current size of the AI in oncology. Exhaustive secondary research was done to collect information on the AI in oncology market. The next step was to validate these findings, assumptions, and sizing with industry experts across the value chain using primary research. Different approaches, such as top-down and bottom-up, were employed to estimate the total market size. After that, the market breakup and data triangulation procedures were used to estimate the market size of the segments and subsegments of the AI in oncology market.
Secondary Research
This research study involved the wide use of secondary sources, directories, and databases such as Dun & Bradstreet, Bloomberg Businessweek, and Factiva; white papers, annual reports, and companies’ house documents; investor presentations; and the SEC filings of companies. The market for the companies offering AI in oncology solutions is arrived at by secondary data available through paid and unpaid sources, analyzing the product portfolios of the major companies in the ecosystem, and rating the companies by their performance and quality. Various sources were referred to in the secondary research process to identify and collect information for this study. The secondary sources include annual reports, press releases, investor presentations of companies, white papers, journals, certified publications, and articles from recognized authors, directories, and databases.
Various secondary sources were referred to in the secondary research process to identify and collect information related to the study. These sources included annual reports, press releases, investor presentations of AI in oncology vendors, forums, certified publications, and whitepapers. The secondary research was used to obtain critical information on the industry’s value chain, the total pool of key players, market classification, and segmentation from the market and technology-oriented perspectives.
Primary Research
In the primary research process, various primary sources from both the supply and demand sides were interviewed to obtain qualitative and quantitative information for this report. The primary sources from the supply side included industry experts, such as Chief Executive Officers (CEOs), Vice Presidents (VPs), marketing directors, technology and innovation directors, and related key executives from various key companies and organizations operating in the AI in oncology market.
After the complete market engineering (calculations for market statistics, market breakdown, market size estimations, market forecasting, and data triangulation), extensive primary research was conducted to gather information and verify and validate the critical numbers arrived at. Primary research was also undertaken to identify the segmentation types, industry trends, competitive landscape of AI in oncology solutions offered by various market players, and key market dynamics, such as drivers, restraints, opportunities, challenges, industry trends, and key player strategies.
In the complete market engineering process, the top-down and bottom-up approaches and several data triangulation methods were extensively used to perform the market estimation and market forecasting for the overall market segments and subsegments listed in this report. Extensive qualitative and quantitative analysis was performed on the complete market engineering process to list the key information/insights throughout the report.
Breakdown of Primary Participants:
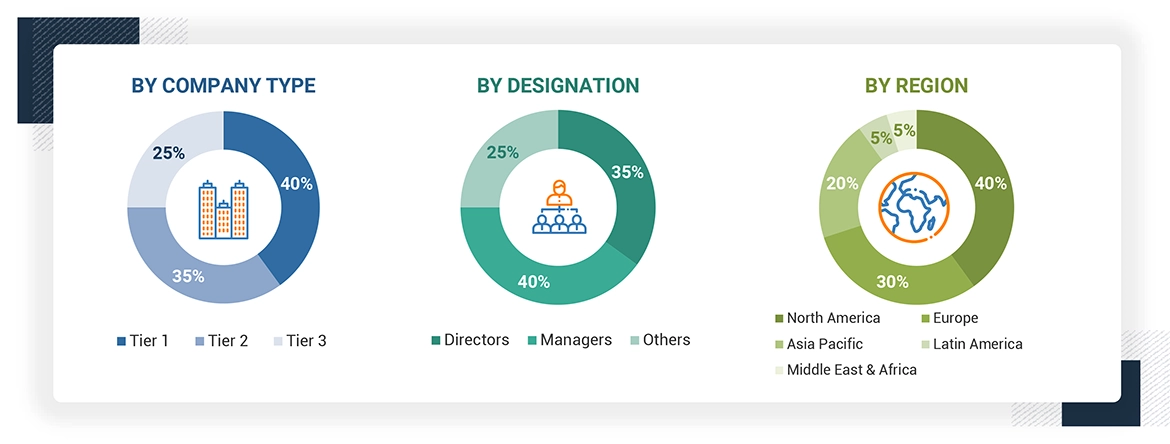
Note 1: Others include sales managers, marketing managers, and product managers.
Note 2: Tiers of companies are defined based on their total revenues in 2023. Tier 1 = >USD 1 billion, Tier 2 = USD 500 million to USD 1 billion, and Tier 3 = < USD 500 million.
To know about the assumptions considered for the study, download the pdf brochure
Market Size Estimation
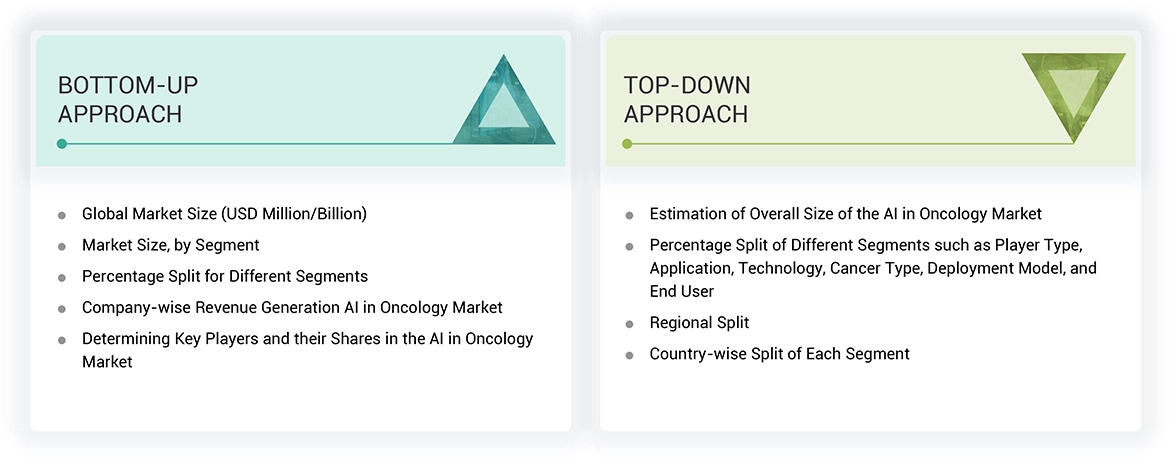
Both top-down and bottom-up approaches were used to estimate and validate the total size of the AI in oncology. These methods were also used extensively to estimate the size of various subsegments in the market. The research methodology used to estimate the market size includes the following:
- The key players in the industry and markets have been identified through extensive secondary research.
- The industry’s supply chain and market size, in terms of value, have been determined through primary and secondary research processes.
- All percentage shares, splits, and breakdowns have been determined using secondary sources and verified through primary sources.
Data Triangulation
After arriving at the overall market size using the market size estimation processes explained above, the market was split into several segments and subsegments. The data triangulation and market breakup procedures were employed, wherever applicable, to complete the overall market engineering process and arrive at the exact statistics of each market segment and subsegment. The data was triangulated by studying various factors and trends from both the demand and supply sides.
Market Definition
AI I in oncology is the utilization of AI tools such as machine learning, natural language processing, and computer vision, among others to analyze genomic data and large gene mutations that are unique to an individual’s cancer profile. These AI tools are adopted by various end-users including labs, research centers, hospitals, and biotechnology & pharmaceuticals, among others to address the global cancer burden and the need for precision medicine in oncology.
Further, AI boosts the speed and accuracy of cancer diagnosis and screening. The major developments include:
- Pathologists can detect malignancy in prostate biopsy photos with the help of FDA-approved AI software.
- AI quickly analyzes medical pictures, such as mammograms, increasing radiologists' productivity and enhancing risk assessment and detection of breast cancer.
- Deep learning is used by NCI scientists to automatically detect precancerous cervical lesions as part of their efforts to improve cervical and prostate cancer screening.
Stakeholders
- Clinical/Physician Centers
- AI Providers
- Clinical Research Organizations
- Pharmaceutical/Biopharmaceutical Companies
- Research and Development (R&D) Companies
- Business Research and Consulting Service Providers
- Medical Research Laboratories
- Academic Medical Centers/Universities/Hospitals
- Government Agencies
- Regulatory Agencies
- Clinical Researchers
- Clinical Research Organizations
- Accountable Care Organizations
- Investors and Venture Capitalists
Report Objectives
- To define, describe, and forecast the AI in oncology market based on player type, application, cancer type, technology, deployment model, end user, and region
- To provide detailed information about the major factors (drivers, opportunities, restraints, and challenges) influencing the growth of the market
- To analyze opportunities for stakeholders by identifying the high-growth segments of the market
- To forecast the size of the market segments with respect to five main regions: North America, Europe, Asia Pacific, the Middle East & Africa, and Latin America
- To analyze subsegments of the market with respect to individual growth trends, prospects, and contributions to the overall market
- To profile the key players and comprehensively analyze their market sizes and core competencies
- To track and analyze competitive developments such as acquisitions, collaborations, agreements, mergers, product launches & updates, partnerships, expansions, and other recent developments in the market globally
Get the Full AI in Oncology Market Report
Full forecast, segment splits, and company analysis for all AI in Oncology Market.
- Canada AI in Oncology Market
- US AI in Oncology Market
- Germany AI in Oncology Market
- UK AI in Oncology Market
- France AI in Oncology Market
- Italy AI in Oncology Market
- Spain AI in Oncology Market
- China AI in Oncology Market
- India AI in Oncology Market
- Japan AI in Oncology Market
- Brazil AI in Oncology Market
- Mexico AI in Oncology Market
- Rest Of Europe AI in Oncology Market
- Rest Of Asia Pacific AI in Oncology Market
- Rest Of Latin America AI in Oncology Market
- GCC Countries AI in Oncology Market
Need a Tailored Report?
Customize this report to your needs
Get 10% FREE Customization
Customize This Report
