
Asia Pacific Automated Stationary NDT & Inspection Systems Market (2025-2030)

The Asia Pacific Automated Stationary NDT & Inspection Systems Market was valued at $244.6 Million in 2025 and projected to reach to $412.1 Million by 2030, representing a compound annual growth rate of 11.0%. Asia Pacific's automated stationary NDT & inspection systems market is poised for substantial expansion through 2030, driven by rapid semiconductor manufacturing growth, increasing electronics production complexity, and stringent quality control mandates across the region.


| Market Size in | USD 26.32 MN |
| Market Forecast in | |
| CAGR | |
| Forecast Period | |
| Units Considered | Value (USD MN) |
Asia Pacific Automated Stationary NDT & Inspection Systems Market Trends and Insights
- In 2025, Asia Pacific's market is valued at $244.6 million, reflecting the region's critical role in electronics production and component validation.
- Asia Pacific is projected to reach $412.1 million by 2030, expanding at an 11.0% compound annual growth rate-outpacing global growth of 9.3%. The region's growth is fueled by increasing investments in advanced manufacturing facilities, rising adoption of Industry 4.0 technologies, and heightened demand for defect detection in semiconductor fabrication.
- Asia Pacific's competitive advantage stems from its concentration of major electronics manufacturers and foundries requiring sophisticated inspection solutions.
- Between 2025 and 2030, Asia Pacific will capture significant market share as automation and quality assurance become non-negotiable in semiconductor and electronics production..
Key Market Statistics
- CAGR (2025-2030) 11.0% CAGR
- Market Size, 2025 ~USD 244.6 Million
- Forecast, 2030 ~USD 412.1 Million
- Geography Asia Pacific
Asia Pacific Automated Stationary NDT & Inspection Systems Market Overview
Regional Market Leadership :
Asia Pacific commands the largest share of the global automated stationary NDT & inspection systems market, valued at $244.6 million in 2025, driven by the region's dominance in semiconductor manufacturing and electronics production.
Robust Growth Trajectory :
The Asia Pacific market is projected to grow at a 11% CAGR, outpacing the global average of 9.3%, reaching $412.1 million by 2030, reflecting accelerating demand for quality assurance in electronics manufacturing.
China's Manufacturing Dominance :
China leads Asia Pacific with a market size of $146.3 million, supported by its massive semiconductor fabrication capacity and stringent quality control requirements across electronics production facilities.
Emerging Growth Centers :
India ($88.6M) and Japan ($76.2M) represent significant growth opportunities, with expanding semiconductor ecosystems and increasing adoption of automated inspection technologies to meet international quality standards.
Asia Pacific Automated Stationary NDT & Inspection Systems Market Dynamics
- China's manufacturing dominance, coupled with India's emerging semiconductor ecosystem and Japan's advanced electronics sector, creates a dynamic growth environment.
- The region's 11% CAGR reflects strong investment in automation and quality assurance technologies. Key growth catalysts include rising demand for defect detection in semiconductor wafer production, expanding consumer electronics manufacturing, and regulatory pressures for product quality and safety compliance.
- As Asia Pacific continues to strengthen its position as the global electronics manufacturing hub, automated inspection systems adoption will accelerate, driven by cost reduction imperatives and the need for higher throughput and accuracy in production processes..
Market Ecosystem
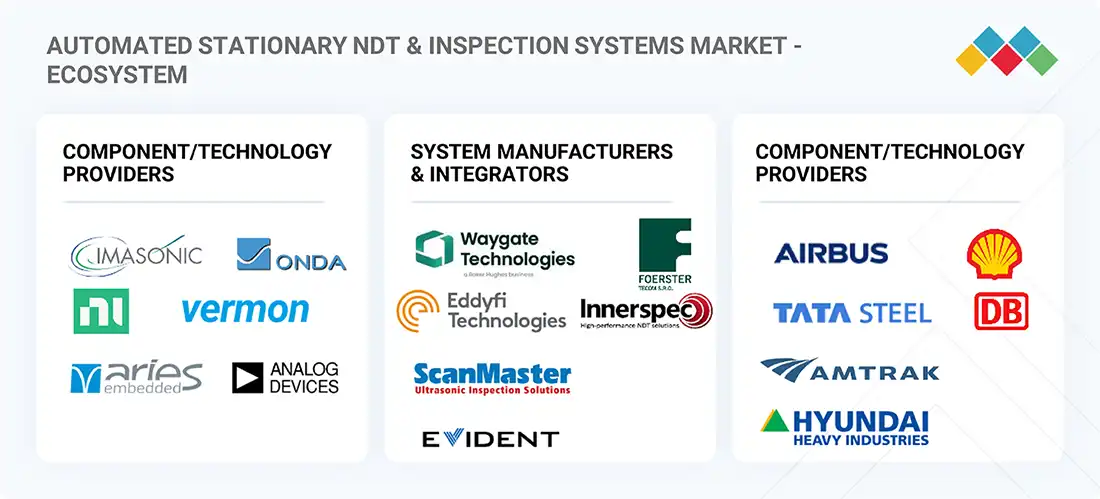
Automated Stationary NDT & Inspection Systems Market: COMMERCIAL USE CASES ACROSS INDUSTRIES
| COMPANY | USE CASE DESCRIPTION | BENEFITS |
|---|---|---|
 |
Automated phased array ultrasonic testing (PAUT) benches for aircraft composite structures | Detects micro-defects in carbon-fiber composites, ensures structural integrity, and reduces inspection time by 40% |
 |
Inline ultrasonic testing systems for continuous steel plate and pipe production | 100% real-time defect detection, reduced scrap, compliance with global metallurgical safety standards |
 |
Automated Magnetic Flux Leakage Testing (MFLT) for rail track inspection at manufacturing plants | Early detection of cracks and corrosion, improved passenger safety, and extended track lifecycle |
 |
Stationary immersion UT systems for refinery piping and pressure vessel inspection | Prevents leakage/failure, improves operational safety, and reduces unplanned downtime |
 |
Automated machine vision and laser-based VT systems for automotive welding line inspection | 100% inline weld quality checks, reduced recalls, and improved throughput and cost savings |
 |
Automated PAUT/ECT systems for weld inspection in ship hulls and LNG storage tanks | Enhanced weld reliability, faster certification compliance, and reduced manual re-inspection |
Logos and trademarks shown above are the property of their respective owners. Their use here is for informational and illustrative purposes only.
Related Ecosystem
Electrical System And Components
- Natural Language Processing (NLP)
- Sensors
- Machine Learning
- Temperature Sensors
- Actuators
- ABB India Limited
- Siemens ag
- SCHNEIDER ELECTRIC SE
- Eaton Corporation plc
- General Electric Company
Industrial Automation
- Sensors
- Image Sensors
- Manufacturing Execution System (MES)
- Actuators
- Flow Sensors
- ABB India Limited
- Siemens ag
- Emerson Electric Co.
- HONEYWELL INTERNATIONAL INC.
- SCHNEIDER ELECTRIC SE
Information System And Analytics
- Machine Learning
- Natural Language Processing (NLP)
- Sensors
- Software as A Service (SaaS)
- Data Loss Prevention (DLP)
- International Business Machines Corporation
- MICROSOFT CORPORATION
- Amazon.com, Inc.
- Oracle Corporation
Key Takeaways
- Asia Pacific's automated stationary NDT & inspection systems market is valued at $244.6 million in 2025 and will grow to $412.1 million by 2030 at an 11.0% CAGR.
- Asia Pacific's growth rate of 11.0% exceeds the global CAGR of 9.3%, positioning the region as the fastest-growing market for NDT inspection solutions.
- Asia Pacific's dominance is driven by semiconductor manufacturing concentration, Industry 4.0 adoption, and stringent quality control standards across electronics production.
- Between 2025 and 2030, Asia Pacific will see increased capital investment in automated inspection infrastructure to support defect detection and yield optimization.
Automated Stationary NDT & Inspection Systems Market Report Scope
| Report Metric | Details |
|---|---|
| Base Year | 2025 |
| Fastest Growing Segment | AEROSPACE (Vertical) |
| Forecast Period | 2025-2030 |
| Growth Rate | CAGR of 9.3% from 2025 to 2030 |
| Largest Segment | OFFLINE (System Type) |
| Market Size Base Year (Billions) | ~USD 0.77 (2025) |
| Revenue Forecast (Billions) | ~USD 1.2 (2030) |
| Segments Covered | System Type, Technology, Vertical, Type |
Asia Pacific Automated Stationary NDT & Inspection Systems Market Report Segmentation
4 segment dimensions are covered across the global market.
By System Type
- Inline
- Offline
By Technology
- Eddy Current Testing (Ect)
- Magnetic Flux Leakage Testing (Mflt)
- Other Technologies
- Ultrasonic Testing (Ut)
- Visual Testing (Vt)
By Vertical
- Aerospace
- Metals & Metallurgy
- Oil & Gas
- Other Verticals
- Rail
- Railway
By Type
- Eddy Current Array Testing (Ecat)
- Other Eddy Current Testing (Ect) Types
- Other Ultrasonic Testing (Ut) Types
- Phased Array Ultrasonic Testing (Paut)
- Pulsed Eddy Current Testing (Pect)
Target Audience
- Semiconductor Manufacturers : Semiconductor fabrication plants across Asia Pacific require detailed market insights to benchmark inspection system investments, evaluate automation ROI, and optimize quality control strategies in competitive manufacturing environments.
- Electronics OEMs & Contract Manufacturers : Electronics manufacturers in Asia Pacific need market data to assess automated inspection adoption trends, identify technology gaps, and plan capital expenditures for quality assurance infrastructure upgrades.
- NDT Equipment Suppliers & Vendors : Equipment manufacturers and system integrators require Asia Pacific market intelligence to identify growth opportunities, understand regional customer needs, and develop targeted sales and product strategies.
- Investment & Private Equity Firms : Investors evaluating opportunities in Asia Pacific's semiconductor and electronics sectors need market sizing and growth forecasts to assess investment potential and portfolio company performance benchmarks.
- Technology & Automation Consultants : Consulting firms advising manufacturing clients in Asia Pacific require regional market data to develop strategic recommendations, justify automation investments, and guide technology adoption decisions.
Countries within Asia Pacific - compare and drill down
| Country | 2025 size (native) |
|---|---|
| China | USD 146.3 Million |
| Japan | USD 76.2 Million |
| India | USD 88.6 Million |
| South Korea | USD 30.9 Million |
| Rest Of Asia Pacific | USD 70.1 Million |
Country market size visualization
Reasons to Buy this Report
- Regional Market Dominance Insights : Gain comprehensive understanding of why Asia Pacific leads the global market and how regional manufacturing dynamics shape NDT & inspection system demand across semiconductor and electronics sectors.
- Country-Level Competitive Intelligence : Access detailed market sizing for China ($146.3M), India ($88.6M), Japan ($76.2M), and South Korea ($30.9M) to identify high-growth opportunities and competitive positioning within Asia Pacific.
- Growth Trajectory Forecasting : Leverage the 11% CAGR projection through 2030 to develop strategic expansion plans, investment decisions, and product development roadmaps aligned with Asia Pacific's accelerating market growth.
- Sector-Specific Demand Drivers : Understand quality control requirements, manufacturing expansion trends, and regulatory pressures specific to Asia Pacific's semiconductor and electronics industries driving inspection system adoption.
- Strategic Market Entry Planning : Utilize Asia Pacific market data to identify optimal entry points, partnership opportunities, and customer segments within the region's rapidly expanding automated inspection systems landscape.
Frequently asked questions
What is the current market size of automated stationary NDT & inspection systems in Asia Pacific?
Asia Pacific's automated stationary NDT & inspection systems market is valued at $244.6 million in 2025, making it a significant segment within the global market.
What is the projected market size for Asia Pacific by 2030?
Asia Pacific's market is projected to reach $412.1 million by 2030, representing substantial growth over the five-year forecast period.
What is the CAGR for Asia Pacific's automated stationary NDT & inspection systems market?
Asia Pacific's market is expected to grow at an 11.0% compound annual growth rate from 2025 to 2030, outpacing the global average of 9.3%.
Why is Asia Pacific growing faster than the global market?
Asia Pacific's accelerated growth is driven by concentrated semiconductor manufacturing, rapid Industry 4.0 adoption, increasing quality standards, and substantial capital investments in automated inspection infrastructure.
Which countries in Asia Pacific are driving market growth?
Major semiconductor manufacturing hubs including China, Taiwan, South Korea, and Japan are primary growth drivers, supported by their dominance in electronics production and foundry services.
RESEARCH METHODOLOGY
The study involved major activities in estimating the current size of the automated stationary NDT & inspection systems market. Exhaustive secondary research has been done to collect information on the market, peer market, and parent market. To validate these findings, assumptions, and sizing with industry experts across the supply chain through primary research has been the next step. Both top-down and bottom-up approaches have been employed to estimate the complete market size. After that, market breakdown and data triangulation methods have been used to estimate the market size of segments and subsegments. Secondary and primary sources have been used to identify and collect information for an extensive technical and commercial study of the automated stationary NDT & inspection systems market.
Secondary Research
Various secondary sources have been referred to in the secondary research process to identify and collect information important for this study. The secondary sources include annual reports, press releases, and investor presentations of companies; white papers; journals and certified publications; and articles from recognized authors, websites, directories, and databases. Secondary research has been conducted to obtain key information about the industry’s supply chain, the market’s value chain, the total pool of key players, market segmentation according to the industry trends (to the bottom-most level), regional markets, and key developments from market- and technology-oriented perspectives. The secondary data has been collected and analyzed to determine the overall market size, further validated by primary research.
Primary Research
Extensive primary research was conducted after gaining knowledge about the current scenario of the automated stationary NDT & inspection systems market through secondary research. Several primary interviews were conducted with experts from the demand and supply sides across four major regions—North America, Europe, Asia Pacific, and RoW. This primary data was collected through questionnaires, emails, and telephonic interviews.
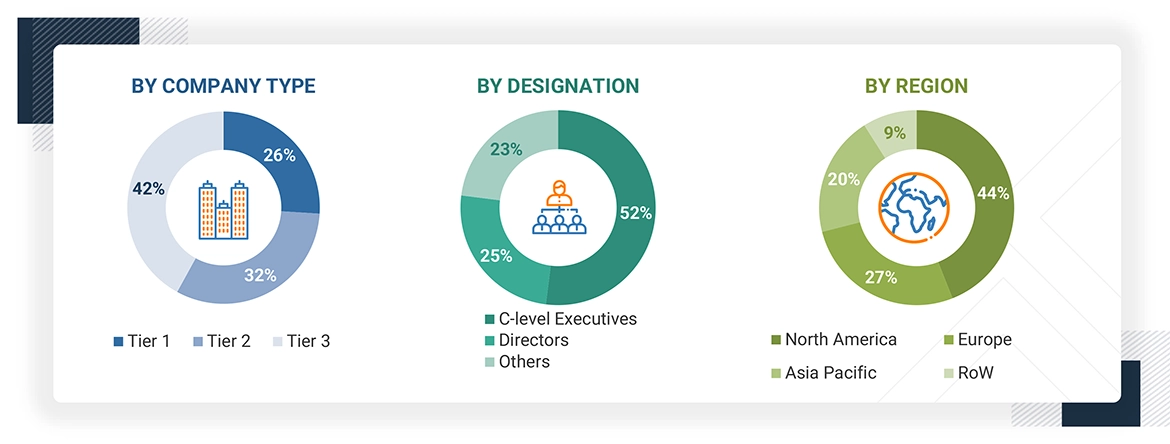
Note: RoW mainly comprises the Middle East & Africa (MEA) and South America.
Other designations include product managers, sales managers, and marketing managers.
Three tiers of companies have been defined based on their total revenue as of 2024; tier 3: Revenue less than USD 500 million; tier 2: Revenue between USD 500 million and 1 billion; and tier 1: Revenue more than USD 1 billion.
To know about the assumptions considered for the study, download the pdf brochure
Market Size Estimation
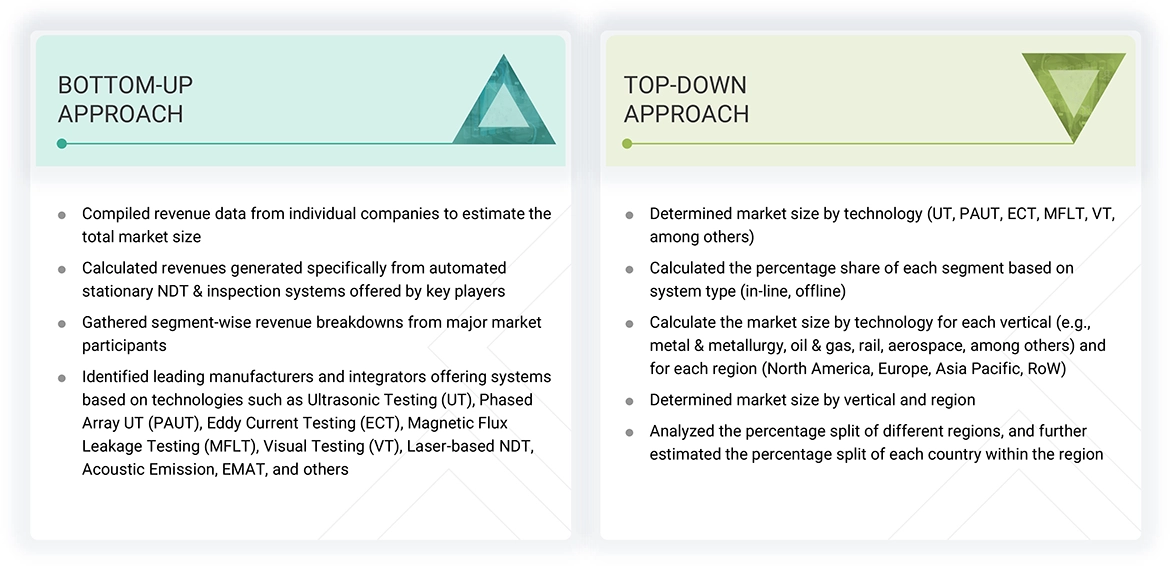
The bottom-up procedure has been employed to arrive at the overall size of the automated stationary NDT & inspection systems market.
- Collected financial data from individual equipment manufacturers and system integrators focused on automated stationary NDT & inspection systems
- Focused exclusively on revenues from fixed or installed inspection systems, excluding portable, handheld, and service-based revenues
- Estimated technology-specific revenues for systems based on Ultrasonic Testing (UT), Phased Array UT (PAUT), Eddy Current Testing (ECT), Magnetic Flux Leakage Testing (MFLT), Visual Testing (VT), Laser-based NDT, Acoustic Emission Testing, EMAT, and other emerging or hybrid NDT technologies
- Analyzed segment-wise revenue splits across key verticals such as oil & gas, rail, metals & metallurgy, aerospace, automotive, power generation, and other verticals
- Extracted product-level and vertical-specific revenue data from public company filings, investor reports, and direct disclosures
- Identified and mapped key market participants, including global OEMs, regional integrators, and specialized technology vendors across various NDT technologies and industry sectors
- Aggregated all data points to arrive at the total estimated market size for automated stationary NDT & inspection systems
The top-down approach has been used to estimate and validate the total size of the automated stationary NDT & inspection systems market.
- Assessed the overall NDT equipment market and filtered it to focus solely on the automated stationary NDT & inspection systems segment
- Segmented the market by key NDT technologies such as Ultrasonic Testing (UT), Phased Array UT (PAUT), Eddy Current Testing (ECT), Magnetic Flux Leakage Testing (MFLT), Visual Testing (VT), and other emerging methods
- Estimated market split by system type, differentiating between in-line and offline automated systems
- Calculated the share of each technology across major end-use verticals, including Metals & Metallurgy, Oil & Gas, Rail, Aerospace, Automotive, Power Generation, and others
- Mapped market size by region—North America, Europe, Asia Pacific, and Rest of the World (RoW)—for each technology and vertical
- Further refined estimates by analyzing the intra-regional share of countries within each broader geography
- Consolidated the above layers to derive the final market size and segmentation for the automated stationary NDT & inspection systems market
Automated Stationary NDT & Inspection Systems Market : Top-Down and Bottom-Up Approach
Data Triangulation
After arriving at the overall market size-using the market size estimation processes as explained above-the market has been split into several segments and subsegments. To complete the entire market engineering process and arrive at the exact statistics of each market segment and subsegment, data triangulation and market breakdown procedures have been employed, wherever applicable. The data has been triangulated by studying various factors and trends from the demand and supply sides in the automated stationary NDT & inspection systems market.
Market Definition
The Automated Stationary NDT (Non-Destructive Testing) & Inspection Systems encompasses permanently installed or fixed-position systems designed to evaluate the integrity, properties, or defects of materials and components without causing damage. These systems operate in-line or at fixed inspection stations within manufacturing, maintenance, or quality control environments. They utilize technologies such as Ultrasonic Testing (UT), Phased Array UT (PAUT), Eddy Current Testing (ECT), Magnetic Flux Leakage Testing (MFLT), Visual Testing (VT via machine vision), Laser-based NDT, Acoustic Emission Testing, Electromagnetic Acoustic Transducers (EMAT), and emerging hybrid methods. Unlike portable or manual inspection tools, automated stationary systems are integrated into production lines or test cells, enabling continuous, high-throughput, and repeatable inspection processes. These systems are used by equipment manufacturers and integrators (excluding NDT services) across critical industries such as Oil & Gas, Rail, Metals & Metallurgy, Aerospace, Automotive, General Manufacturing, Power Generation, and Marine. The market scope excludes radiography/CT, thermography, magnetic particle and penetrant testing, and handheld/manual inspection devices.
Key Stakeholders
- Equipment Manufacturers
- System Integrators
- Software & Analytics Providers
- Component & Sensor Suppliers
- End-use Industries
- Regulatory Bodies
- Standards Organizations
- Research Institutions
- Certification Bodies
- Distributors & Channel Partners
- Industry Associations
- Investors & Financial Institutions
- Automation & Robotics Providers
- Maintenance & Calibration Service Providers
Report Objectives
- To define, describe, and forecast the size of the automated stationary NDT & inspection systems market by technology, vertical, and system type, in terms of value
- To describe and forecast the market size for various segments concerning key regions, namely, North America, Europe, Asia Pacific, and RoW, in terms of value
- To provide detailed information regarding the key factors such as drivers, restraints, opportunities, and challenges influencing the growth of the market
- To understand and analyze the impact of evolving technologies on the overall supply chain of the automated stationary NDT & inspection systems market and upcoming trends in the ecosystem
- To provide macroeconomic outlooks with respect to the main geographies, namely, North America, Europe, Asia Pacific, and RoW
- To provide a detailed overview of the automated stationary NDT & inspection systems market, industry trends, and use cases
- To strategically analyze micromarkets for individual growth trends, prospects, and contributions to the total market
- To provide ecosystem analysis, trends/disruptions impacting customer business, case study analysis, ecosystem analysis, and Gen AI impact related to the automated stationary NDT & inspection systems market
- To analyze the opportunities in the market for stakeholders by identifying high-growth segments and detailing the competitive landscape for market players
- To profile the key players and comprehensively analyze their market position in terms of the market share and core competencies, along with a detailed competitive landscape for the market leaders
- To analyze the competitive developments, such as acquisitions, product launches, expansions, agreements, partnerships, and collaborations carried out by market players
Available customizations:
With the given market data, MarketsandMarkets offers customizations according to the company‘s specific needs. The following customization options are available for the report
Company Information
- Detailed analysis and profiling of additional market players (up to five)
Get the Full Automated Stationary NDT & Inspection Systems Market Report
Full forecast, segment splits, and company analysis for all Automated Stationary NDT & Inspection Systems Market.
- US Automated Stationary NDT & Inspection Systems Market
- Canada Automated Stationary NDT & Inspection Systems Market
- Mexico Automated Stationary NDT & Inspection Systems Market
- Germany Automated Stationary NDT & Inspection Systems Market
- UK Automated Stationary NDT & Inspection Systems Market
- France Automated Stationary NDT & Inspection Systems Market
- Italy Automated Stationary NDT & Inspection Systems Market
- Rest Of Europe Automated Stationary NDT & Inspection Systems Market
- China Automated Stationary NDT & Inspection Systems Market
- Japan Automated Stationary NDT & Inspection Systems Market
- India Automated Stationary NDT & Inspection Systems Market
- South Korea Automated Stationary NDT & Inspection Systems Market
- Rest Of Asia Pacific Automated Stationary NDT & Inspection Systems Market
Need a Tailored Report?
Customize this report to your needs
Get 10% FREE Customization
Customize This Report
