
Australia Automated Passenger Counting and Information System Market (2025-2030)

The Australia Automated Passenger Counting and Information System Market was valued at $4.5 Million in 2025 and projected to reach to $8.4 Million by 2030, representing a compound annual growth rate of 13.1%. Australia's Automated Passenger Counting and Information System market is poised for substantial growth through 2030, driven by major urban centers investing in smart public transportation solutions.


| Market Size in | USD 26.32 MN |
| Market Forecast in | |
| CAGR | |
| Forecast Period | |
| Units Considered | Value (USD MN) |
Australia Automated Passenger Counting and Information System Market Trends and Insights
- This represents a compound annual growth rate of 13.1%, significantly outpacing the global average of 8.8%.
- Australia's market expansion is driven by increasing urbanization, modernization of public transportation infrastructure, and growing demand for real-time passenger analytics across buses, trains, and transit networks. The Australian market benefits from the country's advanced technological adoption and substantial investment in smart city initiatives.
- Australia's transit operators are increasingly deploying automated passenger counting systems to optimize route planning, improve service reliability, and enhance passenger experience.
- Between 2025 and 2030, Australia is expected to see accelerated deployment of these systems across major metropolitan areas, particularly in Sydney, Melbourne, and Brisbane. Australia's strong market fundamentals reflect both government support for public transportation modernization and private sector innovation in semiconductor and electronics solutions.
- The 13.1% CAGR underscores Australia's position as a key growth market within the Asia Pacific region for automated passenger counting technologies..
Key Market Statistics
- CAGR (2025-2030) 13.1% CAGR
- Market Size, 2025 ~USD 4.5 Million
- Forecast, 2030 ~USD 8.4 Million
- Country Australia
Australia Automated Passenger Counting and Information System Market Overview
Strong Growth Trajectory :
Australia's Automated Passenger Counting and Information System market is growing at 13.1% CAGR, significantly outpacing the global average of 8.8%, demonstrating exceptional market momentum and investment potential.
Market Valuation Expansion :
The market is valued at $4.5 million in 2025 and is projected to reach $8.4 million by 2030, representing an 86% increase over the five-year forecast period.
Urbanization Drivers :
Increasing urbanization across Australian cities and modernization of public transportation infrastructure are primary catalysts fueling demand for advanced passenger counting and information systems.
Regional Leadership :
Australia demonstrates one of the highest growth rates in the Asia-Pacific region, positioning it as a key market for technology providers and transit operators seeking expansion opportunities.
Australia Automated Passenger Counting and Information System Market Dynamics
- Cities like Sydney, Melbourne, and Brisbane are prioritizing real-time passenger data analytics to optimize transit operations and enhance commuter experiences.
- Government initiatives supporting sustainable urban mobility and digital infrastructure modernization are accelerating adoption rates across regional and metropolitan transit networks. The forecast period will see increased integration of AI-powered analytics, IoT sensors, and cloud-based platforms within Australian transit systems.
- Rising passenger volumes, coupled with operator demand for operational efficiency and revenue optimization, will drive market expansion.
- Strategic partnerships between technology providers and state transport authorities will further accelerate market penetration, positioning Australia as a critical growth market within the global passenger counting systems landscape..
Market Ecosystem
Related Ecosystem
Electronics System And Components
- Sensors
- Temperature Sensors
- Pressure Sensors
- Actuators
- Image Sensors
- Lenovo
- Samsung
- Texas Instruments Incorporated
- HONEYWELL INTERNATIONAL INC.
- Teledyne Technologies Incorporated
Smart Lighting
- Fiber Laser
- Fluorescent Lighting
- Gas Lasers
- Sensors
- 3D Sensors
- Zumtobel group ag
- Nedap n.v.
- Acuity Brands, Inc.
- OSRAM Licht AG
- Philips
Key Takeaways
- Australia's automated passenger counting market is valued at $4.5 million in 2025 and is forecast to reach $8.4 million by 2030, representing 13.1% CAGR.
- Australia's growth rate of 13.1% significantly exceeds the global CAGR of 8.8%, positioning Australia as a high-growth market within Asia Pacific.
- Australia's market expansion is driven by smart city investments, public transportation modernization, and demand for real-time passenger analytics in major urban centers.
- Australia's advanced technological infrastructure and government support for transit modernization create favorable conditions for automated passenger counting system deployment through 2030.
Automated Passenger Counting and Information System Market Report Scope
| Report Metric | Details |
|---|---|
| Base Year | 2025 |
| Fastest Growing Segment | STEREOSCOPIC VISION (Technology) |
| Forecast Period | 2025-2030 |
| Growth Rate | CAGR of 8.8% from 2025 to 2030 |
| Largest Segment | PASSENGER INFORMATION SYSTEM (Offering) |
| Market Size Base Year (Billions) | ~USD 9.71 (2025) |
| Revenue Forecast (Billions) | ~USD 14.8 (2030) |
| Segments Covered | Offering, Installation Type, Technology, Application, Type |
Australia Automated Passenger Counting and Information System Market Report Segmentation
5 segment dimensions are covered across the global market.
By Offering
- Automated Passenger Counting System
- Passenger Information System
By Installation Type
- Infrastructure-Based Systems
- Vehicle-Integrated Systems
By Technology
- Infrared
- Other Technologies
- Stereoscopic Vision
- Time-Of-Flight
By Application
- Airways
- Buses
- Ferries
- Railways
- Roadways
- Trains & Trams
By Type
- Announcement & Emergency Communication Systems
- Display Systems
- Infotainment Systems
- Mobile Applications
Target Audience
- Transit Operators & Authorities : Australian public transport operators need market data to justify investments in passenger counting systems, optimize fleet operations, and improve service delivery across metropolitan and regional networks.
- Technology Solution Providers : Software and hardware vendors require Australia-specific market intelligence to develop localized offerings, identify partnership opportunities, and establish competitive positioning in this high-growth market.
- Investment & Private Equity Firms : Investors evaluating opportunities in Australian smart transit and IoT sectors need detailed market forecasts and growth drivers to assess portfolio companies and identify acquisition targets.
- Government & Policy Makers : Australian government agencies and urban planners require market insights to inform transportation policy, infrastructure funding decisions, and smart city initiatives aligned with growth projections.
- System Integrators & Consultants : Integration firms and management consultants need Australia-specific market data to advise clients on technology adoption, vendor selection, and implementation strategies for passenger information systems.
Reasons to Buy this Report
- Market-Specific Growth Intelligence : Gain detailed insights into Australia's 13.1% CAGR trajectory, enabling informed investment decisions and competitive positioning within this high-growth regional market.
- Accurate Valuation Forecasts : Access precise market sizing data projecting growth from $4.5M (2025) to $8.4M (2030), supporting strategic planning and resource allocation for Australian market entry or expansion.
- Urbanization & Infrastructure Trends : Understand Australia-specific urbanization drivers and public transportation modernization initiatives shaping demand for passenger counting and information systems across major cities.
- Competitive Landscape Analysis : Identify key players, market gaps, and opportunities within Australia's passenger counting ecosystem to develop targeted go-to-market strategies and partnership approaches.
- Regional Benchmarking : Compare Australia's 13.1% CAGR against the global 8.8% average to assess relative market attractiveness and prioritize resource deployment across geographic markets.
Frequently asked questions
What is the current market size of automated passenger counting systems in Australia?
Australia's automated passenger counting and information system market was valued at $4.5 million in 2025 and is expected to grow to $8.4 million by 2030.
What is the projected growth rate for Australia's automated passenger counting market?
Australia's market is projected to grow at a compound annual growth rate (CAGR) of 13.1% from 2025 to 2030, outpacing the global average of 8.8%.
Which Australian cities are leading adoption of automated passenger counting systems?
Major metropolitan areas including Sydney, Melbourne, and Brisbane are leading the deployment of automated passenger counting systems across Australia's public transportation networks.
What factors are driving growth in Australia's automated passenger counting market?
Key drivers include urbanization, smart city initiatives, public transportation modernization, demand for real-time passenger analytics, and government investment in transit infrastructure across Australia.
How does Australia's market growth compare to the global market?
Australia's 13.1% CAGR significantly outpaces the global CAGR of 8.8%, making Australia one of the fastest-growing markets for automated passenger counting systems within the Asia Pacific region.
RESEARCH METHODOLOGY
The research process for this study included systematic gathering, recording, and analysis of data about customers and companies operating in the automated passenger counting and information system market. This process involved the extensive use of secondary sources, directories, and databases (Factiva and Oanda) to identify and collect valuable information for the comprehensive, technical, market-oriented, and commercial study of the automated passenger counting and information system market. In-depth interviews were conducted with primary respondents, including experts from core and related industries and preferred manufacturers, to obtain and verify critical qualitative and quantitative information and assess growth prospects. Key players in the automated passenger counting and information system market were identified through secondary research, and their market rankings were determined through primary and secondary research. This research included studying annual reports of top players and interviewing key industry experts such as CEOs, directors, and marketing executives.
Secondary Research
Various sources were used in the secondary research process to identify and collect information important for this study. These include company annual reports, press releases, investor presentations, white papers, technology journals, certified publications, articles by recognized authors, directories, and databases.
Secondary research was mainly used to obtain key information about the industry’s value chain, the total pool of market players, the market classification according to industry trends to the bottom-most level, regional markets, and key developments from market and technology-oriented perspectives.
Primary Research
Primary research was also conducted to identify the segmentation types, key players, competitive landscape, and key market dynamics, such as drivers, restraints, opportunities, challenges, and industry trends, along with key strategies adopted by players operating in the automated passenger counting and information system market. Extensive qualitative and quantitative analyses were performed on the complete market engineering process to list key information and insights throughout the report.
Extensive primary research has been conducted after acquiring knowledge about automated passenger counting and information system market scenarios through secondary research. Several primary interviews have been conducted with experts from the demand (end use and region) and supply side (image detection technique, type) across four major geographic regions: North America, Europe, Asia Pacific, and RoW. Approximately 60% and 40% of the primary interviews were conducted from the supply and demand sides, respectively. These primary data have been collected through questionnaires, emails, and telephonic interviews.
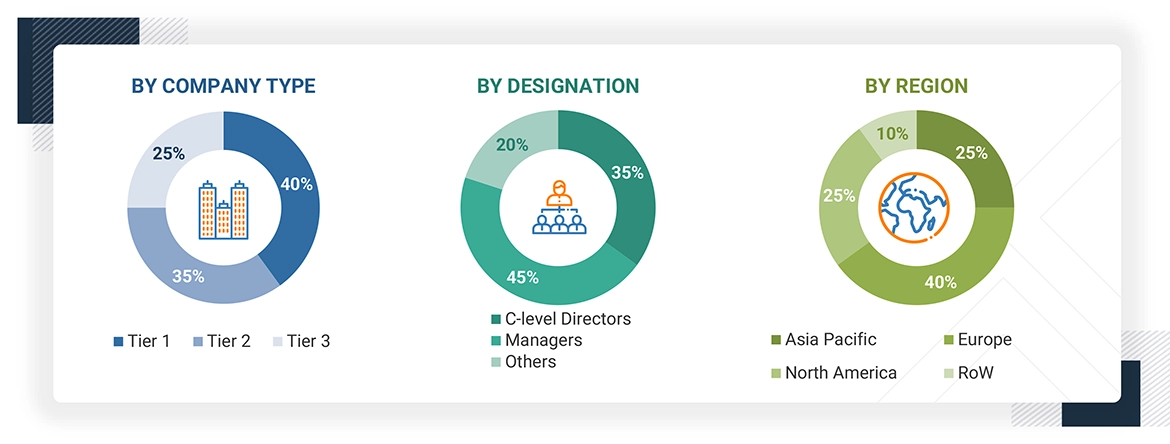
Notes: The three tiers of the companies have been defined based on their total/segmental revenue as of 2024: Tier 1 = >USD 1 billion, Tier 2 = USD 1 billion–USD 500 million, and Tier 3 = USD 500 million.
‘Others’ include sales, marketing, and product managers.
To know about the assumptions considered for the study, download the pdf brochure
Market Size Estimation
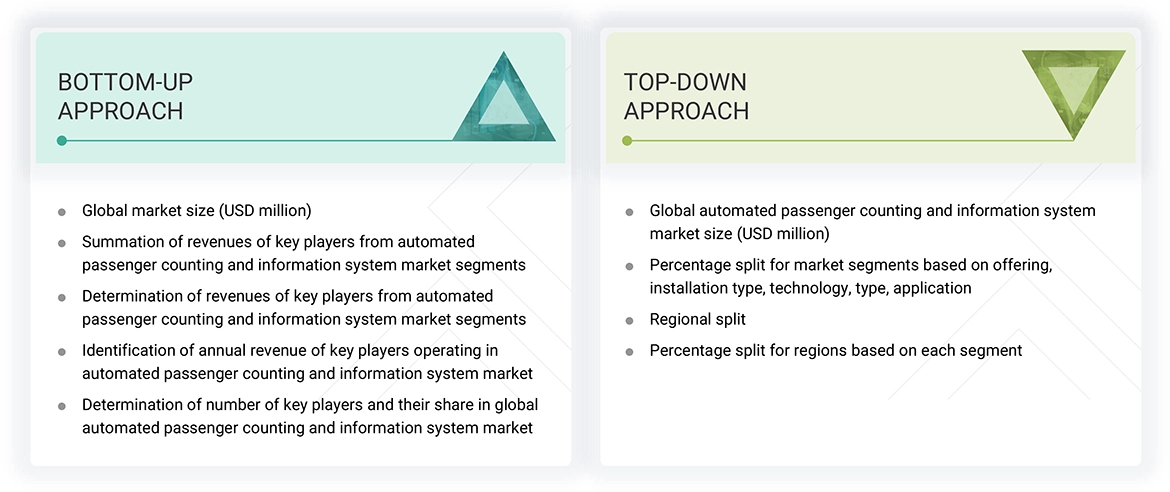
In the complete market engineering process, top-down and bottom-up approaches and several data triangulation methods were implemented to estimate and validate the size of the automated passenger counting and information system market and various other dependent submarkets. Key players in the market were identified through secondary research, and their market share in the respective regions was determined through primary and secondary research. This entire research methodology included the study of annual and financial reports of the top players, as well as interviews with experts (such as CEOs, VPs, directors, and marketing executives) for key insights (quantitative and qualitative).
All percentage shares, splits, and breakdowns were determined using secondary sources and verified through primary sources. All the possible parameters that affect the markets covered in this research study were accounted for, viewed in detail, verified through primary research, and analyzed to obtain the final quantitative and qualitative data. This data was consolidated and supplemented with detailed inputs and analysis from MarketsandMarkets and presented in this report.
Automated Passenger Counting and Information System Market : Top-Down and Bottom-Up Approach
Data Triangulation
After arriving at the overall market size from the estimation process, as explained above, the total market has been split into several segments and subsegments. To complete the overall market engineering process and arrive at the exact statistics for all segments and subsegments, market breakdown and data triangulation procedures have been employed, wherever applicable. The data have been triangulated by studying various factors and trends from the demand and supply sides. Along with this, the market has been validated using top-down and bottom-up approaches.
Market Definition
Automated passenger counting (APC) systems comprise electronic devices that count the number of passengers boarding and alighting transit vehicles, including buses, trains, and ferries. These systems offer more accurate and reliable results than the traditional method of counting passengers manually. With the help of the automatic passenger counter, every passenger who goes on board and alights a public transit vehicle at each stop of any route can be monitored and recorded easily. This helps simplify data collection and enables far greater accuracy and scope for generating database reports on ridership information.
Passenger information systems (PIS) are electronic information systems that provide passengers with real-time information. This information can include the arrival and departure times of transit vehicles and the nature and cause of disruptions in case of delays. These systems are installed at transportation hubs or can be used remotely through web browsers and smartphones.
Key Stakeholders
- End users
- Government bodies, venture capitalists, and private equity firms
- Technology providers
- Technology distributors
- System integrators
- Mobile application developers
- Networking and communication service providers
- Passenger information system software providers
- Automated passenger counting and information system industry associations
- Professional service/solution providers
- Research institutions and organizations
- Standards organizations and regulatory authorities
- Technology consultants
Report Objectives
- To define, describe, and forecast the automated passenger counting and information system market, based on offering and installation type in terms of value
- To define, describe, and forecast the automated passenger counting system market based on technology and application, in terms of value
- To define, describe, and forecast the passenger information system market based on type and application, in terms of value
- To forecast the automated passenger counting and information system market size, in terms of volume
- To forecast the size of the market segments for four major regions—North America, Europe, Asia Pacific, and Rest of the World (RoW)
- To provide detailed information regarding the major drivers, restraints, opportunities, and challenges influencing the growth of the market
- To strategically analyze micromarkets concerning individual growth trends, prospects, and contributions to the total market
- To study the complete value chain and allied industry segments and perform a value chain analysis of the market
- To strategically profile the key players and comprehensively analyze their market shares and core competencies
- To analyze the opportunities in the market for stakeholders and describe the competitive landscape of the market
- To analyze competitive developments such as joint ventures, collaborations, agreements, contracts, partnerships, mergers & acquisitions, product developments, and research & development (R&D) in the market
- To understand the impact of AI on the automated passenger counting and information system market
- To understand the 2025 US tariff impact
Available customizations:
With the given market data, MarketsandMarkets offers customizations according to the company’s specific needs. The following customization options are available for the report:
Get the Full Automated Passenger Counting and Information System Market Report
Full forecast, segment splits, and company analysis for all Automated Passenger Counting and Information System Market.
- US Automated Passenger Counting and Information System Market
- Canada Automated Passenger Counting and Information System Market
- Mexico Automated Passenger Counting and Information System Market
- Germany Automated Passenger Counting and Information System Market
- UK Automated Passenger Counting and Information System Market
- France Automated Passenger Counting and Information System Market
- Spain Automated Passenger Counting and Information System Market
- Italy Automated Passenger Counting and Information System Market
- Nordics Automated Passenger Counting and Information System Market
- Poland Automated Passenger Counting and Information System Market
- Rest Of Europe Automated Passenger Counting and Information System Market
- China Automated Passenger Counting and Information System Market
- Japan Automated Passenger Counting and Information System Market
- India Automated Passenger Counting and Information System Market
- South Korea Automated Passenger Counting and Information System Market
- Rest Of Asia Pacific Automated Passenger Counting and Information System Market
Need a Tailored Report?
Customize this report to your needs
Get 10% FREE Customization
Customize This Report
