
Asia Pacific Photovoltaics Market (2025-2030)

The Asia Pacific Photovoltaics Market was valued at $381580 Million in 2025 and projected to reach to $632870 Million by 2030, representing a compound annual growth rate of 10.6%. Asia Pacific's photovoltaics market is poised for exceptional growth, expanding from USD 381,580 million in 2025 to USD 632,870 million by 2030.


| Market Size in | USD 26.32 MN |
| Market Forecast in | |
| CAGR | |
| Forecast Period | |
| Units Considered | Value (USD MN) |
Asia Pacific Photovoltaics Market Trends and Insights
- In 2025, Asia Pacific's photovoltaics market is estimated at USD 381,580 million, driven by aggressive renewable energy policies, declining solar panel costs, and massive infrastructure investments across the region.
- By 2030, Asia Pacific is projected to reach USD 632,870 million, reflecting a compound annual growth rate of 10.6%, significantly outpacing global growth trends. The Asia Pacific photovoltaics market benefits from favorable government incentives, grid modernization initiatives, and rising electricity demand across emerging economies.
- Asia Pacific countries including China, India, and Japan are leading solar installations, supported by manufacturing scale and technological innovation.
- Between 2025 and 2030, Asia Pacific is expected to capture increasing market share as energy transition accelerates and battery storage integration becomes mainstream. Asia Pacific's competitive landscape features both established manufacturers and emerging players leveraging cost advantages and regional supply chains.
- The region's photovoltaics market growth is underpinned by corporate renewable commitments, utility-scale projects, and distributed solar adoption across residential and commercial segments throughout Asia Pacific..
Key Market Statistics
- CAGR (2025-2030) 10.6% CAGR
- Market Size, 2025 ~USD 381580 Million
- Forecast, 2030 ~USD 632870 Million
- Geography Asia Pacific
Asia Pacific Photovoltaics Market Overview
Market Dominance :
Asia Pacific commands the largest share of global photovoltaics capacity, with China alone accounting for nearly 40% of worldwide solar installations. The region's 10.6% CAGR significantly outpaces the global average of 9.6%, solidifying its position as the engine of solar energy growth.
Cost Competitiveness :
Declining solar panel manufacturing costs across Asia Pacific, particularly in China and India, have made photovoltaic systems the most cost-effective renewable energy solution. This cost advantage drives rapid adoption across residential, commercial, and utility-scale projects throughout the region.
Policy & Investment Momentum :
Aggressive renewable energy targets, government subsidies, and massive infrastructure investments across Asia Pacific nations are accelerating solar deployment. Countries like India and Indonesia are implementing ambitious solar capacity expansion programs to meet energy demands and climate commitments.
Infrastructure Expansion :
Asia Pacific's rapid urbanization and industrialization create substantial demand for distributed solar solutions. Large-scale solar farms, rooftop installations, and grid-connected systems are expanding rapidly, supported by improving grid infrastructure and energy storage integration.
Asia Pacific Photovoltaics Market Dynamics
- This 10.6% CAGR reflects the region's commitment to renewable energy transition, driven by declining technology costs, supportive government policies, and increasing electricity demand from emerging economies.
- China's manufacturing dominance and India's aggressive solar targets will continue to propel regional expansion. The outlook is further strengthened by technological advancements in panel efficiency, energy storage integration, and smart grid solutions.
- Southeast Asian nations are emerging as high-growth markets, while established players like Japan and South Korea focus on advanced solar technologies.
- Investment in manufacturing capacity, supply chain resilience, and grid modernization will sustain the region's leadership in global photovoltaics through 2030 and beyond..
Market Ecosystem
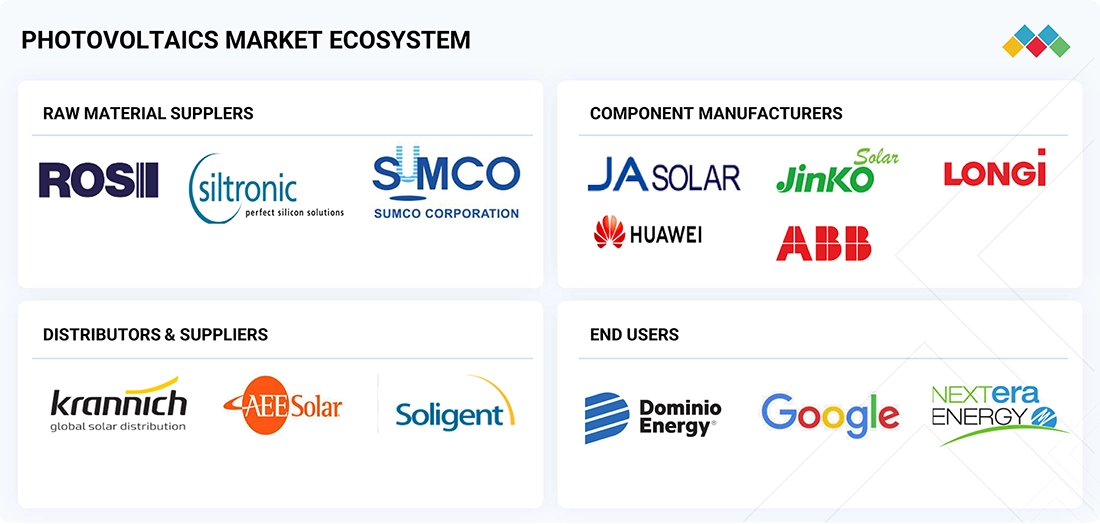
Photovoltaics (PV) Market: COMMERCIAL USE CASES ACROSS INDUSTRIES
| COMPANY | USE CASE DESCRIPTION | BENEFITS |
|---|---|---|
 |
Deployment of high-efficiency Tiger Neo N-type bifacial modules in utility-scale solar farms and commercial rooftops | Enhances energy yield with higher conversion efficiency and improved performance under low-light conditions |
 |
Supply of PERC and bifacial modules for industrial and commercial solar power plants across Europe and Asia | Provides stable power generation and reduces the overall levelized cost of electricity (LCOE) | Provides stable power generation and reduces overall levelized cost of electricity (LCOE) |
 |
Implementation of Vertex series ultra-high-power modules in large commercial installations and smart energy projects | Delivers greater energy density, space optimization, and long-term reliability |
 |
Integration of monocrystalline P-type and HJT modules in corporate and industrial solar projects | Offers superior efficiency, longer lifespan, and consistent performance in diverse climates |
 |
Production and deployment of high-efficiency solar cells and modules for distributed commercial energy systems | Ensures cost-effective energy production with high conversion rates and sustainability benefits |
Logos and trademarks shown above are the property of their respective owners. Their use here is for informational and illustrative purposes only.
Related Ecosystem
Electrical System And Components
- Natural Language Processing (NLP)
- Sensors
- Machine Learning
- Temperature Sensors
- Actuators
- ABB India Limited
- Siemens ag
- SCHNEIDER ELECTRIC SE
- Eaton Corporation plc
- General Electric Company
Key Takeaways
- Asia Pacific photovoltaics market will grow from USD 381.6B in 2025 to USD 632.9B by 2030 at a 10.6% CAGR, outpacing global growth.
- Asia Pacific leads global solar capacity additions driven by China, India, and Japan's renewable energy targets and manufacturing dominance.
- Government subsidies, declining panel costs, and grid modernization are primary growth catalysts for Asia Pacific's photovoltaics expansion.
- Asia Pacific's competitive advantage stems from vertically integrated supply chains, cost leadership, and emerging energy storage integration across the region.
Photovoltaics Market Report Scope
| Report Metric | Details |
|---|---|
| Base Year | 2025 |
| Fastest Growing Segment | FLEXIBLE (Type) |
| Forecast Period | 2025–2030 |
| Growth Rate | CAGR of 9.6% from 2025 to 2030 |
| Largest Segment | RIGID (Type) |
| Market Size Base Year (Billions) | ~USD 612.3 (2025) |
| Revenue Forecast (Billions) | ~USD 968.32 (2030) |
| Segments Covered | Component, Value And Volume, Application, Bos Type, Type |
Asia Pacific Photovoltaics Market Report Segmentation
5 segment dimensions are covered across the global market.
By Component
- Balance Of System (Bos)
- Inverters
- Modules
By Value And Volume
- Market Value (Usd Billion)
- Market Volume (Gw)
By Application
- Commercial & Industrial
- Residential
- Utilities
By Bos Type
- Batteries
- Connections & Cables
- Junction Boxes
- Monitoring Systems
- Other Bos Types
- Safety Equipment
- Trackers
By Type
- Flexible
- Rigid
Target Audience
- Solar Equipment Manufacturers : Manufacturers need Asia Pacific market data to optimize production capacity, identify high-demand countries, and develop region-specific product strategies. Understanding country-level market sizes and growth rates informs expansion and localization decisions.
- Renewable Energy Investors : Investment firms require detailed Asia Pacific photovoltaics forecasts to evaluate project opportunities, assess market maturity, and allocate capital across countries. Country-specific data enables risk assessment and return projections for solar ventures.
- Utility & Energy Companies : Utilities planning solar integration and grid modernization need Asia Pacific market intelligence to benchmark capacity expansion, understand competitive dynamics, and identify partnership opportunities across the region's diverse energy markets.
- Government & Policy Makers : Policymakers use market data to design renewable energy targets, evaluate policy effectiveness, and benchmark performance against regional peers. Asia Pacific photovoltaics insights support evidence-based energy transition planning and climate commitments.
- Consulting & Advisory Firms : Consultants advising clients on Asia Pacific expansion require comprehensive market data, country-level forecasts, and competitive analysis. This intelligence supports strategic recommendations, feasibility studies, and market entry planning for solar sector clients.
Key Companies in the Asia Pacific Photovoltaics Market
| Company | HQ | Ownership | Strongest segments |
|---|---|---|---|
| SOJITZ CORPORATION | Japan | Public Company | Energy, Power & Infrastructure (IPP, IPP/IWPP, LNG, oil & gas),Automotive, Aerospace & Transportation (autos, aircraft, defense, business jets, marine),Metals, Minerals & Resource Recycling, |
| ALFA LAVAL AB | Sweden | Public Company | Heat transfer (plate, air-cooled, tubular, scraped surface),Separation (decanters, separators),Fluid handling (pumps, valves, mixers, tank cleaning), |
| OCI COMPANY LTD. | Netherlands | Public Company | Nitrogen fertilizers (ammonia, urea, UAN, CAN, ammonium sulphate, AN+S),Methanol (US and Europe),Industrial nitrogen derivatives (nitric acid, melamine, CO2, DEF, other nitrogen products), |
| BOREALIS AG | Austria | Private Company | Polyethylene solutions,Polypropylene solutions,Recyclates and circular solutions, |
| ZUMTOBEL GROUP AG | Austria | Public Company | Professional indoor luminaires,Outdoor and infrastructure luminaires,Components (LED drivers, modules, sensors), |
| JA SOLAR TECHNOLOGY CO.,LTD. | China | Public Company | PV modules,Monocrystalline silicon rods and wafers,PV materials and components, |
| TONGWEI CO., LTD. | China | Public Company | Industrial and high-purity crystalline silicon,Solar cells and modules,PV power generation and operation, |
| CANADIAN SOLAR | Canada | Public Company | Photovoltaic modules,Battery energy storage products and solutions,Solar system kits, inverters, and power electronics, |
| FIRST SOLAR | United States | Public Company | Utility-scale CdTe module sales,Project development and EPC-related activities,Operations, maintenance, and other services, |
| HANWHA QCELLS | South Korea | Public Company | PV modules,PV cells,Silicon ingots and wafers, |
| MITSUBISHI ELECTRIC CORPORATION | Japan | Public Company | Factory Automation & Industrial Systems,Building Systems (Elevators, Escalators, BMS),Air Conditioning, Refrigeration & Home Equipment, |
| SHARP CORPORATION | Japan | Public Company | Smart Life & Energy (appliances, air treatment, solar, storage),Smart Office (MFPs, information displays, POS, PCs, solutions),Universal Network (telecoms, mobile, routers, consumer AV), |
| SUNGROW | China | Public Company | Photovoltaic inverters,Energy storage systems,Wind power converters and transmission products, |
| SMA SOLAR TECHNOLOGY AG | Germany | Public Company | Home & Business PV Inverters,Battery & Hybrid Inverters,Large Scale & Project Inverters, |
| SOLAREDGE | Israel | Public Company | Inverters and power optimizers,Storage solutions (home battery 400V, CSS-OD),EV chargers (residential and commercial), |
SOJITZ CORPORATION
Sojitz Corporation is a Japanese public company founded in 1862 with 26,789 employees. It operates as a diversified trading and investment company serving global markets.
ALFA LAVAL AB
Alfa Laval AB is a Swedish public company established in 1883 with 24,832 employees. The company specializes in heat transfer, separation, and fluid handling technologies.
OCI COMPANY LTD.
OCI Company Ltd. is a Dutch public company founded in 2013 with 761 employees. The company operates in the chemical and materials sector.
BOREALIS AG
Borealis AG is an Austrian private company founded in 1994 with 5,887 employees. The company is a leading provider of polyolefins and base chemicals.
ZUMTOBEL GROUP AG
Zumtobel Group AG is an Austrian public company founded in 1950 with 5,148 employees. The company is a leading provider of lighting solutions and components.
JA SOLAR TECHNOLOGY CO.,LTD.
JA Solar Technology Co., Ltd. is a Chinese public company founded in 2000 with 25,260 employees. The company manufactures photovoltaic products and solar cells.
TONGWEI CO., LTD.
Tongwei Co., Ltd. is a Chinese public company founded in 1995 with 44,798 employees. The company operates in feed production, aquaculture, and photovoltaic materials.
CANADIAN SOLAR
Canadian Solar is a Canadian public company founded in 2001 with 12,587 employees. The company designs, develops, and manufactures solar photovoltaic modules and systems.
FIRST SOLAR
First Solar is an American public company founded in 1999. The company manufactures thin-film photovoltaic solar modules and provides solar energy solutions.
HANWHA QCELLS
Hanwha Q Cells is a South Korean public company. Insufficient employment and founding data available for complete description.
MITSUBISHI ELECTRIC CORPORATION
Mitsubishi Electric Corporation is a Japanese public company founded in 1921 with 150,386 employees. The company manufactures electrical and electronic equipment across multiple industries.
SHARP CORPORATION
Sharp Corporation is a Japanese public company founded in 1912 with 34,549 employees. The company manufactures electronics, displays, and solar energy products.
SUNGROW
Sungrow is a Chinese public company founded in 1997 with 19,006 employees. The company manufactures power conversion and energy storage systems for solar applications.
SMA SOLAR TECHNOLOGY AG
SMA Solar Technology AG is a German public company founded in 1981 with 3,659 employees. The company develops and manufactures solar inverters and energy management systems.
SOLAREDGE
SolarEdge is an Israeli public company founded in 2006 with 3,576 employees. The company designs and manufactures power optimizers and inverters for solar photovoltaic systems.
Countries within Asia Pacific - compare and drill down
| Country | 2025 size (native) |
|---|---|
| China | USD 389880 Million |
| Japan | USD 31720 Million |
| India | USD 57470 Million |
| South Korea | USD 10110 Million |
| Australia | USD 20690 Million |
| Indonesia | USD 77580 Million |
| Malaysia | USD 460 Million |
| Thailand | USD 1550 Million |
| Vietnam | USD 10030 Million |
Country market size visualization
Reasons to Buy this Report
- Regional Market Sizing & Forecasts : Obtain precise market valuations for Asia Pacific photovoltaics with country-level breakdowns. Our data covers 2025-2030 projections, enabling accurate business planning and investment decisions specific to the region's fastest-growing solar markets.
- Competitive Landscape Intelligence : Understand market dynamics across Asia Pacific's diverse geographies, from China's manufacturing dominance to India's utility-scale expansion and Indonesia's emerging solar potential. Identify growth opportunities and competitive positioning by country and market segment.
- Policy & Regulatory Insights : Access comprehensive analysis of renewable energy policies, government incentives, and regulatory frameworks driving photovoltaics adoption across Asia Pacific nations. Stay informed on subsidy changes, tariff structures, and grid connection requirements by country.
- Investment & Growth Opportunities : Identify high-potential markets and investment corridors within Asia Pacific. Our analysis highlights emerging economies with accelerating solar adoption, favorable policy environments, and infrastructure development needs aligned with photovoltaics expansion.
- Supply Chain & Manufacturing Trends : Gain insights into Asia Pacific's solar manufacturing ecosystem, cost dynamics, and supply chain developments. Understand production capacity trends, technology shifts, and sourcing strategies critical for competitive advantage in the region's rapidly evolving market.
Frequently asked questions
What is the projected market size for Asia Pacific photovoltaics in 2030?
Asia Pacific's photovoltaics market is projected to reach USD 632,870 million by 2030, up from USD 381,580 million in 2025.
What is the CAGR for Asia Pacific photovoltaics between 2025 and 2030?
Asia Pacific photovoltaics market is expected to grow at a compound annual growth rate of 10.6% from 2025 to 2030.
Which countries drive Asia Pacific's photovoltaics market growth?
China, India, and Japan are the primary drivers of Asia Pacific's photovoltaics market, accounting for the majority of regional solar capacity installations and manufacturing output.
What factors are accelerating photovoltaics adoption in Asia Pacific?
Key growth drivers in Asia Pacific include government renewable energy mandates, declining solar panel costs, grid modernization investments, and rising electricity demand across emerging economies.
How does Asia Pacific's photovoltaics growth compare to global trends?
Asia Pacific's 10.6% CAGR significantly exceeds the global photovoltaics CAGR of 9.6%, reflecting the region's strategic importance and accelerating energy transition.
RESEARCH METHODOLOGY
The study involved major activities in estimating the current size of the photovoltaics market. Exhaustive secondary research was done to collect information on photovoltaics. The next step was to validate these findings, assumptions, and sizing with industry experts across the value chain using primary research. Different approaches, such as top-down and bottom-up, were employed to estimate the total market size. After that, the market breakup and data triangulation procedures were used to estimate the market size of the segments and subsegments of the photovoltaics.
Secondary Research
Secondary sources for this research study include government sources, corporate filings (annual reports, investor presentations, and financial statements), trade journals, articles, white papers, industry news, and business and professional associations. The secondary data has been collected and analyzed to arrive at the overall market size, which has been further validated through primary research. A few important secondary sources referred to for this research study are the Solar Energy Industries Association (SEIA), the American Solar Energy Society (ASES), the International Electrotechnical Commission (IEC), and the Indian Solar Manufacturers Association (ISMA).
Primary Research
Extensive primary research has been conducted after understanding and analyzing the photovoltaics market scenario through secondary research. Several primary interviews have been conducted with key opinion leaders from the demand and supply sides across four major regions—North America, Europe, Asia Pacific, and RoW. Approximately 30% of the primary interviews were conducted with the demand side and 70% with the supply side. Primary data was mainly collected through telephonic interviews, which comprised 80% of the overall primary interviews; questionnaires and emails were also used to collect the data.
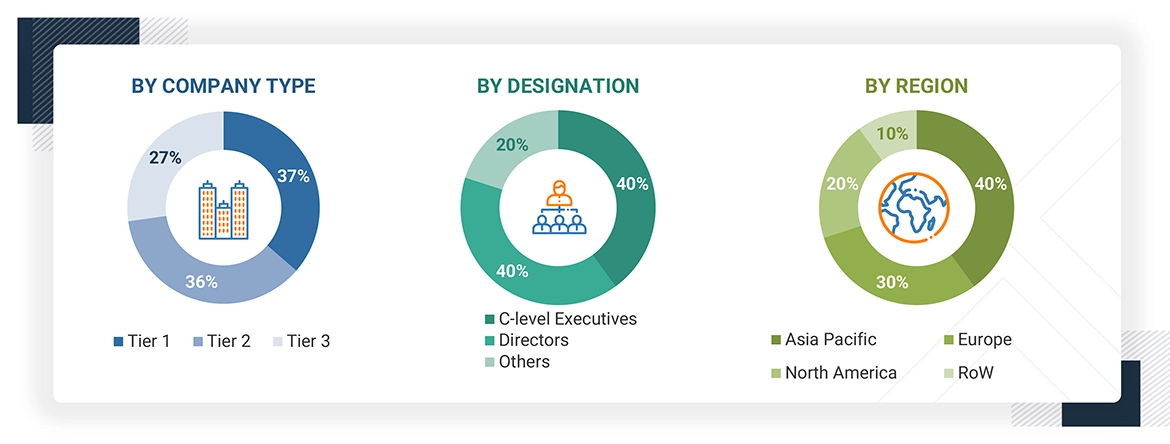
Note: Other designations include sales and marketing executives and researchers, as well as members of various photovoltaic technology organizations.
Sales, business development, and product managers are covered under the “managers” category.
Three tiers of companies are defined based on their total revenue as of 2024: tier 1: revenue more than or equal to USD 500 million, tier 2: revenue between USD 100 million and USD 500 million, and tier 3: revenue less than or equal to USD 100 million.
To know about the assumptions considered for the study, download the pdf brochure
Market Size Estimation
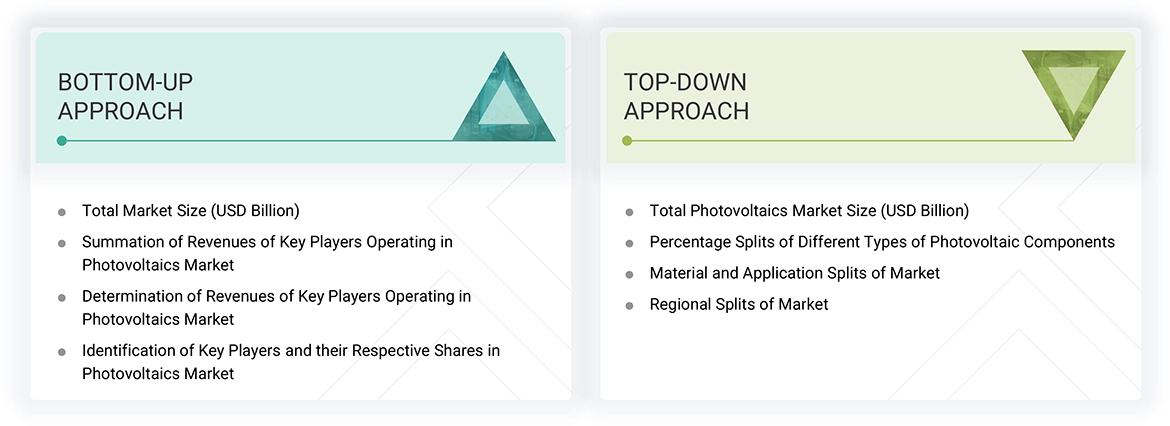
In this report, we have implemented top-down and bottom-up approaches to estimate and validate the size of the photovoltaics market and various other dependent submarkets. Key players in the photovoltaics market have been identified through secondary research, and their market shares in respective regions have been determined through primary and secondary research. This entire research methodology includes the study of annual and financial reports of top companies, as well as interviews with experts (CEOs, VPs, directors, and marketing executives) for key insights (quantitative and qualitative). All percentage shares, splits, and breakdowns have been determined using secondary sources and verified through primary sources. All the possible parameters that affect the market covered in this research study have been accounted for, viewed in detail, verified through primary research, and analyzed to obtain the final quantitative and qualitative data. This data has been consolidated and supplemented with detailed input and analysis from MarketsandMarkets and presented in this report. The figures below show the overall market size estimation process employed for this study.
Bottom-Up Approach
- Identifying key participants in the photovoltaics market that influence the entire market, along with the related component players
- Analyzing major manufacturers of PV components such as modules, inverters, and BOS, studying their portfolios, and understanding their different products
- Analyzing trends pertaining to the use of PV devices for different kinds of applications
- Tracking the ongoing and upcoming developments in the market, such as investments, R&D activities, product launches, collaborations, and partnerships, and forecasting the market based on these developments and other critical parameters
- Carrying multiple discussions with key opinion leaders to understand different types of PV components and applications and recent trends in the market, analyzing the breakup of the scope of work carried out by major companies
- Arriving at the market estimates by analyzing revenues of companies generated and then combining the same to get the market estimate
- Segmenting the overall market into various other market segments
- Verifying and cross-checking the estimate at every level from the discussion with key opinion leaders such as CXOs, directors, and operations managers, and finally with the domain experts in MarketsandMarkets
- Studying various paid and unpaid sources of information such as annual reports, press releases, white papers, and databases
Top-Down Approach
- Focusing initially on the top-line investments and expenditures being made in the ecosystem of the photovoltaics market. Further splitting into component, material, cell type, installation type, and application, and listing key developments in key market areas
- Identifying all major players in the photovoltaic devices market by component and material, and their penetration in various applications through secondary research and verifying with a brief discussion with industry experts
- Analyzing revenues, product mix, geographic presence, and key applications for which photovoltaic systems and components are served by all identified players to estimate and arrive at the percentage splits for all key segments
- Discussing these splits with the industry experts to validate the information and identify key growth pockets across all key segments
- Breaking down the total market based on verified splits and key growth pockets across all segments
- Breaking down the total market based on verified splits and key growth pockets across all segments
Photovoltaics Market : Top-Down and Bottom-Up Approach
Data Triangulation
After arriving at the overall market size through the process explained above, the overall market has been split into several segments. To complete the overall market engineering process and arrive at the exact statistics for all the segments, the data triangulation procedure has been employed wherever applicable. The data has been triangulated by studying various factors and trends from the demand and supply sides. The market has also been validated using the top-down and bottom-up approaches.
Market Definition
According to the Solar Energy Industries Association (SEIA), photovoltaic (PV) devices generate electricity directly from sunlight via an electronic process that occurs naturally in certain types of materials called semiconductors. Electrons in these materials are freed by solar energy and can be induced to travel through an electrical circuit, powering electrical devices or sending electricity to the grid.
Key Stakeholders
- PV cell manufacturers
- PV module manufacturers
- Raw materials and manufacturing equipment suppliers
- PV market technical consultants
- Technology standards organizations, forums, alliances, and associations
- Governments, financial institutions, and investment communities
- Research organizations
- Analysts and strategic business planners
- Venture capitalists, private equity firms, and startup companies
- Distributors
Report Objectives
- To describe, segment, and forecast the photovoltaics market, by component, type, material type, cell type, installation type, and application, in terms of value
- To describe and forecast the photovoltaics market, by component, in terms of volume
- To describe the power capacity ranges and photovoltaic (PV) concentration systems of photovoltaics (PV)
- To describe and forecast the market for four key regions: North America, Europe, Asia Pacific, and RoW, in terms of value
- To provide detailed information regarding drivers, restraints, opportunities, and challenges influencing the growth of the photovoltaics market
- To provide a detailed overview of the supply chain and ecosystem pertaining to the photovoltaics market, along with the average selling price of PV components
- To provide an ecosystem analysis, case study analysis, patent analysis, technology analysis, ASP analysis, Porter’s five forces analysis, 2025 US tariff, AI/Gen AI impact, and regulations pertaining to the market
- To strategically analyze the ecosystem, tariffs and regulations, patent landscape, trade landscape, and case studies pertaining to the market under study
- To strategically analyze micromarkets about individual growth trends, prospects, and contributions to the overall market
- To analyze opportunities in the market for stakeholders and provide a competitive landscape of the market
- To analyze competitive developments such as product launches and developments, expansions, partnerships, collaborations, contracts, and acquisitions in the photovoltaics market
- To strategically profile the key players in the PV market and comprehensively analyze their market ranking and core competencies.
- To evaluate the impact of macroeconomic factors on the regional market
Available customizations:
With the market data given, MarketsandMarkets offers customizations according to the company’s specific needs. The following customization options are available for the report:
Company Information
- Detailed analysis and profiling of additional market players (up to 7)
Get the Full Photovoltaics Market Report
Full forecast, segment splits, and company analysis for all Photovoltaics Market.
- US Photovoltaics Market
- Canada Photovoltaics Market
- Mexico Photovoltaics Market
- UK Photovoltaics Market
- Germany Photovoltaics Market
- France Photovoltaics Market
- Italy Photovoltaics Market
- Spain Photovoltaics Market
- Poland Photovoltaics Market
- China Photovoltaics Market
- Japan Photovoltaics Market
- India Photovoltaics Market
- South Korea Photovoltaics Market
- Australia Photovoltaics Market
- Indonesia Photovoltaics Market
- Malaysia Photovoltaics Market
- Thailand Photovoltaics Market
- Vietnam Photovoltaics Market
Need a Tailored Report?
Customize this report to your needs
Get 10% FREE Customization
Customize This Report
