
Asia Pacific Busbar Market (2025-2030)

The Asia Pacific Busbar Market was valued at $5635.3 Million in 2025 and projected to reach to $10281.7 Million by 2030, representing a compound annual growth rate of 6.2%. The Asia Pacific busbar market is poised for sustained expansion through 2030, with a 6.2% CAGR outpacing the global average of 5.8%.


| Market Size in | USD 26.32 MN |
| Market Forecast in | |
| CAGR | |
| Forecast Period | |
| Units Considered | Value (USD MN) |
Asia Pacific Busbar Market Trends and Insights
- Asia Pacific's busbar market is driven by rapid industrialization, expanding power infrastructure, and increasing demand for efficient electrical distribution systems across the region.
- The 6.2% compound annual growth rate reflects Asia Pacific's strategic importance in global energy transition and manufacturing expansion. Asia Pacific's busbar market benefits from substantial investments in renewable energy integration, smart grid modernization, and data center proliferation.
- Key markets within Asia Pacific, including China, India, and Southeast Asia, are accelerating electrification initiatives and upgrading aging electrical infrastructure.
- Asia Pacific's competitive landscape is characterized by both established global players and emerging regional manufacturers capitalizing on cost advantages and localized supply chains. By 2030, Asia Pacific is expected to solidify its position as a critical growth engine for the global busbar market.
- Asia Pacific's regulatory environment increasingly favors sustainable electrical solutions, while rising urbanization and industrial output continue to fuel demand for advanced busbar systems across commercial, industrial, and utility sectors..
Key Market Statistics
- CAGR (2025-2030) 6.2% CAGR
- Market Size, 2025 ~USD 5635.3 Million
- Forecast, 2030 ~USD 10281.7 Million
- Geography Asia Pacific
Asia Pacific Busbar Market Overview
China's Market Dominance :
China leads the Asia Pacific busbar market with USD 4,744 million in 2025, driven by massive infrastructure investments, manufacturing expansion, and renewable energy integration across the region's largest economy.
Japan's Advanced Technology Adoption :
Japan represents USD 1,922.7 million in market value, leveraging advanced manufacturing capabilities and high-voltage busbar systems for industrial automation and smart grid modernization initiatives.
India's Rapid Industrialization :
India's busbar market valued at USD 1,007.6 million reflects accelerating industrial growth, expanding power distribution networks, and government initiatives to strengthen electrical infrastructure across the nation.
South Korea's Innovation Hub :
South Korea contributes USD 786.5 million to the market, supported by semiconductor manufacturing, electronics production, and investments in next-generation electrical distribution technologies.
Asia Pacific Busbar Market Dynamics
- Rapid industrialization across emerging economies, coupled with massive infrastructure development projects and renewable energy integration, will drive demand for efficient electrical distribution systems.
- China's manufacturing dominance and India's industrial growth will remain primary growth catalysts. Key growth drivers include increasing urbanization, smart grid implementations, and rising electricity consumption across the region.
- Investment in power generation capacity, transmission networks, and industrial facilities will create substantial opportunities for busbar manufacturers.
- Additionally, the shift toward sustainable energy solutions and modernization of aging electrical infrastructure will further accelerate market penetration and revenue growth through 2030..
Market Ecosystem
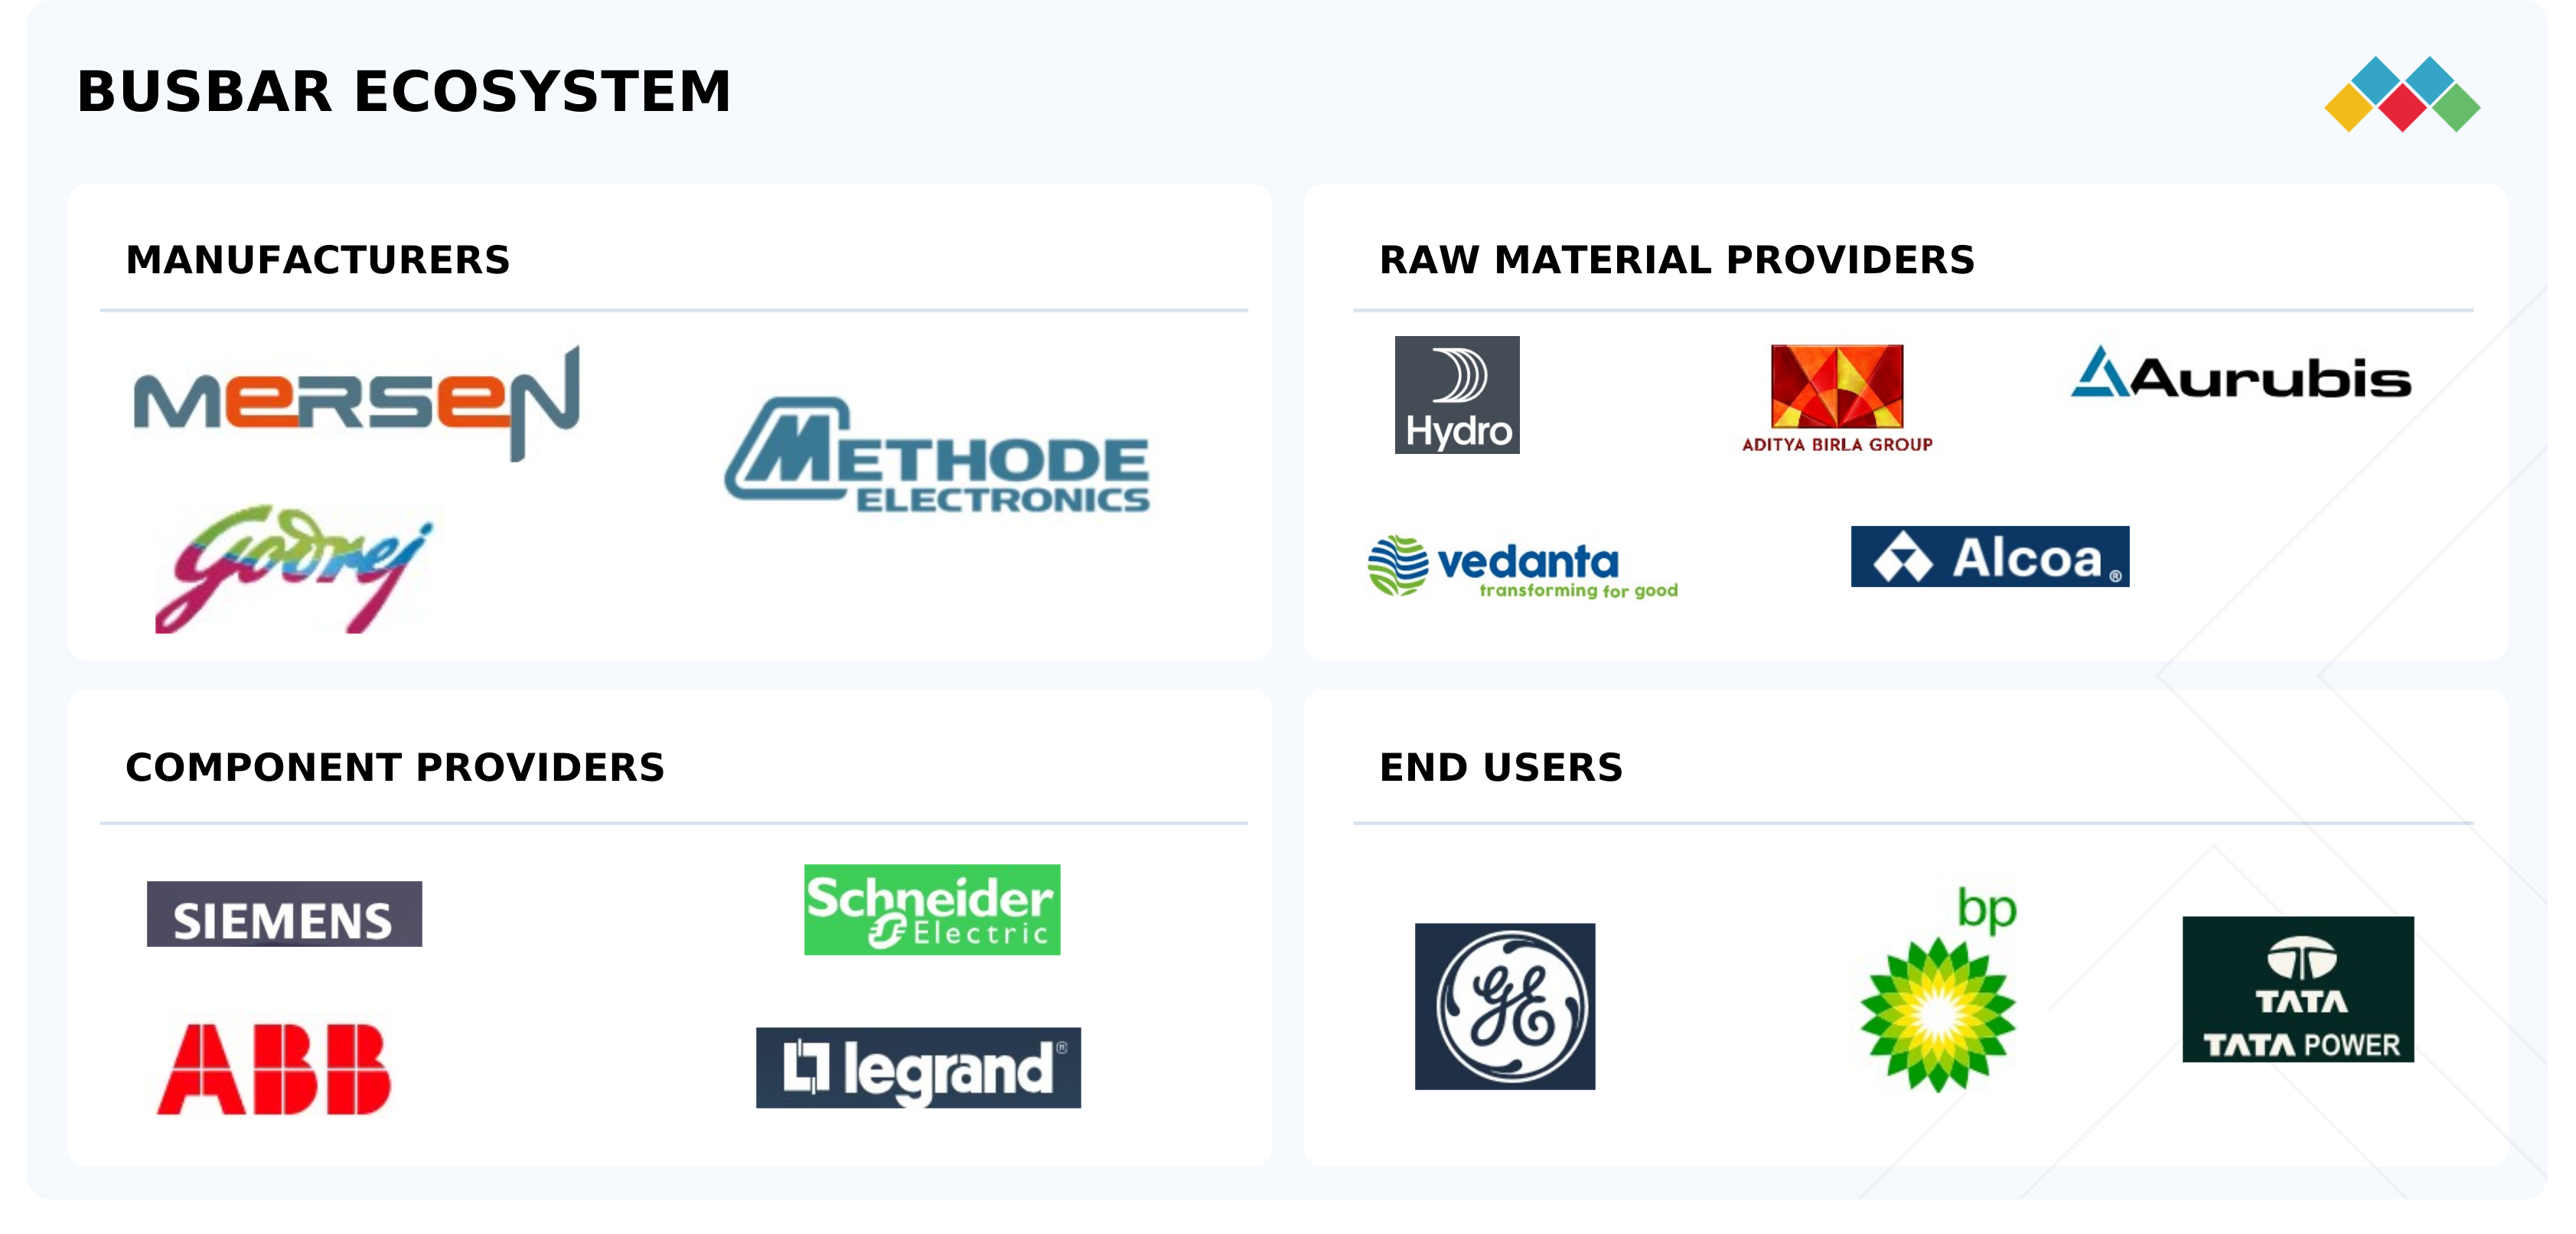
busbar market: COMMERCIAL USE CASES ACROSS INDUSTRIES
| COMPANY | USE CASE DESCRIPTION | BENEFITS |
|---|---|---|
 |
Deploys Armor Clad Busway systems in industrial plants and commercial facilities to distribute electricity effectively, connecting to transformers, panelboards, and switchgear for high-demand applications | Enhanced safety through protection against physical damage and electrical faults |
 |
Implements busbar systems in power generation and oil & gas facilities to ensure reliable power distribution to equipment and machinery across refineries and production sites | Improved reliability of power supply|Reduced energy losses|Lower operational costs |
 |
Installs busbar systems in compact and vertical substations integrated within high-rise buildings and urban networks to supply electricity efficiently in space-constrained areas | Increased grid resilience |Efficient renewable energy integration|Decreased utility costs |
Logos and trademarks shown above are the property of their respective owners. Their use here is for informational and illustrative purposes only.
Related Ecosystem
Key Takeaways
- Asia Pacific's busbar market will nearly double from USD 5,635.3 million in 2025 to USD 10,281.7 million by 2030, growing at a 6.2% CAGR.
- Asia Pacific's rapid industrialization and renewable energy investments are primary catalysts driving busbar demand across the region.
- Asia Pacific's emerging markets, particularly China and India, represent the largest growth opportunities for busbar manufacturers through 2030.
- Asia Pacific's focus on smart grid infrastructure and electrification initiatives positions the region as a critical market for advanced busbar solutions.
Busbar Market Report Scope
| Report Metric | Details |
|---|---|
| Base Year | 2025 |
| Fastest Growing Segment | LAMINATED (Insulation) |
| Forecast Period | 2025–2030 |
| Growth Rate | CAGR of 5.8% from 2025 to 2030 |
| Largest Segment | BARE (Insulation) |
| Market Size Base Year (Billions) | ~USD 15.77 (2025) |
| Revenue Forecast (Billions) | ~USD 20.9 (2030) |
| Segments Covered | Material, Power Rating, Insulation, Manufacturing Process, End-Use Application |
Asia Pacific Busbar Market Report Segmentation
5 segment dimensions are covered across the global market.
By Material
- Aluminum
- Copper
By Power Rating
- High
- Low
- Medium
By Insulation
- Bare
- Laminated
- Powder-Coated
By Manufacturing Process
- Flexible
- Hybrid
- Molded
- Stamped
By End-Use Application
- Automotive
- Commercial & Residential
- Data Centers
- Industrial
- Locomotive
- Renewables
- Residential & Commercial
- Utilities
Target Audience
- Busbar Manufacturers : Manufacturers need Asia Pacific market intelligence to identify growth markets, optimize production capacity, and develop region-specific product strategies aligned with local industrial demands.
- Power & Utility Companies : Utilities require detailed market data to plan infrastructure investments, evaluate busbar technology upgrades, and assess supply chain opportunities across Asia Pacific's expanding power networks.
- Electrical Equipment Distributors : Distributors need regional market insights to optimize inventory management, identify emerging demand centers, and develop targeted sales strategies for Asia Pacific territories.
- Investment & Private Equity Firms : Investors require comprehensive market analysis to evaluate acquisition targets, assess growth potential, and make strategic investment decisions in Asia Pacific busbar and electrical infrastructure sectors.
- Industrial & Infrastructure Developers : Developers need market forecasts to plan electrical system specifications, evaluate supplier options, and ensure cost-effective busbar solutions for large-scale industrial and infrastructure projects.
Key Companies in the Asia Pacific Busbar Market
| Company | HQ | Ownership | Strongest segments |
|---|---|---|---|
| PENTAIR PLC | United Kingdom | Public Company | Pool,Flow,Water Solutions, |
| GODREJ GROUP | India | Private Company | Home appliances (refrigerators, washing machines, ACs, microwaves, coolers, disinfecting appliances),Commercial appliances and cooling (medical refrigerators, deep freezers, vending, personal cooling),Locks, architectural hardware, kitchen fittings, home and institutional security, |
| ABB | Switzerland | Public Company | Electrification,Motion,Automation, |
| EATON | Ireland | Public Company | Electrical components, power distribution and assemblies,Power quality, connectivity, and circuit protection,Hazardous duty, emergency lighting, fire detection, structural support, |
| ROGERS CORPORATION | Canada | Public Company | Wireless services & devices,Cable & broadband (internet, TV, telephony),Media, sports & financial services, |
| LITTELFUSE, INC. | United States | Public Company | Electronics (fuses, TVS, Si/SiC MOSFETs, IGBTs, sensing),Transportation (fuses, power distribution modules, sensors),Industrial (fuses, relays, contactors, protection devices), |
| TE CONNECTIVITY | Ireland | Public Company | Transportation Solutions (automotive, e-mobility, commercial and industrial vehicles, autosport, rail),Industrial Solutions (automation, aerospace and defense, energy, intelligent buildings, medical, rail, oil and gas/marine),Data and Devices (5G, wireless, data centers, IoT connectivity, personal electronics, connected home), |
| SALZER | India | Public Company | Industrial components (switches, ducts, relays, control panels, plugs/sockets),Motor control and protection (contactors, MPCB, MCB, CTs, coils, transformers, EV chargers),Residential and building electricals (MCB, DBs, modular and smart switches, sensors, house wires), |
PENTAIR PLC
Pentair PLC is a United Kingdom-based public company founded in 1966 with approximately 9,000 employees. The company operates as an established industrial enterprise with a significant global workforce.
GODREJ GROUP
Godrej Group is an Indian private company founded in 1897 with 13,316 employees. The company represents a major industrial conglomerate with over a century of business operations.
ABB
ABB is a Swiss public company founded in 1883 with 111,900 employees. As a large multinational enterprise, ABB operates across multiple industrial sectors with a substantial global workforce.
EATON
Eaton is an Irish-registered public company founded in 1911 with 97,303 employees. The company operates as a major multinational industrial enterprise with extensive global operations.
ROGERS CORPORATION
Rogers Corporation is a Canadian public company founded in 1960 with 25,000 employees. The company operates as a significant industrial enterprise with a substantial workforce.
LITTELFUSE, INC.
Littelfuse, Inc. is a United States-based public company founded in 1927 with 17,000 employees. The company operates as an established industrial manufacturer with a considerable global workforce.
TE CONNECTIVITY
TE Connectivity is an Ireland-registered public company founded in 1941 with 80,000 employees. The company operates as a major multinational enterprise with extensive global operations.
SALZER
Salzer is an Indian public company founded in 1985 with 924 employees. The company operates as a mid-sized industrial enterprise with regional market presence.
Countries within Asia Pacific - compare and drill down
| Country | 2025 size (native) |
|---|---|
| China | USD 4744 Million |
| India | USD 1007.6 Million |
| Japan | USD 1922.7 Million |
| South Korea | USD 786.5 Million |
| Rest Of Asia Pacific | USD 1820.9 Million |
Country market size visualization
Reasons to Buy this Report
- Regional Market Segmentation : Gain detailed insights into individual Asia Pacific country markets including China, India, Japan, and South Korea with specific market sizing and growth trajectories tailored to regional dynamics.
- Growth Opportunity Identification : Identify high-growth segments and emerging markets within Asia Pacific where the 6.2% CAGR presents lucrative expansion opportunities for manufacturers and distributors through 2030.
- Competitive Landscape Analysis : Understand regional competitive dynamics, market consolidation trends, and strategic positioning of key players across Asia Pacific's diverse busbar market segments.
- Investment Decision Support : Make informed capital allocation decisions with comprehensive market forecasts, risk assessments, and opportunity mapping specific to Asia Pacific's industrial and power sectors.
- Strategic Market Entry Planning : Develop targeted market entry strategies with country-specific insights, regulatory considerations, and demand drivers essential for successful expansion in Asia Pacific regions.
Frequently asked questions
What is the projected size of the Asia Pacific busbar market by 2030?
Asia Pacific's busbar market is projected to reach USD 10,281.7 million by 2030, up from USD 5,635.3 million in 2025.
What is the CAGR for Asia Pacific's busbar market?
Asia Pacific's busbar market is expected to grow at a compound annual growth rate of 6.2% between 2025 and 2030.
Which countries drive growth in Asia Pacific's busbar market?
China, India, and Southeast Asian nations are the primary growth drivers in Asia Pacific's busbar market due to industrialization and infrastructure expansion.
What factors are accelerating demand in Asia Pacific's busbar market?
Asia Pacific's busbar market is accelerated by renewable energy integration, smart grid modernization, data center expansion, and electrification initiatives.
How does Asia Pacific's busbar market compare to global growth?
Asia Pacific's busbar market CAGR of 6.2% exceeds the global CAGR of 5.8%, reflecting the region's strategic importance in the energy sector.
RESEARCH METHODOLOGY
The study involved major activities in estimating the current size of the busbar market. Exhaustive secondary research was done to collect information on the peer and parent markets. The next step was to validate these findings, assumptions, and sizing with industry experts across the value chain through primary research. Both top-down and bottom-up approaches were employed to estimate the complete market size. Thereafter, market breakdown and data triangulation were used to estimate the market size of the segments and subsegments.
Secondary Research
This research study on the busbar market involved the use of extensive secondary sources, directories, and databases, such as Hoovers, Bloomberg, Businessweek, Factiva, International Energy Agency, and BP Statistical Review of World Energy, to identify and collect valuable information for a technical, market-oriented, and commercial study of the global busbar market. The other secondary sources included annual reports, press releases, and investor presentations of companies, white papers, certified publications, articles by recognized authors, manufacturer associations, trade directories, and databases.
Primary Research
The busbar market comprises stakeholders, including busbar manufacturers, technology providers, and support providers, throughout the supply chain. On the demand side, the market is driven by growing adoption of busbar systems in various sectors, including data centers, renewable energy, industrial, and commercial applications, due to their high energy efficiency, compact design, and superior performance compared to conventional power distribution systems. Rising infrastructure development and urbanization in emerging economies further fuel demand for busbar solutions. On the supply side, manufacturers are witnessing increasing opportunities through contracts from utility and industrial distribution networks, as well as strategic initiatives, such as mergers, acquisitions, and partnerships, by market players to expand their footprint and enhance technological capabilities. Various primary sources from both the supply and demand sides of the market were interviewed to obtain qualitative and quantitative information. The following is the breakdown of primary respondents:
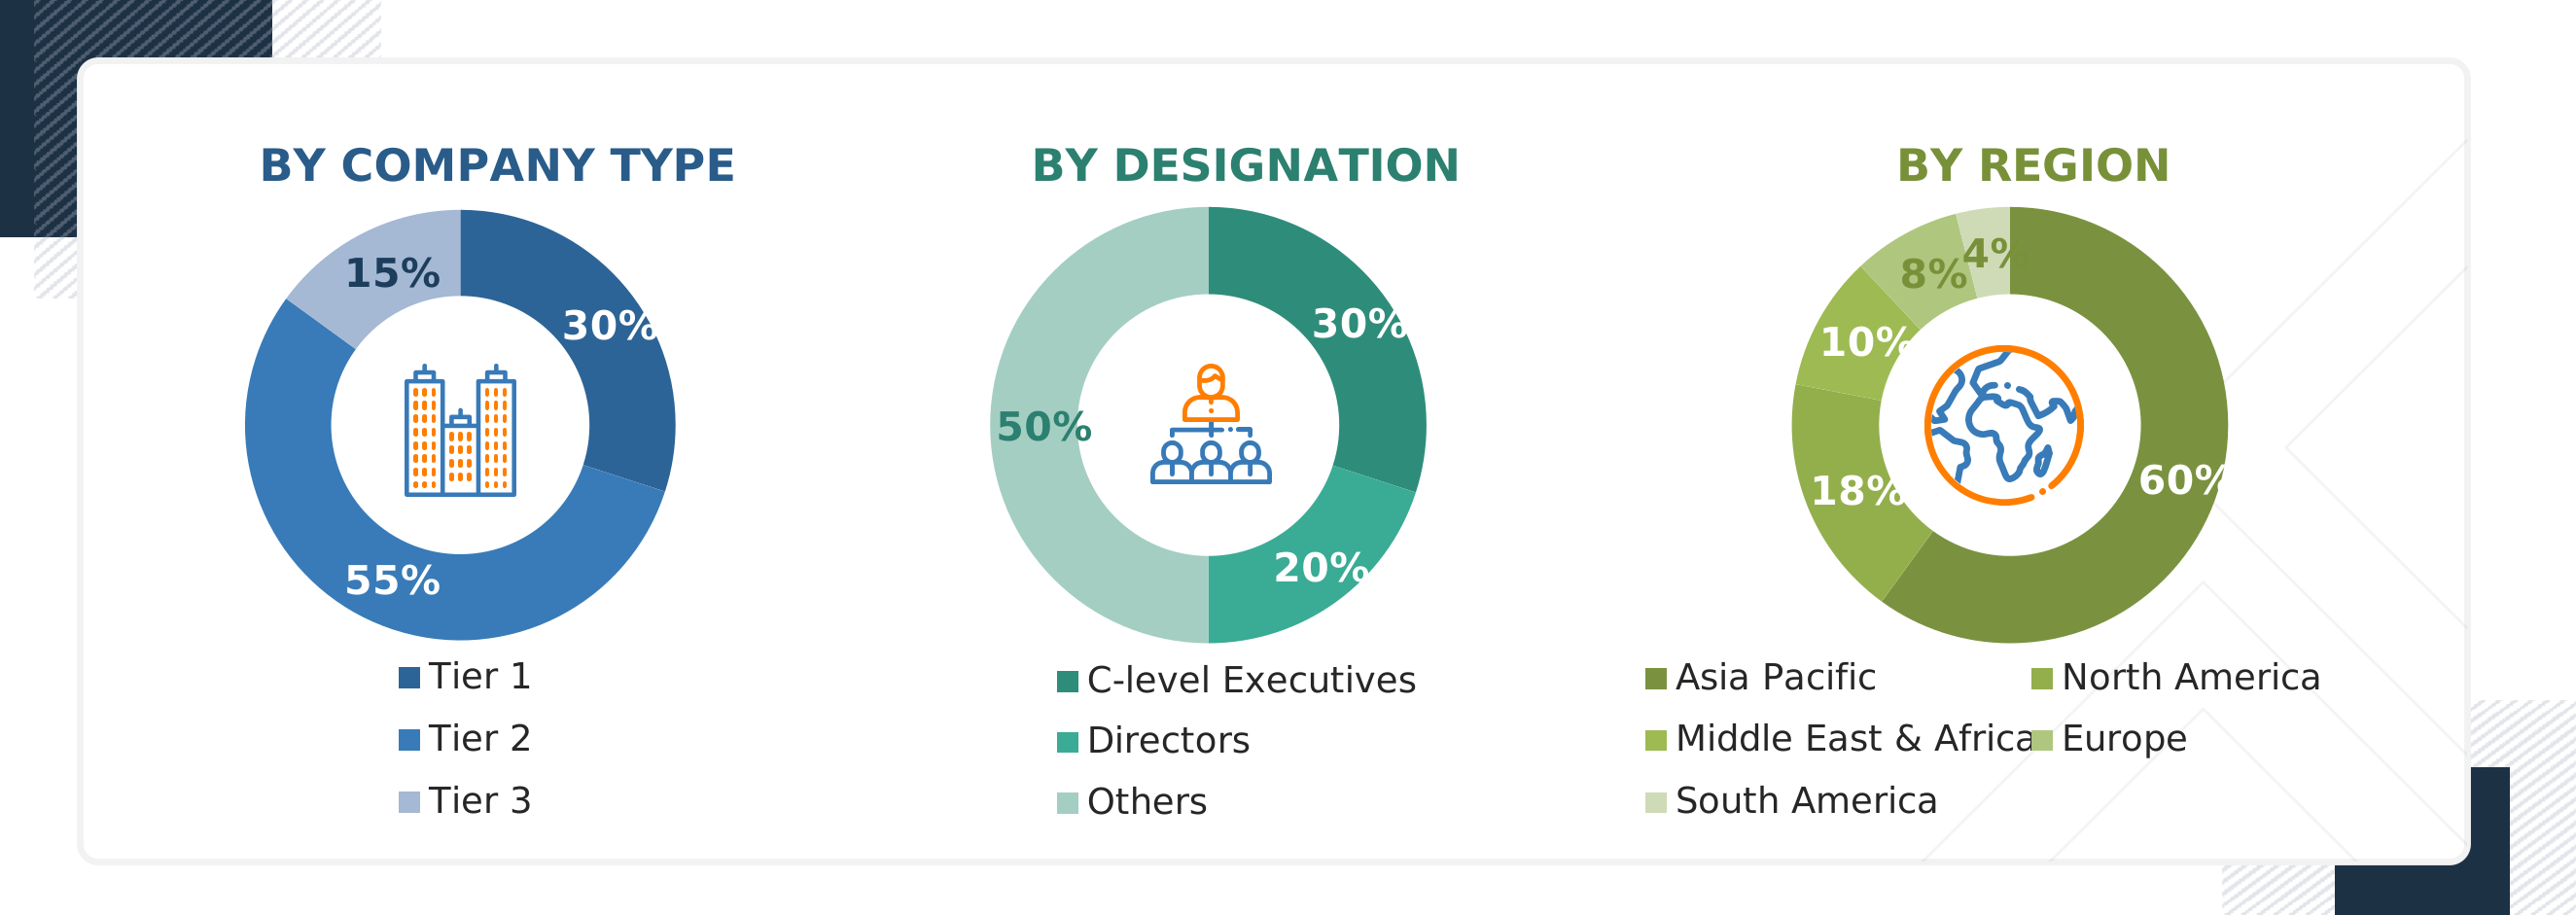
Note: “Others” include sales managers, engineers, and regional managers.
The tiers of the companies are defined based on their total revenue as of 2024: Tier 1: >USD 1 billion, Tier 2: USD 500 million–1 billion,
and Tier 3:
To know about the assumptions considered for the study, download the pdf brochure
Market Size Estimation
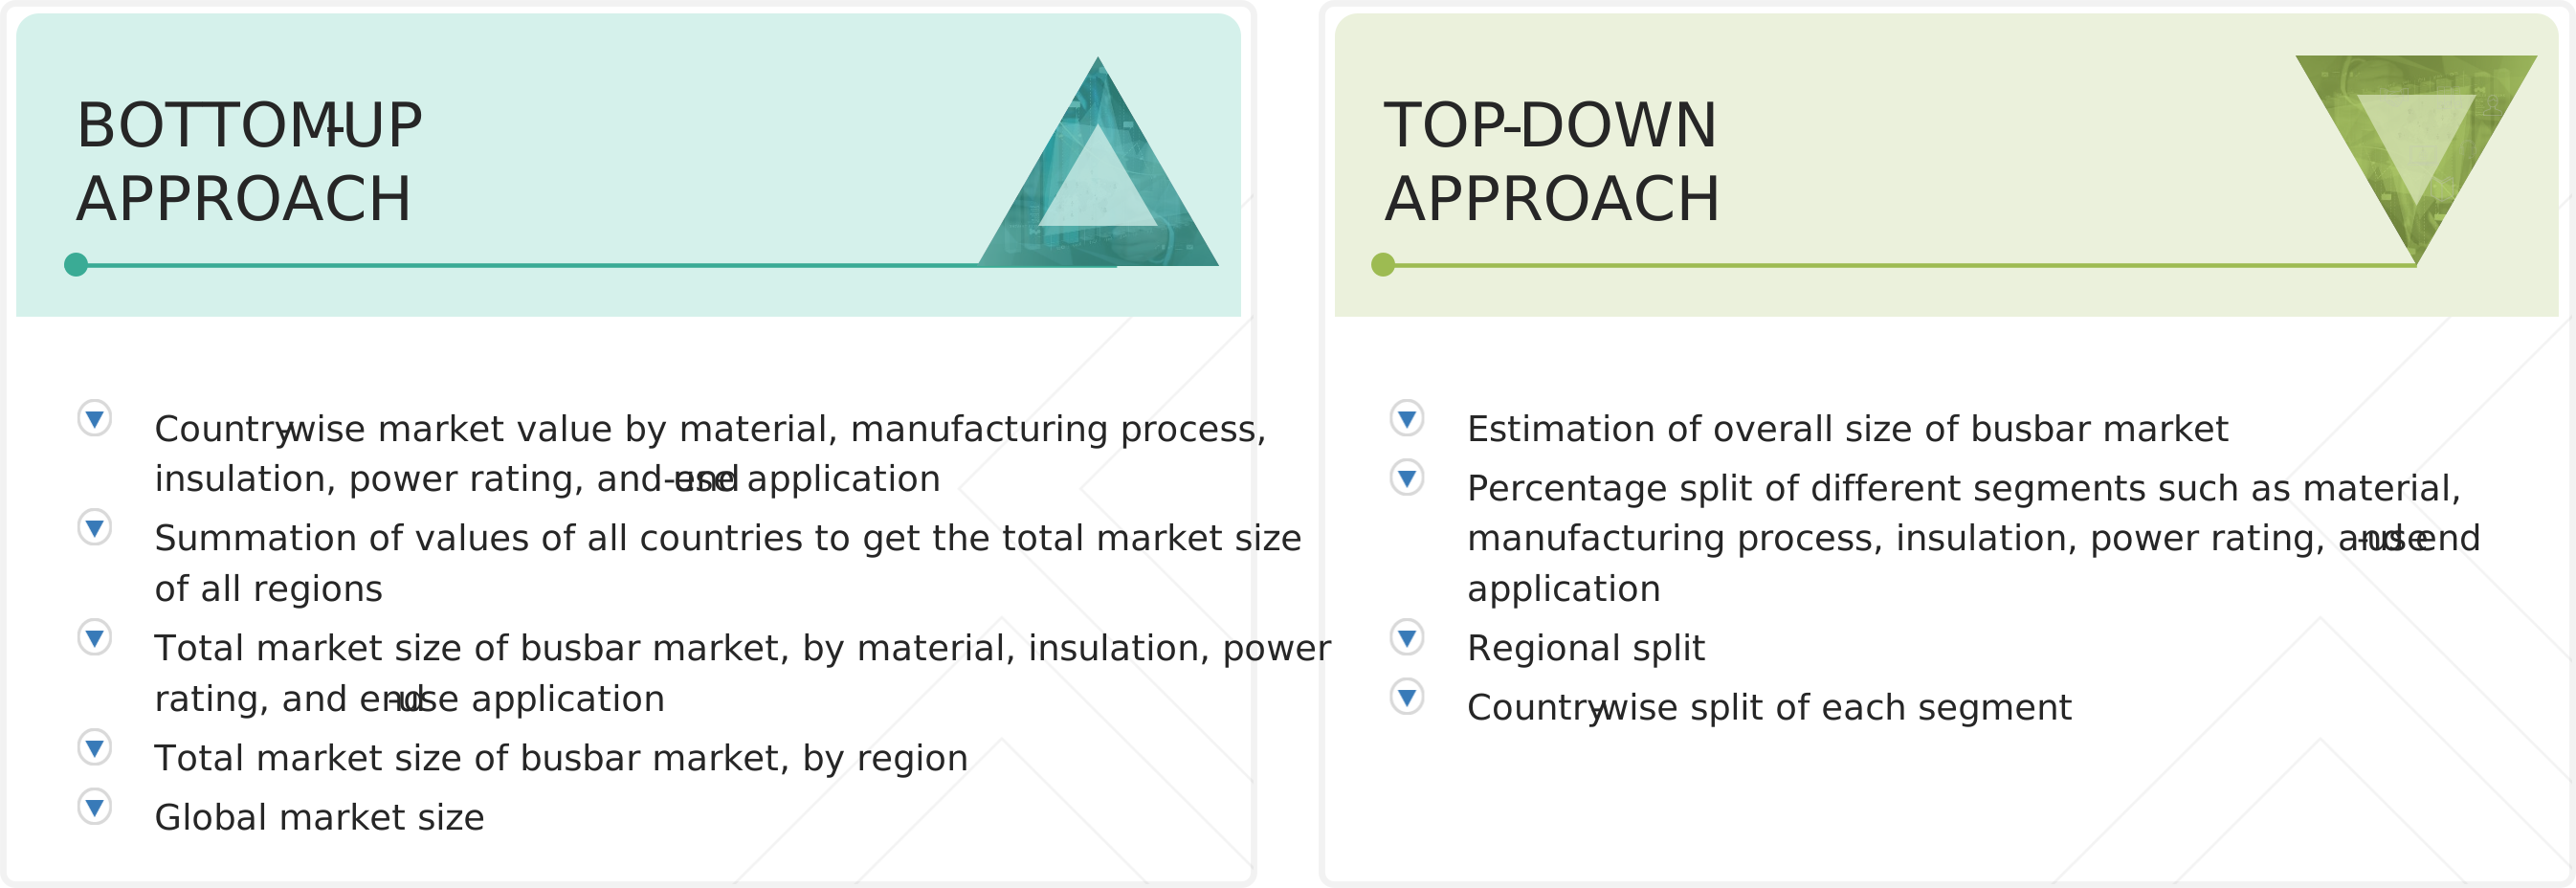
Both the top-down and bottom-up approaches were used to estimate and validate the size of the busbar market and its dependent submarkets. The key players in the market were identified through secondary research, and their market share in the respective regions was determined through a combination of primary and secondary research. The research methodology involves analyzing the annual and financial reports of top market players and conducting interviews with industry experts, including chief executive officers, vice presidents, directors, sales managers, and marketing executives, to gather key quantitative and qualitative insights related to the busbar market.
Busbar Market : Top-Down and Bottom-Up Approach
Data Triangulation
After determining the overall market size through the estimation process explained above, the total market was divided into several segments and subsegments. To complete the overall market engineering process and obtain the exact statistics for all segments and subsegments, the data triangulation and market breakdown processes were employed, as applicable. The data was triangulated by studying various factors and trends from both the demand and supply sides. Additionally, the market size was validated using both top-down and bottom-up approaches.
Market Definition
A busbar is an electrical element that simplifies complex power distributions, making them more affordable and flexible. It is a metallic strip or bar, typically housed inside switchgear, panel boards, and busway enclosures for local high-current power distribution. The bus bar system consists of an isolator and a circuit breaker. It allows new circuits to branch off anywhere along the busway route, rather than branching the main supply at a single location. A busbar is an electrical junction that collects electric power from incoming feeders and distributes it to the outgoing feeders. The primary purpose of a busbar is to carry electricity and distribute it. It is used to make the systems more efficient. They can be an excellent solution for complicated electrical systems.
Stakeholders
- Government & research organizations
- Institutional investors
- Investors/Shareholders
- Environmental research institutes
- Manufacturers’ associations
- Busbar manufacturers, dealers, and suppliers
- Organizations, forums, alliances, and associations
- Renewable power generation and equipment manufacturing companies
- Public & private power generation, transmission & distribution companies (utilities)
- Substation equipment manufacturing companies
- Smart grid project developers
- Switchgear and power cable manufacturing companies
- State and national regulatory authorities
- Venture capital firms
Report Objectives
- To describe and forecast the busbar market, by material, power rating, insulation, manufacturing process, end-use application, and region, in terms of value
- To describe and forecast the busbar market for various segments with respect to five main regions: North America, Europe, Asia Pacific, South America, and the Middle East & Africa, in terms of value
- To describe and forecast the busbar market, by region, in terms of volume
- To provide detailed information regarding drivers, restraints, opportunities, and challenges influencing the growth of the market
- To provide a detailed overview of the busbar supply chain analysis, use case analysis, key stakeholders and buying criteria, patent analysis, trade analysis, tariff analysis, regulations, macroeconomic outlook, pricing analysis, Porter’s five forces analysis, impact of gen AI/AI, and the 2024 US tariff impact
- To strategically analyze micromarkets1 with respect to individual growth trends, prospects, and contributions to the total market
- To analyze opportunities in the market for various stakeholders by identifying high-growth segments
- To strategically profile key players and comprehensively analyze their market position in terms of ranking and core competencies1, along with detailing the market’s competitive landscape.
- To analyze growth strategies, such as acquisitions, investments, expansions, and product launches, adopted by market players in the busbar market
1 Micromarkets are defined as the segments and subsegments of the busbar market included in the report.
2 Core competencies of companies are defined in terms of key developments and strategies adopted to sustain their positions in the busbar market.
Available Customizations
MarketsandMarkets offers customizations tailored to the specific needs of companies, utilizing the provided market data.
The following customization options are available for the report:
Product Analysis
- Product matrix, which gives a detailed comparison of the product portfolio of each company
Geographic Analysis as per Feasibility
- Further breakdown of the busbar market, by country
Company Information
- Detailed analysis and profiling of additional market players (up to five)
Get the Full Busbar Market Report
Full forecast, segment splits, and company analysis for all Busbar Market.
- China Busbar Market
- India Busbar Market
- Japan Busbar Market
- South Korea Busbar Market
- Germany Busbar Market
- UK Busbar Market
- Italy Busbar Market
- France Busbar Market
- Canada Busbar Market
- Mexico Busbar Market
- US Busbar Market
- Saudi Arabia Busbar Market
- UAE Busbar Market
- Qatar Busbar Market
- South Africa Busbar Market
- Brazil Busbar Market
- Argentina Busbar Market
- Rest Of Europe Busbar Market
- Rest Of Asia Pacific Busbar Market
- GCC Busbar Market
- Rest Of GCC Busbar Market
Need a Tailored Report?
Customize this report to your needs
Get 10% FREE Customization
Customize This Report
