
Asia Pacific Playout Automation & Channel-in-a-Box Market (2023-2028)

The Asia Pacific Playout Automation & Channel-in-a-Box Market was valued at $690.3 Million in 2023 and projected to reach to $1546.3 Million by 2028, representing a compound annual growth rate of CAGR 17.5%. Asia Pacific's playout automation and channel-in-a-box market is positioned for exceptional growth through 2028, driven by rapid digitalization of broadcasting infrastructure and increasing investment in media technology across the region.


| Market Size in | USD 26.32 MN |
| Market Forecast in | |
| CAGR | |
| Forecast Period | |
| Units Considered | Value (USD MN) |
Asia Pacific Playout Automation & Channel-in-a-Box Market Trends and Insights
- Asia Pacific is experiencing rapid digital transformation across broadcasting and media sectors, driven by increasing demand for cost-efficient content delivery and multi-platform distribution capabilities.
- The region's market is forecast to nearly double, reaching $1,546.3 million by 2028, reflecting a compound annual growth rate of 17.5%-outpacing global trends. Asia Pacific's growth trajectory is underpinned by rising adoption of cloud-based playout solutions, proliferation of OTT platforms, and modernization of legacy broadcast infrastructure across emerging economies.
- Asia Pacific broadcasters are increasingly investing in automation to reduce operational costs and enhance content agility in competitive markets.
- The region's expanding middle class, coupled with growing internet penetration and smartphone adoption, creates sustained demand for diverse content channels that automation technologies enable. Asia Pacific's competitive landscape features both established vendors and regional innovators addressing localized requirements for language support, compliance, and scalability.
- Asia Pacific's market maturity varies significantly by subregion, with developed markets like Australia and Japan leading adoption, while Southeast Asia and South Asia present high-growth opportunities for vendors offering flexible, affordable solutions..
Key Market Statistics
- CAGR (2023-2028) CAGR 17.5%
- Market Size, 2023 ~USD 690.3 Million
- Forecast, 2028 ~USD 1546.3 Million
- Geography Asia Pacific
Asia Pacific Playout Automation & Channel-in-a-Box Market Overview
Rapid Market Expansion :
Asia Pacific's playout automation and channel-in-a-box market reached $690.3 million in 2023 and is projected to grow to $1,546.3 million by 2028, representing a robust 17.5% CAGR—outpacing the global average of 15.8%.
Digital Transformation Leadership :
The region is experiencing accelerating digital transformation across broadcasting and media sectors, with broadcasters increasingly adopting automation solutions to streamline operations and reduce infrastructure costs.
Multi-Platform Distribution Demand :
Growing demand for cost-efficient content delivery and multi-platform distribution capabilities is driving adoption of channel-in-a-box solutions among Asia Pacific media companies seeking competitive advantages.
Key Market Contributors :
China ($386.6M), Japan ($340.2M), India ($262.9M), and South Korea ($247.4M) are the primary growth drivers, collectively representing over 70% of the Asia Pacific market value.
Asia Pacific Playout Automation & Channel-in-a-Box Market Dynamics
- Broadcasters are prioritizing cost-effective solutions that enable multi-channel operations with minimal staffing, making automation platforms increasingly essential for competitive positioning. The region's expanding middle class, rising internet penetration, and proliferation of streaming platforms are creating sustained demand for efficient content delivery systems.
- Government initiatives supporting digital infrastructure development and the emergence of new broadcasting standards further accelerate market adoption.
- Asia Pacific's growth trajectory significantly exceeds global benchmarks, reflecting the region's strategic importance in the global media technology landscape..
Market Ecosystem
Related Ecosystem
Software And Services
- Natural Language Processing (NLP)
- Machine Learning
- Supply Chain Management
- Predictive Analytics
- Image Sensors
- International Business Machines Corporation
- MICROSOFT CORPORATION
- Oracle Corporation
- SAP SE
- Amazon.com, Inc.
Mobility And Telecom
- Smart Utilities
- Smart Healthcare
- Sensors
- Parking Management System
- Passenger Information System (PIS)
- AT&T Inc.
- Cisco Systems, Inc.
- HUAWEI TECHNOLOGIES CO LTD
- Telefonaktiebolaget LM Ericsson (publ)
- International Business Machines Corporation
Digitalization And Iot
- Sensors
- Remote Monitoring
- Supply Chain Management
- Passenger Information System (PIS)
- Platform as A Service (PaaS)
- International Business Machines Corporation
- Cisco Systems, Inc.
- MICROSOFT CORPORATION
- Oracle Corporation
- HUAWEI TECHNOLOGIES CO LTD
Key Takeaways
- Asia Pacific playout automation market valued at $690.3M in 2023, projected to reach $1,546.3M by 2028 at 17.5% CAGR.
- Asia Pacific's growth outpaces global average, driven by cloud adoption, OTT expansion, and broadcast infrastructure modernization.
- Asia Pacific exhibits diverse maturity levels, with developed markets leading and Southeast/South Asia offering high-growth opportunities.
- Asia Pacific broadcasters prioritize automation for cost reduction, operational efficiency, and multi-platform content distribution capabilities.
Playout Automation & Channel-in-a-Box Market Report Scope
| Report Metric | Details |
|---|---|
| Base Year | 2023 |
| Fastest Growing Segment | REMOTE PLAYOUT SOFTWARE (Solution) |
| Forecast Period | 2023-2028 |
| Growth Rate | CAGR of 15.8% from 2023 to 2028 |
| Largest Segment | OVER-THE-TOP (OTT) (Delivery Channel) |
| Market Size Base Year (Billions) | ~USD 2.93 (2023) |
| Revenue Forecast (Billions) | ~USD 6.1 (2028) |
| Segments Covered | Offering, Solution, Deployment Mode, Channel Type, Coverage Area, Channel Application, Vertical, Service, Component, Application, Content Type, Delivery Channel, Monetization Model |
Asia Pacific Playout Automation & Channel-in-a-Box Market Report Segmentation
13 segment dimensions are covered across the global market.
By Offering
- Services
- Solutions
By Solution
- Ad-Insertion Software
- Graphics & Branding Solutions
- Graphics And Branding Solutions
- Graphics Playout Software
- Master Control Automation Software
- Media Asset & Content Management
- Monitoring & Control Systems
- Monitoring And Control Systems
- Network Management Software
- Other Solutions
- Playout Scheduling & Management
- Playout Scheduling And Management
- Remote Playout Software
- Traffic & Scheduling Software
- Traffic And Scheduling Software
By Deployment Mode
- Cloud
- On-Premises
By Channel Type
- Multiple Channel
- Multiple Channels
- Other Channels
- Single Channel
By Coverage Area
- International Broadcasters
- National Broadcasters
By Channel Application
- Broadcast Tv Channels
- Cable & Satellite Tv Channels
- Cable And Satellite Tv Channels
- News Production
- Other Applications
- Ott
- Ott Platforms
- Sports
- Web Tv & Streaming Services
- Web Tv And Streaming Services
By Vertical
- Academia & Education
- Banking, Financial Services, And Insurance (Bfsi)
- Bfsi
- Education
- Education & Corporate
- Education & Corporate Sector
- Education And Corporate Sector
- Government
- Government & Defense
- Healthcare
- Healthcare & Life Sciences
- It & Telecommunications
- Manufacturing
- Media & Entertainment
- Media And Entertainment
- Other Verticals
- Retail & Consumer Goods
- Telecommunications
By Service
- Consulting & Advisory Services
- Installation & Deployment Services
- Migration & Upgrades
- Support & Maintenance Services
- Training & Education Services
By Component
- Hardware
- Platform
- Services
- Solutions
By Application
- Content Rendering
- Dynamic Ad Insertion
- Other Applications
- Video Hosting
- Video Transcoding & Processing
- Video Upload & Ingestion
By Content Type
- On-Demand
- Real-Time/Live
By Delivery Channel
- Internet Protocol Tv (Iptv)
- Over-The-Top (Ott)
- Pay-Tv
By Monetization Model
- Advertising-Based
- Subscription-Based
- Transaction-Based
Target Audience
- Broadcast Equipment Manufacturers : Need detailed Asia Pacific market segmentation and growth forecasts to develop region-specific product roadmaps, identify emerging opportunities in high-growth countries, and optimize manufacturing and distribution strategies.
- Media & Broadcasting Companies : Require competitive intelligence on automation adoption trends across Asia Pacific to benchmark operations, evaluate technology investments, and understand regional best practices for cost optimization.
- Software & Technology Vendors : Seek market sizing data and growth projections for Asia Pacific to guide R&D investments, prioritize market entry strategies, and develop localized solutions addressing regional broadcaster needs.
- Investment & Private Equity Firms : Need comprehensive market analysis of Asia Pacific's high-growth playout automation sector to identify acquisition targets, assess portfolio company positioning, and evaluate investment opportunities.
- Consulting & Systems Integration Partners : Require regional market insights and country-level data to advise clients on technology adoption strategies, competitive positioning, and digital transformation initiatives in Asia Pacific broadcasting.
Countries within Asia Pacific - compare and drill down
| Country | 2025 size (native) |
|---|---|
| China | USD 386.6 Million |
| Japan | USD 340.2 Million |
| India | USD 262.9 Million |
| South Korea | USD 247.4 Million |
| ANZ | USD 170.1 Million |
| Rest Of Asia Pacific | USD 139.2 Million |
Country market size visualization
Reasons to Buy this Report
- Regional Market Sizing & Forecasts : Obtain precise market valuations for Asia Pacific ($690.3M in 2023) and country-level breakdowns including China, Japan, India, and South Korea, with detailed 2028 projections to support strategic planning.
- Competitive Growth Intelligence : Understand Asia Pacific's 17.5% CAGR advantage over the global 15.8% benchmark, identifying which sub-regions and countries offer the highest growth opportunities for market entry and expansion.
- Digital Transformation Insights : Access analysis of how rapid digitalization across Asia Pacific broadcasting sectors is reshaping playout automation adoption, enabling informed product development and go-to-market strategies.
- Multi-Platform Distribution Trends : Gain actionable intelligence on the region's shift toward cost-efficient, multi-platform content delivery, helping vendors align solutions with evolving broadcaster requirements and market demands.
- Country-Specific Market Data : Leverage granular market data across major Asia Pacific economies to identify high-potential markets, assess competitive landscapes, and prioritize resource allocation for maximum ROI.
Frequently asked questions
What is the current market size of playout automation in Asia Pacific?
Asia Pacific's playout automation and channel-in-a-box market was valued at $690.3 million in 2023 and is forecast to grow to $1,546.3 million by 2028.
What is the growth rate for Asia Pacific playout automation market?
Asia Pacific's playout automation market is expected to grow at a compound annual growth rate (CAGR) of 17.5% from 2023 to 2028.
Which factors are driving growth in Asia Pacific's playout automation market?
Key drivers in Asia Pacific include cloud-based solution adoption, OTT platform proliferation, broadcast infrastructure modernization, cost reduction pressures, and rising demand for multi-platform content distribution.
How does Asia Pacific's market growth compare to global trends?
Asia Pacific's 17.5% CAGR outpaces the global market CAGR of 15.8%, indicating the region is a high-growth priority for playout automation vendors.
What regional variations exist within Asia Pacific's playout automation market?
Asia Pacific shows significant variation, with developed markets like Australia and Japan leading adoption, while Southeast Asia and South Asia represent emerging high-growth opportunities with demand for affordable, flexible solutions.
RESEARCH METHODOLOGY
The playout automation & channel-in-a-box market research study involved extensive secondary sources, directories, journals, and paid databases. Primary sources were mainly industry experts from the core and related industries, preferred playout automation & channel-in-a-box providers, third-party service providers, consulting service providers, end users, and other commercial enterprises. In-depth interviews were conducted with various primary respondents, including key industry participants and subject matter experts, to obtain and verify critical qualitative and quantitative information, and assess the market’s prospects.
Secondary Research
In the secondary research process, various sources were referred to, for identifying and collecting information for this study. Secondary sources included annual reports, press releases, and investor presentations of companies; white papers, journals, and certified publications; and articles from recognized authors, directories, and databases. The data was also collected from other secondary sources, such as journals, government websites, blogs, and vendors' websites. Additionally, playout automation & channel-in-a-box spending of various countries were extracted from the respective sources. Secondary research was mainly used to obtain key information related to the industry’s value chain and supply chain to identify key players based on solutions, services, market classification, and segmentation according to offerings of major players, industry trends related to solutions, services, deployment modes, approach, business function, application, vertical, and regions, and key developments from both market- and technology-oriented perspectives.
Primary Research
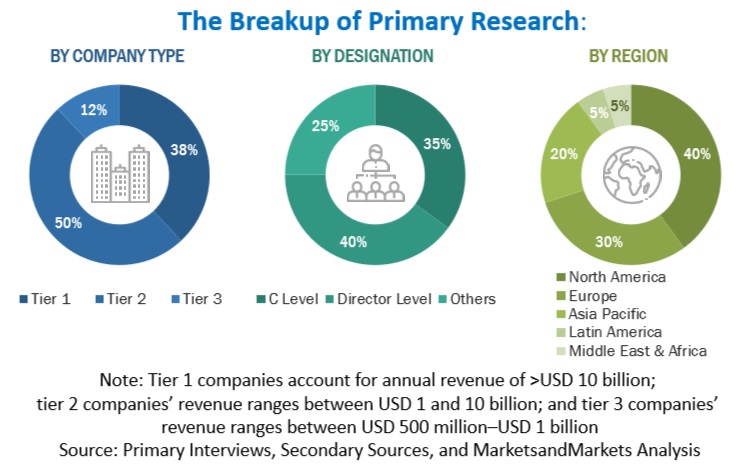
In the primary research process, various primary sources from both the supply and demand sides were interviewed to obtain qualitative and quantitative information on the market. The primary sources from the supply side included various industry experts, including Chief Experience Officers (CXOs); Vice Presidents (VPs); directors from business development, marketing, and playout automation & channel-in-a-box expertise; related key executives from playout automation & channel-in-a-box solution vendors, SIs, professional service providers, and industry associations; and key opinion leaders.
Primary interviews were conducted to gather insights, such as market statistics, revenue data collected from solutions and services, market breakups, market size estimations, market forecasts, and data triangulation. Primary research also helped understand various trends related to technologies, applications, deployments, and regions. Stakeholders from the demand side, such as Chief Information Officers (CIOs), Chief Technology Officers (CTOs), Chief Strategy Officers (CSOs), and end users using playout automation & channel-in-a-box solutions, were interviewed to understand the buyer’s perspective on suppliers, products, service providers, and their current usage of playout automation & channel-in-a-box solutions and services, which would impact the overall playout automation & channel-in-a-box market.
To know about the assumptions considered for the study, download the pdf brochure
|
COMPANY NAME |
DESIGNATION |
|
Amagi |
Senior Manager |
|
Zixi |
Solutions Engineering Manager (Software Defined Video Platform) |
|
Amagi |
Lead Product Manager |
Playout Automation Market Size Estimation
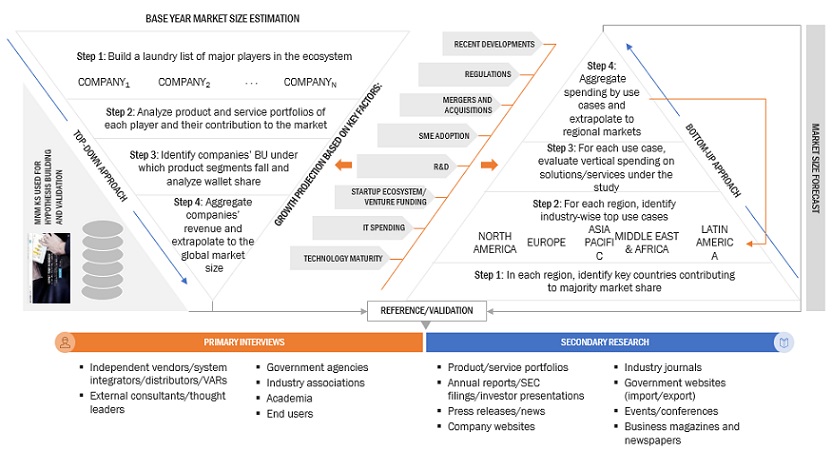
In the bottom-up approach, the adoption rate of playout automation & channel-in-a-box solutions and services among different end users in key countries concerning their regions contributing the most to the market share was identified. For cross-validation, the adoption of playout automation & channel-in-a-box solutions and services among industries and different use cases concerning their regions was identified and extrapolated. Weightage was given to use cases identified in different regions for the market size calculation.
Based on the market numbers, the regional split was determined by primary and secondary sources. The procedure included the analysis of the playout automation & channel-in-a-box market’s regional penetration. Based on secondary research, the regional spending on Information and Communications Technology (ICT), socio-economic analysis of each country, strategic vendor analysis of major playout automation & channel-in-a-box providers, and organic and inorganic business development activities of regional and global players were estimated. With the data triangulation procedure and data validation through primaries, the exact values of the overall playout automation & channel-in-a-box market size and segments’ size were determined and confirmed using the study.
Global Playout Automation & Channel-in-a-Box Market Size: Bottom-Up and Top-Down Approach:
To know about the assumptions considered for the study, Request for Free Sample Report
Data Triangulation
Based on the market numbers, the regional split was determined by primary and secondary sources. The procedure included the analysis of the playout automation & channel-in-a-box market’s regional penetration. Based on secondary research, the regional spending on Information and Communications Technology (ICT), socio-economic analysis of each country, strategic vendor analysis of major playout automation & channel-in-a-box providers, and organic and inorganic business development activities of regional and global players were estimated. With the data triangulation procedure and data validation through primaries, the exact values of the overall playout automation & channel-in-a-box market size and segments’ size were determined and confirmed using the study.
Market Definition
Playout automation is a complete solution that eliminates major operational challenges regarding scheduling and playout with the help of automated IT-based environment. The playout automation solution assists broadcasters to deliver correct content vis-à-vis channel, on relevant platform at the right time. The integrated playout automation/channel-in-a-box is a single PC-based device which playouts the content for a single channel by inserting third party I/O cards.
Stakeholders
- Playout automation & channel-in-a-box vendors
- Playout automation & channel-in-a-box service vendors
- Managed service providers
- Support and maintenance service providers
- System Integrators (SIs)/migration service providers
- Value-Added Resellers (VARs) and distributors
- Distributors and Value-added Resellers (VARs)
- System Integrators (SIs)
- Independent Software Vendors (ISV)
- Third-party providers
- Technology providers
Report Objectives
- To define, describe, and predict the playout automation & channel-in-a-box market by offering (solution and services), channel type, channel application, coverage area, vertical, and region
- To provide detailed information related to major factors (drivers, restraints, opportunities, and industry-specific challenges) influencing the market growth
- To analyze the micro markets with respect to individual growth trends, prospects, and their contribution to the total market
- To analyze the opportunities in the market for stakeholders by identifying the high-growth segments of the market
- To analyze opportunities in the market and provide details of the competitive landscape for stakeholders and market leaders
- To forecast the market size of segments for five main regions: North America, Europe, Asia Pacific, Middle East & Africa, and Latin America
- To profile key players and comprehensively analyze their market rankings and core competencies.
- To analyze competitive developments, such as partnerships, new product launches, and mergers and acquisitions, in the market
- To analyze the impact of recession across all the regions across the playout automation & channel-in-a-box market
Available Customizations
With the given market data, MarketsandMarkets offers customizations as per your company’s specific needs. The following customization options are available for the report:
Product Analysis
- Product quadrant, which gives a detailed comparison of the product portfolio of each company.
Geographic Analysis
- Further breakup of the North American playout automation & channel-in-a-box market
- Further breakup of the European market
- Further breakup of the Asia Pacific market
- Further breakup of the Middle Eastern & African market
- Further breakup of the Latin America market
Company Information
- Detailed analysis and profiling of additional market players (up to five)
Get the Full Playout Automation & Channel-in-a-Box Market Report
Full forecast, segment splits, and company analysis for all Playout Automation & Channel-in-a-Box Market.
- US Playout Automation & Channel-in-a-Box Market
- Canada Playout Automation & Channel-in-a-Box Market
- UK Playout Automation & Channel-in-a-Box Market
- Germany Playout Automation & Channel-in-a-Box Market
- France Playout Automation & Channel-in-a-Box Market
- Spain Playout Automation & Channel-in-a-Box Market
- Italy Playout Automation & Channel-in-a-Box Market
- Rest Of Europe Playout Automation & Channel-in-a-Box Market
- China Playout Automation & Channel-in-a-Box Market
- Japan Playout Automation & Channel-in-a-Box Market
- India Playout Automation & Channel-in-a-Box Market
- South Korea Playout Automation & Channel-in-a-Box Market
- ANZ Playout Automation & Channel-in-a-Box Market
- Rest Of Asia Pacific Playout Automation & Channel-in-a-Box Market
- Brazil Playout Automation & Channel-in-a-Box Market
- Mexico Playout Automation & Channel-in-a-Box Market
- Argentina Playout Automation & Channel-in-a-Box Market
- Rest Of Latin America Playout Automation & Channel-in-a-Box Market
- UAE Playout Automation & Channel-in-a-Box Market
- KSA Playout Automation & Channel-in-a-Box Market
- Turkey Playout Automation & Channel-in-a-Box Market
- South Africa Playout Automation & Channel-in-a-Box Market
Need a Tailored Report?
Customize this report to your needs
Get 10% FREE Customization
Customize This Report
