
Australia Digital Therapeutics/DTx Market (2026-2031)

The Australia Digital Therapeutics/DTx Market was valued at $138.5 Million in 2026 and projected to reach to $436.1 Million by 2031, representing a compound annual growth rate of 25.8%. Australia's digital therapeutics market is positioned for sustained growth, driven by a combination of regulatory support, healthcare system modernization, and rising chronic disease burden.


| Market Size in | USD 26.32 MN |
| Market Forecast in | |
| CAGR | |
| Forecast Period | |
| Units Considered | Value (USD MN) |
Australia Digital Therapeutics/DTx Market Trends and Insights
- This represents a compound annual growth rate of 25.8%, reflecting strong adoption of DTx solutions across Australia's healthcare ecosystem.
- Australia's regulatory environment, coupled with increasing digital health integration and chronic disease management needs, positions the country as a key growth market within the Asia Pacific region. The Australian DTx market is driven by rising healthcare costs, aging demographics, and government support for digital health innovation.
- Australia's healthcare providers and payers are increasingly recognizing DTx as a cost-effective alternative to traditional therapeutics.
- Between 2026 and 2031, Australia is expected to see accelerated investment in mental health, cardiovascular, and metabolic disorder DTx applications, supported by favorable reimbursement policies and clinical validation initiatives. Australia's competitive landscape includes both established digital health companies and emerging DTx startups leveraging the country's strong technology infrastructure.
- Australia's commitment to evidence-based healthcare and digital transformation creates significant opportunities for DTx vendors to establish market presence and drive clinical adoption throughout the forecast period..
Key Market Statistics
- CAGR (2026-2031) 25.8% CAGR
- Market Size, 2026 ~USD 138.5 Million
- Forecast, 2031 ~USD 436.1 Million
- Country Australia
Australia Digital Therapeutics/DTx Market Overview
Market Valuation Growth :
Australia's digital therapeutics market is valued at $138.5 million in 2026 and is projected to reach $436.1 million by 2031, representing a 25.8% CAGR over the forecast period.
Regulatory Advantage :
Australia's progressive regulatory environment, including TGA approval pathways and Medicare reimbursement frameworks, accelerates DTx adoption and creates favorable conditions for market expansion.
Chronic Disease Management Focus :
Rising prevalence of chronic diseases such as diabetes, cardiovascular conditions, and mental health disorders in Australia drives demand for scalable, cost-effective digital therapeutic solutions.
Digital Health Integration :
Increasing integration of digital health technologies within Australia's healthcare system, supported by government initiatives and private sector investment, strengthens DTx market penetration.
Australia Digital Therapeutics/DTx Market Dynamics
- The 25.8% CAGR reflects strong institutional adoption among hospitals, primary care providers, and aged care facilities seeking to improve patient outcomes while reducing healthcare costs. Key growth catalysts include expanding Medicare coverage for digital health services, increasing consumer acceptance of remote monitoring solutions, and partnerships between DTx developers and Australian healthcare providers.
- By 2031, the market is expected to mature with established reimbursement models, broader clinical validation, and integration into standard care pathways across multiple therapeutic areas..
Market Ecosystem
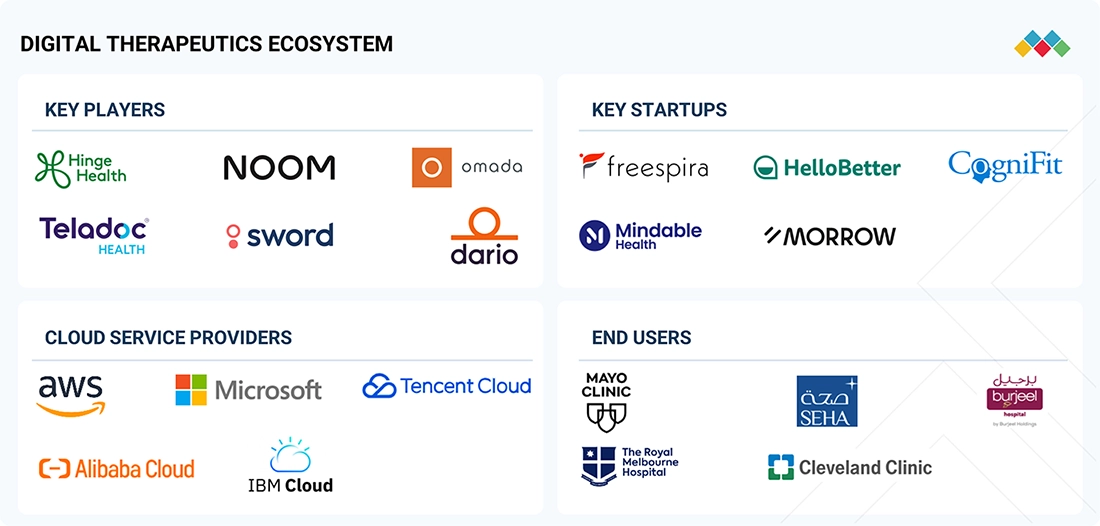
DIGITAL THERAPEUTICS MARKET: COMMERCIAL USE CASES ACROSS INDUSTRIES
| COMPANY | USE CASE DESCRIPTION | BENEFITS |
|---|---|---|
 |
AI-enabled virtual care, chronic disease management, remote patient monitoring (RPM), and integrated digital therapeutics platform | Improved patient engagement, reduced hospitalizations, enhanced chronic disease outcomes, and expanded access to virtual care |
 |
AI-powered behavior change platform, digital weight management, nutrition coaching, and personalized lifestyle interventions | Sustainable weight loss, improved metabolic health, higher patient adherence, and reduced risk of chronic diseases |
 |
AI-driven musculoskeletal (MSK) digital therapy, wearable-enabled motion tracking, computer vision, and virtual physical therapy | Faster recovery, reduced pain, lower musculoskeletal treatment costs, and decreased need for surgery or opioid use |
 |
Digital chronic disease prevention and management platform for diabetes, hypertension, obesity, and cardiovascular health using connected devices and personalized coaching | Improved clinical outcomes, better disease control, increased medication adherence, and reduced healthcare expenditures |
 |
AI-powered digital therapeutics platform integrating glucose monitoring, blood pressure monitoring, behavioral health, and personalized coaching | Better disease self-management, improved patient outcomes, enhanced engagement, and lower total cost of care |
Logos and trademarks shown above are the property of their respective owners. Their use here is for informational and illustrative purposes only.
Related Ecosystem
Healthcare Analytics
- Machine Learning
- Natural Language Processing (NLP)
- Blood Pressure Monitors
- Computed Tomography (CT)
- Magnetic Resonance Imaging (MRI)
- Oracle Corporation
- PHILIPS HEALTHCARE
- Siemens healthineers
- Zensar Technologies Limited
- EPIC SYSTEMS CORPORATION
Healthcare It
- Computed Tomography (CT)
- Machine Learning
- Magnetic Resonance Imaging (MRI)
- Natural Language Processing (NLP)
- Predictive Analytics
- CERNER CORPORATION
- PHILIPS HEALTHCARE
- Oracle Corporation
- GE HealthCare Technologies Inc.
- Siemens healthineers
Key Takeaways
- Australia's DTx market will grow from $138.5M (2026) to $436.1M (2031) at a 25.8% CAGR, outpacing global average growth.
- Australia's healthcare system is increasingly adopting DTx solutions for chronic disease management, mental health, and preventive care applications.
- Australia's regulatory framework and government digital health initiatives create favorable conditions for DTx market expansion through 2031.
- Australia's aging population and rising healthcare costs are driving demand for cost-effective, scalable digital therapeutic interventions.
Digital Therapeutics/DTx Market Report Scope
| Report Metric | Details |
|---|---|
| Base Year | 2026 |
| Fastest Growing Segment | IMMERSIVE & INTERFACE-BASED THERAPEUTICS (Offering) |
| Forecast Period | 2026-2031 |
| Growth Rate | CAGR of 26.4% from 2026 to 2031 |
| Largest Segment | B2B SALES CHANNELS (Sales Channel) |
| Market Size Base Year (Billions) | ~USD 10.96 (2026) |
| Revenue Forecast (Billions) | ~USD 35.37 (2031) |
| Segments Covered | Offering, Product Type, Application, Type, Revenue Model, Sales Channel, End User |
Australia Digital Therapeutics/DTx Market Report Segmentation
7 segment dimensions are covered across the global market.
By Offering
- Immersive & Interface-Based Therapeutics
- Software/Platforms
- Therapeutic Programs
By Product Type
- Non-Prescription Digital Therapeutics
- Prescription Digital Therapeutics
By Application
- Preventive Applications
- Treatment & Care-Related Applications
By Type
- Cardiovascular Diseases
- Central Nervous System (Cns) Disorders
- Chronic Respiratory Diseases
- Diabetes
- Diagnostic & Rehabilitation Centers
- Hospitals
- Medication Adherence
- Musculoskeletal Disorders
- Nutrition & Lifestyle Management
- Obesity & Weight Management
- Other Healthcare Providers
- Other Preventive Applications
- Other Treatment & Care-Related Applications
- Prediabetes
- Private Payers
- Public Payers
- Rehabilitation & Patient Care
- Sleep Disorders
- Smoking Cessation
- Specialty Clinics
- Substance Use Disorders & Addiction Management
By Revenue Model
- Licensing (Enterprise/SaaS) Models
- Outcome-/Value-Based Models
- Subscription-Based Models
By Sales Channel
- B2B Sales Channels
- B2C Sales Channels
By End User
- Employers
- Healthcare Payers
- Healthcare Providers
- Other End Users
- Patients/Individuals
Target Audience
- DTx Developers & Startups : Need market sizing, regulatory pathways, and reimbursement data to evaluate Australia as a priority market for product launch and expansion within the Asia-Pacific region.
- Healthcare Providers & Hospital Networks : Require insights on DTx adoption trends, clinical efficacy data, and integration capabilities to make informed procurement decisions and improve patient care delivery.
- Investment & Venture Capital Firms : Seek Australia-specific market forecasts, growth drivers, and competitive dynamics to identify high-potential DTx investment opportunities and portfolio companies in the region.
- Government & Health Policy Bodies : Need evidence-based market data to inform digital health policy, Medicare reimbursement decisions, and healthcare technology adoption strategies across Australia.
- Pharmaceutical & MedTech Companies : Require market intelligence on DTx integration opportunities, partnership potential, and competitive threats to develop digital-first healthcare strategies in Australia.
Reasons to Buy this Report
- Market Size & Growth Projections : Access precise valuation data for Australia's DTx market ($138.5M in 2026 to $436.1M in 2031) with detailed CAGR analysis to support investment decisions and business planning.
- Regulatory & Reimbursement Insights : Understand Australia's TGA approval processes, Medicare reimbursement landscape, and policy drivers that directly impact market entry strategies and commercialization timelines.
- Competitive Landscape Analysis : Identify key players, market share distribution, and competitive positioning within Australia's DTx ecosystem to benchmark performance and identify partnership opportunities.
- Therapeutic Area Breakdown : Gain segment-level insights across mental health, chronic disease management, and other therapeutic categories specific to Australia's healthcare priorities and patient demographics.
- Strategic Market Entry Planning : Leverage Australia-specific data on healthcare provider adoption, patient acceptance, and market barriers to develop targeted go-to-market strategies and resource allocation plans.
Frequently asked questions
What is the projected size of Australia's DTx market by 2031?
Australia's digital therapeutics market is projected to reach $436.1 million by 2031, growing from $138.5 million in 2026 at a 25.8% CAGR.
What are the primary drivers of DTx adoption in Australia?
Australia's DTx adoption is driven by rising healthcare costs, aging demographics, government digital health support, chronic disease prevalence, and increasing provider recognition of DTx clinical efficacy.
Which therapeutic areas are growing fastest in Australia's DTx market?
Australia's fastest-growing DTx segments include mental health, cardiovascular disease management, metabolic disorders, and chronic respiratory conditions, supported by clinical evidence and reimbursement pathways.
How does Australia's DTx market compare to global growth rates?
Australia's DTx market CAGR of 25.8% (2026-2031) is slightly below the global CAGR of 26.4%, reflecting strong but regionally-aligned growth momentum.
What regulatory factors support DTx market growth in Australia?
Australia's Therapeutic Goods Administration (TGA) framework, government digital health initiatives, and evidence-based reimbursement policies create a supportive environment for DTx innovation and market entry.
RESEARCH METHODOLOGY
This research study involved the extensive use of both primary and secondary sources. It involved the analysis of various factors affecting the industry to identify the segmentation types, industry trends, key players, the competitive landscape of market players, and key market dynamics such as drivers, opportunities, challenges, restraints, and key player strategies.
Secondary Research
This research study extensively utilized secondary sources, including directories, databases such as Dun & Bradstreet, Bloomberg Businessweek, and Factiva, as well as white papers, annual reports, and companies' house documents. The secondary research aimed to gather and analyze information for a comprehensive and commercially focused study of the digital therapeutics market, encompassing technical aspects and market dynamics. It also facilitated the identification of key players, market classification, industry trends, geographical markets, and significant market-related developments. Additionally, a database of prominent industry leaders was compiled through secondary research.
Primary Research
In the primary research process, various supply-side and demand-side sources were interviewed to obtain qualitative and quantitative information for this report. Primary sources from the supply side included industry experts such as CEOs, vice presidents, marketing and sales directors, technology & innovation directors, engineers, and related key executives from various companies and organizations operating in the digital therapeutics market. Primary sources from the demand side included personnel from healthcare providers, payers, employees, and patients/individuals.
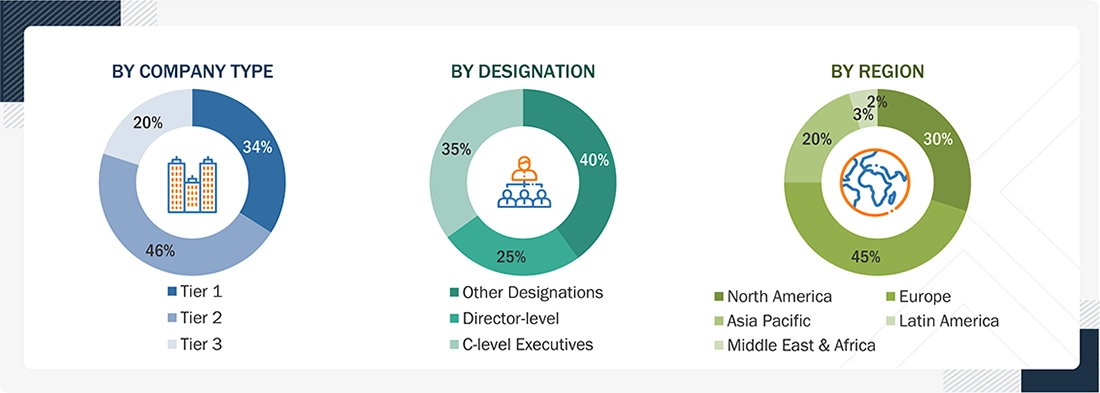
Others include sales managers, marketing managers, and product managers.
Note: Tiers are defined based on a company’s total revenue, as of 2025: Tier 1 = >USD 1 billion, Tier 2 = USD 500 million to USD 1 billion, and Tier 3 = <USD 500 million
To know about the assumptions considered for the study, download the pdf brochure
Market Size Estimation
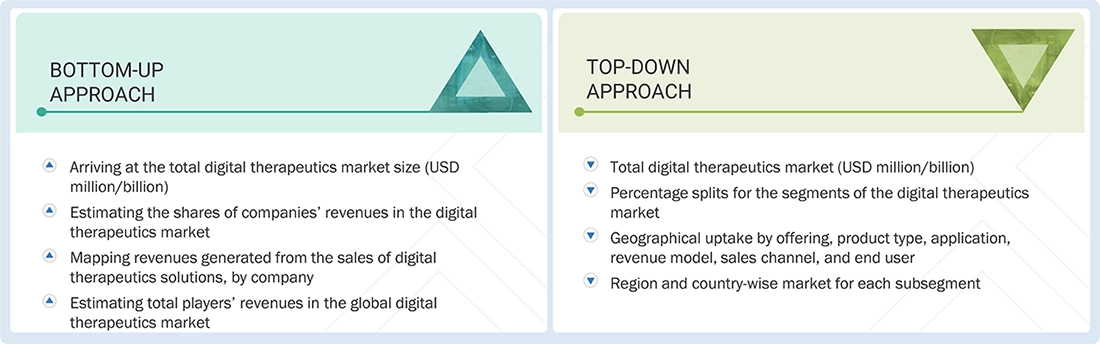
The total size of the digital therapeutics market was determined after data triangulation through the two approaches mentioned below. After the completion of each approach, the weighted average of these approaches was taken based on the level of assumptions used in each approach.
Global Digital Therapeutics Market Size: Top-down Approach and Bottom-up Approach
Data Triangulation
The size of the digital therapeutics market was estimated through segmental extrapolation using the bottom-up approach. The methodology used is as given below:
- Revenues for individual companies were gathered from public sources and databases.
- Shares of leading players in the digital therapeutics market were gathered from secondary sources to the extent available. In certain cases, shares of digital therapeutics businesses have been ascertained after a detailed analysis of various parameters, including product portfolios, market positioning, selling price, and geographic reach & strength.
- Individual shares or revenue estimates were validated through interviews with experts.
- The total revenue in the digital therapeutics market was determined by extrapolating the market share data of major companies.
Market Definition
The digital therapeutics market comprises evidence-based, clinically validated software solutions designed to prevent, manage, or treat medical conditions through therapeutic interventions delivered via digital technologies. These solutions are delivered through mobile applications, web-based platforms, connected devices, and immersive technologies, and may be prescribed by healthcare professionals or accessed directly by consumers. By leveraging data analytics, artificial intelligence (AI), and personalized behavioral interventions, digital therapeutics improve clinical outcomes, enhance patient engagement, and support the prevention and management of acute and chronic diseases.
Key Stakeholders
- Digital therapeutics developers and platform providers
- Pharmaceutical and biotechnology companies
- Healthcare providers (hospitals, specialty clinics, rehabilitation centers, and primary care centers)
- Health insurance companies (public and private payers)
- Employers and corporate wellness providers
- Medical device and wearable technology companies
- Academic medical centers, universities, and research institutions
- Regulatory agencies and health technology assessment (HTA) bodies
- Government and public health organizations
- Telehealth and digital health platform providers
- Electronic health record (EHR) and healthcare IT solution providers
- Investors, venture capital firms, and private equity firms
- Patients and patient advocacy organizations
- Business research and consulting service providers
Report Objectives
- To define, describe, and forecast the digital therapeutics market based on offering, product type, application, revenue model, sales channel, end user, and region
- To provide detailed information regarding the major factors influencing market growth (such as drivers, restraints, opportunities, and challenges)
- To analyze the micromarkets with respect to individual growth trends, prospects, and contributions to the overall digital therapeutics market
- To analyze the opportunities for stakeholders and provide details of the competitive landscape for market leaders
- To forecast the size of the market segments with respect to five main regions, namely, North America, Europe, the Asia Pacific, Latin America, and the Middle East & Africa
- To profile the key players and analyze their market shares and core competencies
- To track and analyze competitive developments such as product launches & approvals, partnerships, agreements, and collaborations in the overall digital therapeutics market
- To benchmark players within the market using the proprietary "Competitive Leadership Mapping" framework, which analyzes market players on various parameters within the broad categories of business and product strategy.
Available customizations:
With the given market data, MarketsandMarkets offers customizations as per your company’s specific needs. The following customization options are available for the report:
Company Information
- Detailed analysis and profiling of additional market players (up to 5)
Geographic Analysis
- Further breakdown of the Rest of Asia Pacific digital therapeutics market into Taiwan, New Zealand, Thailand, Singapore, Malaysia, and other countries
- Further breakdown of the Rest of Europe digital therapeutics market into Russia, Austria, Finland, Sweden, Turkey, Norway, Poland, Portugal, Romania, Denmark, and other countries
Get the Full Digital Therapeutics/DTx Market Report
Full forecast, segment splits, and company analysis for all Digital Therapeutics/DTx Market.
- US Digital Therapeutics/DTx Market
- Canada Digital Therapeutics/DTx Market
- Germany Digital Therapeutics/DTx Market
- France Digital Therapeutics/DTx Market
- UK Digital Therapeutics/DTx Market
- Italy Digital Therapeutics/DTx Market
- Spain Digital Therapeutics/DTx Market
- China Digital Therapeutics/DTx Market
- Japan Digital Therapeutics/DTx Market
- India Digital Therapeutics/DTx Market
- South Korea Digital Therapeutics/DTx Market
- Brazil Digital Therapeutics/DTx Market
- Mexico Digital Therapeutics/DTx Market
- Saudi Arabia Digital Therapeutics/DTx Market
- UAE Digital Therapeutics/DTx Market
- South Africa Digital Therapeutics/DTx Market
- Rest Of Europe Digital Therapeutics/DTx Market
- Rest Of Asia Pacific Digital Therapeutics/DTx Market
- Rest Of Latin America Digital Therapeutics/DTx Market
- GCC Countries Digital Therapeutics/DTx Market
- Rest Of GCC Countries Digital Therapeutics/DTx Market
Need a Tailored Report?
Customize this report to your needs
Get 10% FREE Customization
Customize This Report
