
Spain Energy and Utilities Analytics Market (2026-2031)

The Spain Energy and Utilities Analytics Market was valued at $159.1 Million in 2026 and projected to reach to $277.6 Million by 2031, representing a compound annual growth rate of 11.8%. Spain's Energy and Utilities Analytics Market is positioned for substantial growth as the country accelerates its energy transition toward renewable sources and digital modernization.


| Market Size in | USD 26.32 MN |
| Market Forecast in | |
| CAGR | |
| Forecast Period | |
| Units Considered | Value (USD MN) |
Spain Energy and Utilities Analytics Market Trends and Insights
- This represents a compound annual growth rate (CAGR) of 11.8%, outpacing global market expansion.
- Spain's energy sector modernization, driven by renewable energy integration and digital transformation initiatives, is fueling demand for advanced analytics solutions across utilities and grid management. The Spanish market benefits from strong regulatory support for clean energy transitions and increasing investments in smart grid infrastructure.
- Spain's commitment to EU sustainability targets is accelerating adoption of analytics platforms for operational efficiency and predictive maintenance.
- By 2031, Spain is expected to solidify its position as a key analytics hub within Europe's energy transition landscape, with utilities increasingly leveraging data-driven insights for cost optimization and renewable resource management..
Key Market Statistics
- CAGR (2026-2031) 11.8% CAGR
- Market Size, 2026 ~USD 159.1 Million
- Forecast, 2031 ~USD 277.6 Million
- Country Spain
Spain Energy and Utilities Analytics Market Overview
Strong CAGR Outperformance :
Spain's Energy and Utilities Analytics Market is growing at 11.8% CAGR (2026-2031), significantly exceeding the global growth rate of 10.6%, indicating accelerated digital adoption in the Spanish energy sector.
Renewable Energy Integration :
Spain's commitment to renewable energy expansion, particularly solar and wind, is driving demand for advanced analytics solutions to optimize grid management, forecasting, and operational efficiency across distributed energy resources.
Digital Transformation Momentum :
Spanish utilities are investing heavily in digital transformation initiatives, including smart metering, IoT deployment, and real-time data analytics to modernize aging infrastructure and improve customer engagement.
Market Valuation Growth :
The market is projected to grow from USD 159.1 million in 2026 to USD 277.6 million by 2031, representing a 74.5% increase in market value over the five-year forecast period.
Spain Energy and Utilities Analytics Market Dynamics
- Regulatory frameworks supporting clean energy adoption, combined with EU sustainability mandates, are compelling Spanish utilities to invest in advanced analytics platforms for grid optimization, demand forecasting, and asset management.
- The integration of renewable energy sources requires sophisticated data analytics to manage intermittency and ensure grid stability. Key drivers include Spain's ambitious renewable energy targets, increasing smart grid deployments, and growing consumer demand for transparency in energy consumption.
- Utilities are leveraging analytics to reduce operational costs, enhance predictive maintenance, and improve customer experience.
- As Spain continues its digital transformation journey, the market will benefit from increased adoption of cloud-based analytics solutions, AI-driven insights, and real-time monitoring capabilities across the energy value chain..
Market Ecosystem

ENERGY AND UTILITIES ANALYTICS MARKET: COMMERCIAL USE CASES ACROSS INDUSTRIES
| COMPANY | USE CASE DESCRIPTION | BENEFITS |
|---|---|---|
 |
BKW partnered with Siemens Advanta to implement a centralized cloud-based digital utility platform integrating smart meter information, operational systems, and enterprise datasets. The solution improved interoperability, enabled advanced analytics, and supported scalable modernization of utility operations. | Improved integration and accessibility of utility and smart meter data, reduced data silos through centralized infrastructure, enhanced operational analytics, and enabled scalable modernization initiatives with better decision-making capabilities |
 |
Anglian Water collaborated with IBM to modernize utility infrastructure and operational data management through integrated enterprise modernization solutions. The implementation improved interoperability, streamlined enterprise data integration, and strengthened operational intelligence across utility systems. | Increased operational efficiency and resilience, improved data accessibility and visibility across utility operations, enhanced coordination between enterprise systems, and supported scalable long-term digital transformation initiatives |
 |
ABB implemented an integrated automation and analytics platform for Eya-Bantu to enhance operational monitoring, infrastructure visibility, and asset management capabilities. The system centralized operational data analysis and enabled real-time performance monitoring across utility environments. | Improved operational visibility and infrastructure performance, enabled proactive maintenance planning, reduced inefficiencies through centralized analytics, accelerated decision-making with real-time insights, and supported scalable digital utility transformation |
Logos and trademarks shown above are the property of their respective owners. Their use here is for informational and illustrative purposes only.
Related Ecosystem
Smart Grid
- Meter Data Management (MDM)
- Sensors
- Workforce Management
- Cellular Network
- Customer Analytics
- SCHNEIDER ELECTRIC SE
- Siemens ag
- ABB India Limited
- Eaton Corporation plc
- Hitachi Energy India Limited
Analytics
- Natural Language Processing (NLP)
- Machine Learning
- Supply Chain Management
- Predictive Analytics
- Image Sensors
- International Business Machines Corporation
- MICROSOFT CORPORATION
- Oracle Corporation
- SAP SE
Key Takeaways
- Spain's Energy and Utilities Analytics Market will grow from USD 159.1M (2026) to USD 277.6M (2031) at an 11.8% CAGR.
- Spain's renewable energy expansion and EU climate commitments are primary drivers of analytics adoption among Spanish utilities.
- Smart grid modernization and predictive maintenance initiatives are accelerating demand for advanced analytics solutions in Spain.
- Spain is positioned as a strategic analytics market within Europe, supported by regulatory frameworks and digital transformation investments.
Energy and Utilities Analytics Market Report Scope
| Report Metric | Details |
|---|---|
| Base Year | 2026 |
| Fastest Growing Segment | COMMERCIAL & INDUSTRIAL (C&I) ENERGY USERS (Organization Type) |
| Forecast Period | 2026–2031 |
| Growth Rate | CAGR of 10.6% from 2026 to 2031 |
| Largest Segment | PLATFORMS (Offering) |
| Market Size Base Year (Billions) | ~USD 6.1 (2026) |
| Revenue Forecast (Billions) | ~USD 10.1 (2031) |
| Segments Covered | Offering, Service, Deployment Mode, Application, Organization Type, End User, Services |
Spain Energy and Utilities Analytics Market Report Segmentation
7 segment dimensions are covered across the global market.
By Offering
- Platforms
- Services
By Service
- Managed Services
- Professional Services
By Deployment Mode
- Cloud (SaaS/PaaS)
- Edge
- Hybrid
- On-Premises
By Application
- Asset & Operations Analytics
- Customer & Commercial Analytics
- Energy Production & Der Analytics
- Energy Trading & Market Analytics
- Grid & Network Analytics
- Other Applications
- Sustainability & Esg Analytics
By Organization Type
- Commercial & Industrial (C&I) Energy Users
- Energy Retailers/Aggregators
- Independent Power Producers (Ipps)
- Large Integrated Utilities
- Mid-Size/Regional Utilities
By End User
- Oil & Gas
- Power Utilities
- Renewable Energy Operators
- Water & Waste Utilities
By Services
- Managed Services
- Professional Services
SPAIN: ENERGY AND UTILITIES ANALYTICS MARKET, BY END USER, 2026–2031
| Segment | 2026 | 2027 | 2028 | 2029 | 2030 | 2031 | CAGR (%) |
|---|---|---|---|---|---|---|---|
| OIL & GAS | 35.4 | 40.1 | 45.1 | 50.4 | 55.5 | 60.3 | 11.3 |
| POWER UTILITIES | 62.5 | 70.3 | 78.7 | 87.2 | 95.4 | 102.8 | 10.5 |
| RENEWABLE ENERGY OPERATORS | 28.8 | 33.7 | 39.1 | 44.9 | 50.8 | 56.7 | 14.5 |
| WATER & WASTE UTILITIES | 32.5 | 37.1 | 42.1 | 47.4 | 52.7 | 57.7 | 12.2 |
| TOTAL | 159.1 | 181.3 | 205 | 229.9 | 254.5 | 277.6 | 11.8 |
Target Audience
- Energy Analytics Software Vendors : Need Spain-specific market data to identify growth opportunities, understand customer requirements, and develop localized solutions for Spanish utilities undergoing digital transformation.
- Utility Companies & Grid Operators : Require market insights to benchmark their analytics investments, understand competitive offerings, and justify budget allocation for modernization initiatives aligned with Spain's renewable energy goals.
- Investment & Private Equity Firms : Seek detailed Spain market forecasts to evaluate acquisition targets, assess portfolio company growth potential, and identify emerging opportunities in the high-growth Spanish energy analytics sector.
- Management Consultants & Strategy Advisors : Need Spain-focused market data to advise clients on digital transformation strategies, competitive positioning, and investment priorities within the Spanish energy and utilities sector.
- Government & Regulatory Bodies : Require market intelligence to inform energy policy decisions, assess digital infrastructure readiness, and support Spain's renewable energy transition and sustainability objectives.
Key Companies in the Spain Energy and Utilities Analytics Market
| Company | HQ | Ownership | Strongest segments |
|---|---|---|---|
| KONGSBERG GRUPPEN | Norway | Public Company | Air defence, combat systems, C2, and naval sensors,Remote weapon stations and land/marine weapon integration,Missiles (naval strike and air-to-surface), |
| TABLEAU SOFTWARE INC | United States | Private Company | Tableau Desktop (creator licenses),Tableau Server & Tableau Online (viewer/explorer consumption),Tableau Prep & data management/Hyper, |
| NOKIA CORPORATION | Finland | Public Company | Mobile Networks (RAN and microwave transport),Network Infrastructure (IP, optical, fixed access, in-home Wi-Fi),Cloud and Network Services (5G core, automation, private wireless, edge), |
| VEOLIA | France | Public Company | Water services and technologies,Waste and hazardous waste,Energy services and networks, |
| TECH MAHINDRA LIMITED | India | Public Company | Application development, modernization, and digital engineering platforms,Cloud, infrastructure, and AIOps-led operations,Business process services and customer experience, |
| ELSTER GROUP | Germany | Private Company | Gas meters, regulation, and gas utilization products,Electricity meters and AMI communications,Water meters, |
| SIEMENS | Germany | Public Company | Digital Industries (automation, control, industrial software),Smart Infrastructure (electrification, buildings, grid solutions),Mobility (rail systems, automation, digital services), |
| ABB | Switzerland | Public Company | Electrification,Motion,Automation, |
| GE VERNOVA | United States | Public Company | Power (gas, nuclear, hydro, steam),Wind (onshore and offshore),Electrification (grid, conversion, software, solar & storage), |
| AUTODESK | United States | Public Company | Architecture, Engineering & Construction (Revit, Civil 3D, Autodesk Build, BIM Collaborate Pro, BuildingConnected, Tandem),Manufacturing & Product Design (Fusion, Inventor, Product Design & Manufacturing Collection, Vault),AutoCAD & AutoCAD LT, |
| IBM | United States | Public Company | Software (Hybrid Cloud & AI Platforms),Consulting (Strategy, Technology, Operations),Infrastructure (Servers, Storage, Hybrid Cloud Infrastructure Services), |
| SCHNEIDER ELECTRIC | France | Public Company | Low- and medium-voltage electrical products and systems,Building management, power metering, and smart controls,Industrial automation, variable speed drives, and control software, |
| United States | Public Company | Search & Other Advertising,YouTube Advertising,Google Cloud (incl. Workspace), | |
| MICROSOFT | United States | Public Company | Azure and other cloud services,Microsoft 365 Commercial (incl. Teams, security, compliance, Copilot),LinkedIn, |
| ORACLE | United States | Public Company | Cloud applications (Fusion ERP/EPM/SCM/HCM, NetSuite, Oracle Health, CX),Database and infrastructure technologies (Oracle Database, MySQL, Autonomous DB, middleware, IaaS/PaaS),License support and related services, |
| SAP | Germany | Public Company | SAP S/4HANA and core ERP,SAP Business Technology Platform (BTP) and Business Network,SAP SuccessFactors and HR solutions, |
| BENTLEY SYSTEMS | United States | Public Company | Open Modeling Applications (MicroStation, OpenRoads, OpenBuildings, etc.),Open Simulation & Geoprofessional (ADINA, STAAD, PLAXIS, GeoStudio, etc.),Infrastructure Cloud (ProjectWise, SYNCHRO, AssetWise), |
| TERADATA | United States | Public Company | AI and Knowledge Platform (software and product sales),Consulting and Support Services, |
| SNOWFLAKE | United States | Public Company | Core Data Cloud (data warehousing, storage, compute),AI Data Cloud & advanced analytics,Data sharing, marketplace, and data products, |
KONGSBERG GRUPPEN
Kongsberg Gruppen is a Norwegian public company founded in 1814 with 7,586 employees, operating as a diversified industrial and technology conglomerate.
TABLEAU SOFTWARE INC
Tableau Software Inc is a United States-based private company founded in 2003 with 4,181 employees, specializing in data visualization and business intelligence software.
NOKIA CORPORATION
Nokia Corporation is a Finnish public company founded in 1865 with 78,005 employees, operating as a global leader in telecommunications and network infrastructure.
VEOLIA
Veolia is a French public company founded in 1853 with 203,100 employees, providing environmental services including water, waste, and energy management solutions.
TECH MAHINDRA LIMITED
Tech Mahindra Limited is an Indian public company founded in 1986 with 119,337 employees, offering information technology services and digital transformation solutions.
ELSTER GROUP
Elster Group is a German private company with 6,985 employees, operating in the metering and energy management technology sector.
SIEMENS
Siemens is a German public company founded in 1847 with 310,312 employees, operating as a diversified industrial conglomerate in automation, digitalization, and energy.
ABB
ABB is a Switzerland-based public company founded in 1883 with 112,700 employees, specializing in robotics, power, and automation technologies.
GE VERNOVA
GE Vernova is a United States-based public company founded in 2023 with 78,000 employees, focused on energy transition and renewable power solutions.
AUTODESK
Autodesk is a United States-based public company founded in 1982 with 14,300 employees, providing design and engineering software for architecture, construction, and manufacturing.
IBM
IBM is a United States-based public company founded in 1911 with 264,300 employees, offering cloud computing, artificial intelligence, and enterprise technology services.
SCHNEIDER ELECTRIC
Schneider Electric is a French public company founded in 1836 with 158,122 employees, specializing in energy management and automation solutions.
Google is a United States-based public company founded in 1998 with 194,668 employees, operating as a global leader in search, advertising, and cloud computing.
MICROSOFT
Microsoft is a United States-based public company founded in 1975 with 228,000 employees, providing software, cloud services, and enterprise technology solutions.
ORACLE
Oracle is a United States-based public company founded in 1977 with 141,000 employees, specializing in database software and cloud computing services.
SAP
SAP is a German public company founded in 1972 with 111,038 employees, providing enterprise resource planning and business management software solutions.
BENTLEY SYSTEMS
Bentley Systems is a United States-based public company founded in 1984 with 5,800 employees, offering software for infrastructure design, construction, and operations.
TERADATA
Teradata is a United States-based public company founded in 1979 with 5,100 employees, providing cloud data analytics and enterprise data warehouse solutions.
SNOWFLAKE
Snowflake is a United States-based public company founded in 2012 with 9,250 employees, offering cloud-based data warehousing and analytics platforms.
Reasons to Buy this Report
- Market Size & Growth Validation : Obtain precise market valuation data for Spain (USD 159.1M in 2026, USD 277.6M in 2031) to support investment decisions, business planning, and competitive positioning in the Spanish energy analytics sector.
- Regional Performance Benchmarking : Compare Spain's 11.8% CAGR against global 10.6% growth to identify outperformance opportunities and understand why the Spanish market is accelerating faster than worldwide trends.
- Renewable Energy Opportunity Assessment : Understand how Spain's renewable energy integration is creating demand for analytics solutions, enabling vendors to tailor products for grid optimization, forecasting, and distributed energy resource management.
- Strategic Market Entry Planning : Leverage detailed Spain-specific insights to develop go-to-market strategies, identify key customer segments, and prioritize investment in the high-growth Spanish utilities analytics market.
- Competitive Intelligence & Forecasting : Access Spain-focused market data to monitor competitor activities, anticipate market trends, and make informed decisions about product development and expansion timelines in this outperforming region.
Frequently asked questions
What is the current size of Spain's Energy and Utilities Analytics Market?
Spain's Energy and Utilities Analytics Market is valued at USD 159.1 million in 2026, with projections to reach USD 277.6 million by 2031.
What is the expected growth rate for Spain's Energy and Utilities Analytics Market?
Spain's market is expected to grow at a compound annual growth rate (CAGR) of 11.8% from 2026 to 2031.
What factors are driving growth in Spain's Energy and Utilities Analytics Market?
Key drivers include Spain's renewable energy transition, EU sustainability regulations, smart grid investments, and utilities' need for operational efficiency and predictive maintenance.
How does Spain's market growth compare to global trends?
Spain's 11.8% CAGR outpaces the global market CAGR of 10.6%, reflecting stronger regional demand for analytics solutions in the energy sector.
Which sectors in Spain are adopting Energy and Utilities Analytics solutions?
Spanish utilities, renewable energy operators, grid management companies, and energy distribution firms are primary adopters of advanced analytics platforms.
RESEARCH METHODOLOGY
This research study on the energy and utilities analytics market involved extensive secondary sources, including directories, IEEE Communication-Efficient: Algorithms and Systems, and the International Journal of Innovation and Technology Management, as well as paid databases. Primary sources were mainly industry experts from core and related industries, preferred energy and utilities analytics providers, third-party service providers, consulting service providers, end users, and other commercial enterprises. In-depth interviews with primary respondents, including key industry participants and subject matter experts, were conducted to gather and verify critical qualitative and quantitative information, as well as assess the market’s prospects.
Secondary Research
In the secondary research process, various sources were referred to identify and collect information for this study. Secondary sources included annual reports, press releases, and investor presentations of companies; white papers, journals, and certified publications; and articles from recognized authors, directories, and databases. The data was also collected from other secondary sources, such as journals, government websites, blogs, and vendors’ websites. Additionally, the energy and utilities analytics spending of various countries was extracted from the respective sources.
Primary Research
In the primary research process, various sources from the supply and demand sides were interviewed to obtain qualitative and quantitative information on the market. The primary sources from the supply side included various industry experts, such as chief experience officers (CXOs), vice presidents (VPs), and directors specializing in business development, marketing, and energy and utilities analytics services. It also included key executives from energy and utilities analytics vendors, system integrators (SIs), professional service providers, industry associations, and other key opinion leaders.
Breakup of Primary Profiles
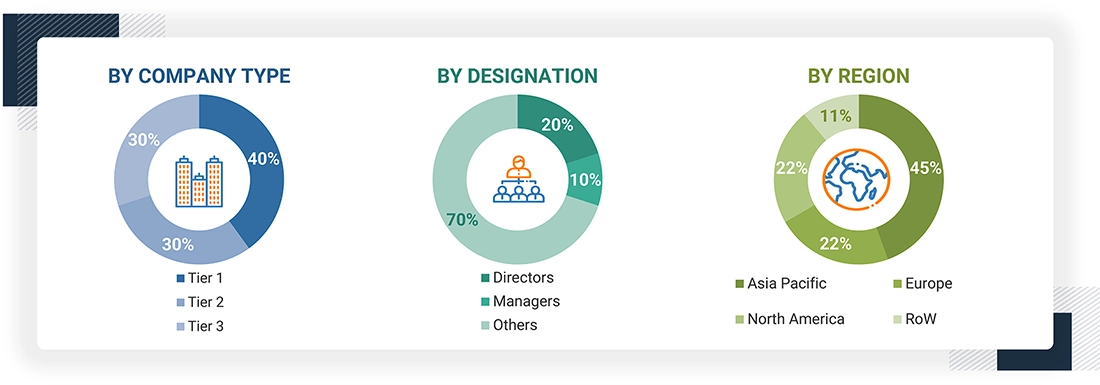
Note: Tier 1 companies’ revenue is more than USD 500 million; tier 2 companies’ revenue range between USD 500 million and 100 million; and tier 3 companies’ revenue ranges less than USD 100 million for the calendar year ended December 31st, 2025
*Others include sales managers, marketing managers, and product managers
Source: Industry Experts
To know about the assumptions considered for the study, download the pdf brochure
Market Size Estimation
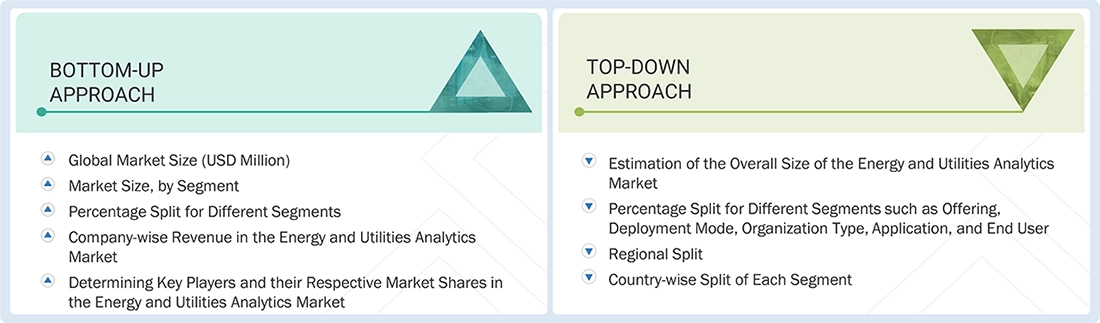
Multiple approaches were adopted to estimate and forecast the energy and utilities analytics market. The first approach involved estimating the market size based on companies’ revenue from the sale of energy and utilities analytics products.
Market Size Estimation Methodology: Top-down Approach
The top-down approach prepared an exhaustive list of all the vendors offering products in the energy and utilities analytics market. The revenue contribution of the market vendors was estimated through annual reports, press releases, funding, investor presentations, paid databases, and primary interviews. Each vendor’s offerings were evaluated based on offering, deployment mode, organization type, application, end user, and region. The markets were triangulated through primary and secondary research. The primary procedure included extensive interviews for key insights from industry leaders, such as CIOs, CEOs, VPs, directors, and marketing executives. The market numbers were further triangulated with the existing MarketsandMarkets’ repository for validation.
Market Size Estimation Methodology: Bottom-up Approach
The bottom-up approach identified the adoption rate of energy and utilities analytics products across different end users in key countries, considering the regions that contribute the most to the market share. For cross-validation, the adoption of energy and utilities analytics products among enterprises and other use cases for their regions was identified and extrapolated. Use cases identified in different areas were weighed for the market size calculation.
Based on the market numbers, the regional split was determined by primary and secondary sources. The procedure included an analysis of the energy and utilities analytics market’s regional penetration. Based on secondary research, the regional spending on Information and Communications Technology (ICT), socioeconomic analysis of each country, strategic vendor analysis of major energy and utilities analytics service providers, and organic and inorganic business development activities of regional and global players were estimated.
Energy and Utilities Analytics Market : Top-Down and Bottom-Up Approach
Data Triangulation
After determining the overall market size using the market size estimation processes as explained above, the market was split into several segments and subsegments. Data triangulation was employed, wherever applicable, to complete the overall market engineering process and arrive at the exact statistics of each market segment and subsegment. The overall market size was then used in the top-down approach to estimate the size of other individual markets by applying percentage splits to the market segmentation.
Market Definition
Industry experts have dimensionally varying definitions. Here are two that explained the scope of MarketsandMarkets’ study best:
According to Salesforce, energy and utilities analytics refers to the use of unified operational, customer, and asset data along with AI-driven insights to help utility companies improve decision-making, optimize operations, enhance customer engagement, and support sustainability goals. It enables organizations to analyze real-time and historical data for better forecasting, operational efficiency, and service management.
According to ScienceSoft, energy and utilities analytics refers to the use of advanced data analytics and AI technologies to help utility companies make informed decisions using data from energy generation, distribution, consumption, equipment performance, and environmental factors. It enables organizations to integrate data from multiple sources into a unified system for better operational visibility and efficiency. These analytics solutions support applications such as demand forecasting, predictive maintenance, demand-side management (DSM), and ESG monitoring. Ultimately, energy and utilities analytics help improve asset utilization, optimize resource allocation, ensure regulatory compliance, and enhance customer experience.
Key Stakeholders
- Energy and utilities analytics platform vendors
- Enterprise end users
- Distributors and Value-added Resellers (VARs)
- Government agencies
- Independent software vendors (ISVs)
- Managed service providers
- Support & maintenance service providers
- System Integrators (SIs)/migration service providers
- Technology providers
- Academia & research institutions
- Investors & venture capital firms
Report Objectives
- To define, describe, and forecast the energy and utilities analytics market, by offering, deployment mode, organization type, application, and end user
- To provide detailed information related to major factors (drivers, restraints, opportunities, and industry-specific challenges) influencing market growth
- To strategically analyze the micromarkets with respect to individual growth trends, prospects, adoption patterns, and their contribution to the total market
- To analyze opportunities in the market and provide details of the competitive landscape for stakeholders and market leaders
- To analyze the impact of macroeconomic factors on the Energy and utilities analytics market across all regions
- To analyze market opportunities for stakeholders and present a comprehensive competitive landscape of leading energy and utilities analytics vendors, OEM aftermarket players, and service providers
- To project the market size and its submarkets in terms of value (USD million) across five key regions (North America, Europe, Asia Pacific, Middle East & Africa, Latin America), along with an analysis of their respective major countries
- To strategically profile leading companies and provide an in-depth evaluation of their core competencies, product portfolios, technology capabilities, and market positioningTo examine competitive developments, including product launches, software upgrades, partnerships, integrations, strategic expansions, and mergers & acquisitions across the energy and utilities analytics ecosystem
Available customizations:
With the given market data, MarketsandMarkets offers customizations as per the company’s specific needs. The following customization options are available for the report:
Product Analysis
- The product matrix provides a detailed comparison of the product portfolio of each company.
Regional Analysis
- Further breakup of the North American energy and utilities analytics market
- Further breakup of the European energy and utilities analytics market
- Further breakup of the Asia Pacific energy and utilities analytics market
- Further breakup of the Middle East & Africa energy and utilities analytics market
- Further breakup of the Latin American energy and utilities analytics market
Company Information
- Detailed analysis and profiling of additional market players (up to five)
Get the Full Energy and Utilities Analytics Market Report
Full forecast, segment splits, and company analysis for all Energy and Utilities Analytics Market.
- Canada Energy and Utilities Analytics Market
- US Energy and Utilities Analytics Market
- UK Energy and Utilities Analytics Market
- Germany Energy and Utilities Analytics Market
- France Energy and Utilities Analytics Market
- China Energy and Utilities Analytics Market
- India Energy and Utilities Analytics Market
- Japan Energy and Utilities Analytics Market
- Saudi Arabia Energy and Utilities Analytics Market
- United Arab Emirates Energy and Utilities Analytics Market
- South Africa Energy and Utilities Analytics Market
- Turkey Energy and Utilities Analytics Market
- Brazil Energy and Utilities Analytics Market
- Mexico Energy and Utilities Analytics Market
- Rest Of Europe Energy and Utilities Analytics Market
Need a Tailored Report?
Customize this report to your needs
Get 10% FREE Customization
Customize This Report
