
Asia Pacific Grow Lights Market (2024-2029)

The Asia Pacific Grow Lights Market was valued at $553.9 Million in 2024 and projected to reach to $2123.7 Million by 2029, representing a compound annual growth rate of 30.8%. Asia Pacific's grow lights market is positioned for transformative expansion, projected to reach $2,123.7 million by 2029, representing a 283% increase from 2024 levels.


| Market Size in | USD 26.32 MN |
| Market Forecast in | |
| CAGR | |
| Forecast Period | |
| Units Considered | Value (USD MN) |
Asia Pacific Grow Lights Market Trends and Insights
- In 2024, Asia Pacific's grow lights market was valued at $553.9 million, driven by rapid urbanization, increasing food security concerns, and government support for sustainable farming practices across the region.
- The market is projected to expand significantly to $2,123.7 million by 2029, reflecting a compound annual growth rate of 30.8%. The expansion of Asia Pacific's grow lights market is fueled by rising adoption of vertical farming, greenhouse automation, and LED technology advancements.
- Countries within Asia Pacific are investing heavily in indoor farming infrastructure to meet growing demand from dense urban populations and climate-vulnerable agricultural zones.
- Asia Pacific's favorable regulatory environment and lower manufacturing costs further accelerate market penetration across commercial and residential segments. Asia Pacific's grow lights market growth outpaces global trends, positioning the region as a key investment destination for technology providers and agricultural enterprises.
- The region's young demographic, technological adoption rates, and commitment to food self-sufficiency create sustained demand through 2029 and beyond..
Key Market Statistics
- CAGR (2024-2029) 30.8% CAGR
- Market Size, 2024 ~USD 553.9 Million
- Forecast, 2029 ~USD 2123.7 Million
- Geography Asia Pacific
Asia Pacific Grow Lights Market Overview
Market Leadership Position :
Asia Pacific commands the global grow lights market with a $553.9 million valuation in 2024, significantly outpacing other regions due to concentrated agricultural innovation and rapid technology adoption across the region.
Exceptional Growth Trajectory :
The region's 30.8% CAGR substantially exceeds the global average of 26.5%, driven by urbanization pressures, food security imperatives, and government incentives for sustainable farming across Asia Pacific nations.
China's Market Dominance :
China leads Asia Pacific with $700.8 million in market size, establishing itself as the primary growth engine for horticultural technology and controlled environment agriculture investments in the region.
Emerging Southeast Asian Growth :
Southeast Asia represents a high-potential segment valued at $573.4 million, with rapidly expanding vertical farming adoption and increasing government support for agricultural modernization initiatives.
Asia Pacific Grow Lights Market Dynamics
- This exceptional growth is underpinned by accelerating urbanization, critical food security challenges, and substantial government investments in sustainable agriculture across the region.
- Countries like China, Japan, and Southeast Asian nations are spearheading technological adoption and infrastructure development. The region's competitive advantages include lower manufacturing costs, large-scale agricultural operations, and supportive regulatory frameworks promoting controlled environment agriculture.
- Rising consumer demand for locally-grown produce, coupled with climate variability concerns, continues to drive adoption of advanced grow light technologies.
- Strategic partnerships between technology providers and regional agricultural enterprises are expected to further accelerate market penetration and innovation throughout the forecast period..
Market Ecosystem
Related Ecosystem
Smart Lighting
- Fiber Laser
- Fluorescent Lighting
- Gas Lasers
- Sensors
- 3D Sensors
- Zumtobel group ag
- Nedap n.v.
- Acuity Brands, Inc.
- OSRAM Licht AG
- Philips
Digitalization And Iot
- Sensors
- Remote Monitoring
- Supply Chain Management
- Passenger Information System (PIS)
- Platform as A Service (PaaS)
- International Business Machines Corporation
- Cisco Systems, Inc.
- MICROSOFT CORPORATION
- Oracle Corporation
- HUAWEI TECHNOLOGIES CO LTD
Key Takeaways
- Asia Pacific's grow lights market is valued at $553.9 million in 2024 and will reach $2,123.7 million by 2029, growing at 30.8% CAGR.
- Asia Pacific leads global market expansion, driven by vertical farming adoption, urbanization, and food security initiatives across the region.
- LED technology and greenhouse automation are primary growth catalysts in Asia Pacific's horticultural sector.
- Asia Pacific's favorable regulatory environment and manufacturing capabilities position it as the world's fastest-growing grow lights market.
Grow Lights Market Report Scope
| Report Metric | Details |
|---|---|
| Base Year | 2024 |
| Fastest Growing Segment | DIRECT SALES CHANNELS (Sales Channel) |
| Forecast Period | 2024-2029 |
| Growth Rate | CAGR of 26.5% from 2024 to 2029 |
| Largest Segment | TOP LIGHTING (Lighting Type) |
| Market Size Base Year (Billions) | ~USD 1.98 (2024) |
| Revenue Forecast (Billions) | ~USD 6.4 (2029) |
| Segments Covered | Offering, Application, Wattage, Spectrum, Cultivated Plant, Installation Type, Lighting Type, Sales Channel |
Asia Pacific Grow Lights Market Report Segmentation
8 segment dimensions are covered across the global market.
By Offering
- Hardware
- Software & Services
By Application
- Greenhouses
- Indoor Farming
- Other Applications
- Vertical Farming
By Wattage
- <300 Watts
- >=300 Watts
By Spectrum
- Full Spectrum
- Limited Spectrum
By Cultivated Plant
- Cannabis
- Flowers
- Fruits & Vegetables
By Installation Type
- New Installations
- Retrofit Installations
By Lighting Type
- Interlighting
- Top Lighting
By Sales Channel
- Direct Sales Channels
- Distribution Channels
- E-Commerce Channels
Target Audience
- Agricultural Technology Manufacturers : Manufacturers need Asia Pacific market intelligence to identify expansion opportunities, localize product offerings, and capitalize on the region's 30.8% growth rate and $2.1B+ forecast market size.
- Investment & Private Equity Firms : Investors require detailed regional analysis to evaluate acquisition targets, assess growth potential across Asia Pacific countries, and structure funding strategies for high-growth agricultural tech ventures.
- Vertical Farming & Agritech Operators : Operators need country-specific market data to plan facility expansion, optimize technology procurement, and understand competitive positioning within Asia Pacific's rapidly evolving controlled agriculture sector.
- Government & Policy Makers : Policymakers require market insights to design agricultural modernization programs, allocate sustainability funding, and develop regulatory frameworks supporting Asia Pacific's grow lights industry growth.
- Supply Chain & Distribution Partners : Distributors and logistics providers need regional market forecasts to optimize inventory management, plan distribution networks, and identify emerging demand centers across Asia Pacific geographies.
Countries within Asia Pacific - compare and drill down
| Country | 2025 size (native) |
|---|---|
| China | USD 700.8 Million |
| Japan | USD 382.3 Million |
| Australia | USD 169.9 Million |
| Southeast Asia | USD 573.4 Million |
| Rest Of Asia Pacific | USD 297.3 Million |
Country market size visualization
Reasons to Buy this Report
- Regional Market Dominance Insights : Gain comprehensive understanding of why Asia Pacific leads globally, with detailed analysis of market drivers, competitive dynamics, and regional advantages that inform strategic positioning.
- Country-Level Granularity : Access detailed market sizing for China ($700.8M), Southeast Asia ($573.4M), Japan ($382.3M), and Australia ($169.9M) to identify high-potential investment and expansion opportunities.
- Growth Acceleration Data : Leverage the 30.8% CAGR projection through 2029 to forecast revenue opportunities, plan capacity investments, and align product development with the fastest-growing regional market segment.
- Government Policy & Incentive Analysis : Understand region-specific regulatory frameworks, sustainability mandates, and government support mechanisms driving adoption across Asia Pacific nations for compliant market entry strategies.
- Competitive Landscape Mapping : Identify key competitors, market consolidation trends, and partnership opportunities specific to Asia Pacific's unique agricultural technology ecosystem and supply chain dynamics.
Frequently asked questions
What is the current size of Asia Pacific's grow lights market?
Asia Pacific's grow lights market was valued at $553.9 million in 2024 and is projected to grow to $2,123.7 million by 2029.
What is the growth rate for grow lights in Asia Pacific?
Asia Pacific's grow lights market is expanding at a compound annual growth rate (CAGR) of 30.8% from 2024 to 2029.
Which countries in Asia Pacific are driving grow lights market growth?
Major contributors include China, Japan, India, and Southeast Asian nations, where vertical farming and controlled environment agriculture investments are accelerating.
What technology trends are shaping Asia Pacific's grow lights market?
LED technology adoption, smart greenhouse systems, IoT integration, and energy-efficient lighting solutions are primary drivers of innovation in Asia Pacific.
Why is Asia Pacific's grow lights market growing faster than the global average?
Asia Pacific's rapid urbanization, food security concerns, government agricultural subsidies, and lower manufacturing costs create stronger demand than global markets.
RESEARCH METHODOLOGY
The research report includes four major activities, estimating the size of the grow lights market. Secondary research has been done to gather important information about the market and peer markets. To validate the findings, assumptions, and sizing with the primary research with industry experts across the supply chain is the next step. Both bottom-up and top-down approaches have been used to estimate the market size. After this, the market breakdown and data triangulation have been adopted to estimate the market sizes of segments and sub-segments
Secondary Research
During the secondary research phase, a diverse array of secondary sources was consulted to gather pertinent information for this study. These sources included corporate filings such as annual reports, press releases, investor presentations, and financial statements, as well as data from trade, business, and professional associations. Additionally, white papers, location-based marketing journals, accredited publications, articles authored by recognized experts, directories, and databases were utilized.
The primary objective of the secondary research was to obtain crucial insights into the industry's supply chain, market monetary flow, and the comprehensive landscape of key players. It also facilitated the segmentation of the market according to prevailing industry trends, reaching down to granular levels. Moreover, it involved the analysis of geographic markets and significant developments from both market and technology perspectives. The secondary data underwent meticulous collection and analysis to ascertain the overall market size, which was subsequently validated through primary research.
Primary Research
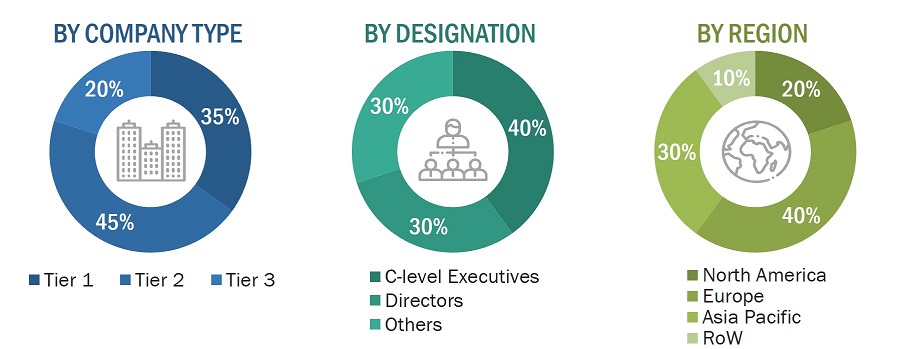
During the primary research phase, a variety of primary sources were utilized to gather qualitative and quantitative insights for this report, encompassing both the supply and demand sides. On the supply side, primary sources included industry experts such as chief executive officers (CEOs), vice presidents, marketing directors, technology and innovation directors, subject-matter experts (SMEs), consultants, and other key executives from prominent companies and organizations operating within the grow lights market.
Following a rigorous market engineering process, which entailed calculations for market statistics, breakdowns, size estimations, forecasting, and data triangulation, extensive primary research was conducted to collect, verify, and validate critical numerical data. This primary research aimed to identify segmentation types, industry trends, key players, competitive landscapes, and key market dynamics such as drivers, restraints, opportunities, and challenges. Additionally, it sought to understand the key strategies adopted by market players.
Drawing upon insights garnered from secondary research on the grow lights market, a thorough primary research effort was undertaken. Multiple primary interviews were conducted with experts from both the demand and supply sides across four key regions: North America, Europe, Asia Pacific, and ROW (Middle East, South America, and Africa). Approximately 25% of the primary interviews were conducted with representatives from the demand side, while 75% was with those from the supply side. Primary data collection was executed through questionnaires, emails, and telephonic interviews.
To know about the assumptions considered for the study, download the pdf brochure
Market Size Estimation
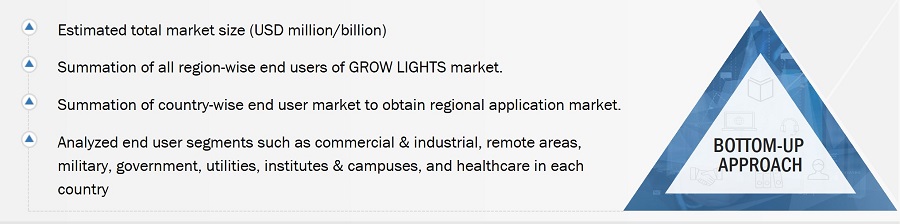
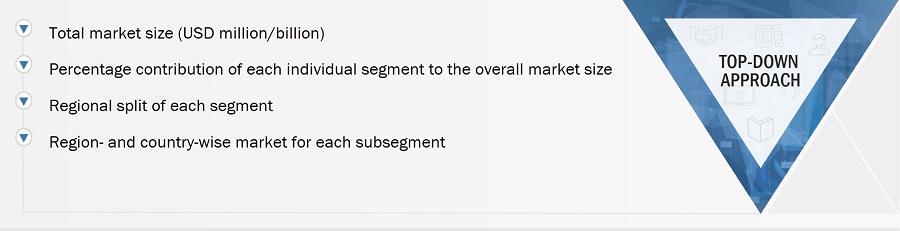
This report employed both top-down and bottom-up methodologies to evaluate and validate the size of the grow lights market and its related submarkets. Key players in the grow lights sector were identified through secondary research, while their market share in specific regions was determined through a blend of primary and secondary research. The comprehensive research approach included reviewing annual and financial reports of industry leaders and conducting interviews with key stakeholders, such as CEOs, VPs, directors, and marketing executives, to gather both quantitative and qualitative insights. Percentage shares, divisions, and breakdowns were sourced from secondary references and cross-checked with primary sources. All potential market influencers were examined through primary research and analyzed to compile the final quantitative and qualitative dataset. This data was consolidated and enriched with extensive analysis from MarketsandMarkets. The following figures illustrate the methodology utilized to estimate the overall market size for this study.
Market Size Estimation Methodology-Bottom-Up Approach
The overall size of the grow lights market was determined using a bottom-up approach, which involved calculating the market size based on the revenue generated by key players and their market share. A thorough analysis of key players in the grow lights market was conducted, and market size estimations were derived by considering the size of their grow lights offerings.
Market Size Estimation Methodology-Top-Down Approach
The top-down methodology utilized the overall market size as the foundation for determining individual market sizes, following the market segmentation with percentage allocations derived from primary and secondary research. To calculate specific market segment sizes, the immediate parent market size was utilized in applying the top-down approach. Additionally, the bottom-up approach was employed to validate segment sizes using data obtained from secondary research sources. Company market share estimates were utilized to confirm revenue distributions previously used in the bottom-up approach. Through a data triangulation process and validation via primary research sources, this study conclusively determined and confirmed both the overall parent market size and the size of each individual market segment.
Data Triangulation
After arriving at the overall market size from the market size estimation process explained above, the total market was split into several segments and subsegments. Data triangulation was employed to complete the market engineering process and arrive at the exact statistics for all segments and subsegments. The data has been triangulated by studying various factors and trends from the demand and supply sides. Along with this, the market has been validated using the top-down and bottom-up approaches.
Market Definition
Grow lights are artificial lights designed to support indoor plant growth throughout the year. These lights, often LED and electric, stimulate plant growth by emitting light suitable for photosynthesis. Essentially, grow lights (also known as horticultural lights) provide a spectrum similar to sunlight, enabling indoor plants to undergo photosynthesis. They are crucial gardening tools that ensure houseplants receive sufficient light, even in rooms lacking natural sunlight.
Grow lights play a vital role in urban agriculture practices. They can deliver a customized light spectrum tailored to the needs of specific plants or supplement natural light, particularly in regions with limited daylight hours, such as colder countries. By extending the hours of natural daylight, grow lights enhance the health, growth rate, and yield of plants.
Key Stakeholders
- Raw Material Suppliers
- Original Equipment Manufacturers (OEMs)
- Original Design Manufacturers (ODMs)
- Research Institutes
- Grow Lights Providers
- Forums, Alliances, and Associations
- Governments and Financial Institutions
- Analysts and Strategic Business Planners
The main objectives of this study are as follows:
- To describe and forecast the size of the grow lights market, in terms of value, by wattage, spectrum, cultivated plant, lighting type, application, installation type, and sales channel
- To describe and forecast the market size of various segments across four key regions—North America, Europe, Asia Pacific, and the Rest of the World (RoW), in terms of value
- To describe and forecast the grow lights market, in terms of value and volume, by offering
- To provide detailed information regarding the drivers, restraints, opportunities, and challenges influencing the growth of the grow lights market
- To provide an overview of the supply chain pertaining to the grow lights ecosystem, along with the average selling prices of grow light solutions
- To strategically analyze the ecosystem, tariffs and regulations, patent landscape, Porter’s five forces, import and export scenarios, trade landscape, and case studies pertaining to the market under study
- To strategically analyze micromarkets1 with regard to individual growth trends, prospects, and contributions to the overall market
- To analyze opportunities in the market for stakeholders by identifying high-growth segments
- To provide details of the competitive landscape for market leaders
- To analyze competitive developments such as product launches & developments, partnerships, agreements, and acquisitions in the grow lights market
- To profile key players in the grow lights market and comprehensively analyze their market ranking based on their revenues, market shares, and core competencies2
- To provide updated market developments of profiled players. The current report includes the market developments from January 2023 to May 2024
Available Customizations:
With the given market data, MarketsandMarkets offers customizations according to the specific requirements of companies. The following customization options are available for the report:
- Country-wise Information for Asia Pacific
- Detailed analysis and profiling of additional market players (up to five)
Get the Full Grow Lights Market Report
Full forecast, segment splits, and company analysis for all Grow Lights Market.
- Canada Grow Lights Market
- Mexico Grow Lights Market
- US Grow Lights Market
- Germany Grow Lights Market
- Netherlands Grow Lights Market
- Rest Of Europe Grow Lights Market
- Scandinavia Grow Lights Market
- UK Grow Lights Market
- Australia Grow Lights Market
- China Grow Lights Market
- Japan Grow Lights Market
- Rest Of Asia Pacific Grow Lights Market
- Southeast Asia Grow Lights Market
Need a Tailored Report?
Customize this report to your needs
Get 10% FREE Customization
Customize This Report
