
US IR Spectroscopy Market (2024-2029)

The US IR Spectroscopy Market was valued at $410.3 Million in 2024 and projected to reach to $577 Million by 2029, representing a compound annual growth rate of 7.1%. The US IR Spectroscopy Market is positioned for sustained growth through 2029, driven by continued investments in semiconductor manufacturing and electronics production.


| Market Size in | USD 26.32 MN |
| Market Forecast in | |
| CAGR | |
| Forecast Period | |
| Units Considered | Value (USD MN) |
US IR Spectroscopy Market Trends and Insights
- The US market benefits from strong semiconductor and electronics manufacturing capabilities, coupled with increasing demand for advanced analytical instrumentation in quality control and materials characterization.
- In 2024, the US established itself as a leading regional hub for IR spectroscopy adoption, driven by investments in R&D and stringent regulatory requirements across pharmaceutical, chemical, and semiconductor industries. By 2029, the US IR Spectroscopy Market is expected to experience sustained expansion as industries increasingly rely on infrared spectroscopy for non-destructive testing and real-time process monitoring.
- The US market growth is supported by technological advancements in portable and automated IR systems, rising adoption in academic research institutions, and the growing emphasis on quality assurance in manufacturing.
- The US continues to lead in innovation and deployment of next-generation IR spectroscopy solutions across multiple end-use sectors..
Key Market Statistics
- CAGR (2024-2029) 7.1% CAGR
- Market Size, 2024 ~USD 410.3 Million
- Forecast, 2029 ~USD 577 Million
- Country US
US IR Spectroscopy Market Overview
Market Valuation :
The US IR Spectroscopy Market is valued at $410.3 million in 2024, with strong growth trajectory driven by domestic semiconductor and electronics manufacturing sectors.
Robust Growth Rate :
The US market is expanding at a CAGR of 7.1% from 2024 to 2029, outpacing the global average of 6.5%, reflecting stronger regional demand and technological adoption.
Manufacturing Excellence :
Advanced semiconductor fabrication facilities and electronics manufacturers across the US drive consistent demand for IR spectroscopy instruments in quality assurance and process control.
Analytical Instrumentation Demand :
Increasing adoption of IR spectroscopy for materials characterization, contamination detection, and compliance testing in US industrial and research laboratories supports sustained market expansion.
US IR Spectroscopy Market Dynamics
- The region's advanced industrial infrastructure and emphasis on quality control standards create consistent demand for sophisticated analytical instruments.
- Technological innovations in portable and real-time spectroscopy solutions are expanding applications across manufacturing, pharmaceuticals, and research institutions. Key growth drivers include increasing regulatory compliance requirements, expansion of semiconductor fabrication capacity, and rising adoption of Industry 4.0 practices.
- The US market's outperformance relative to global growth rates reflects strong domestic R&D spending and the presence of leading instrument manufacturers.
- Strategic investments in advanced materials research and nanotechnology further support long-term market expansion through 2029..
Market Ecosystem
Related Ecosystem
Electronics System And Components
- Sensors
- Temperature Sensors
- Pressure Sensors
- Actuators
- Image Sensors
- Lenovo
- Samsung
- Texas Instruments Incorporated
- HONEYWELL INTERNATIONAL INC.
- Teledyne Technologies Incorporated
Security And Surveillance
- Face Recognition
- Video Surveillance as A Service (VSaaS)
- Voice Recognition
- Fingerprint Recognition
- IRIS Recognition
- HONEYWELL INTERNATIONAL INC.
- Thales group
- HID-GLOBAL
- Lenovo
- AXIS COMMUNICATIONS
Testing Inspection And Certification
- Eddy Current Testing (ECT)
- Safety Testing
- Signal Generators
- Acoustic Emission Testing (AET)
- Automated Test Equipment
- Sgs s.a.
- Intertek Group plc
- Bureau veritas s.a.
- TUV RHEINLAND AG
- TUV SUD AG
Key Takeaways
- The US IR Spectroscopy Market is valued at $410.3 million in 2024 and is forecast to reach $577.0 million by 2029, growing at a 7.1% CAGR.
- The US market is driven by strong demand from semiconductor, pharmaceutical, and chemical industries requiring advanced analytical capabilities.
- Technological innovations in portable and automated IR systems are accelerating adoption across the US market.
- The US maintains a competitive advantage through robust R&D infrastructure and stringent quality control standards in manufacturing.
IR Spectroscopy Market Report Scope
| Report Metric | Details |
|---|---|
| Base Year | 2024 |
| Fastest Growing Segment | FAR-INFRARED SPECTROSCOPY (Type) |
| Forecast Period | 2024-2029 |
| Growth Rate | CAGR of 6.5% from 2024 to 2029 |
| Largest Segment | FOURIER TRANSFORM INFRARED SPECTROSCOPY (Technology) |
| Market Size Base Year (Billions) | ~USD 1.17 (2024) |
| Revenue Forecast (Billions) | ~USD 1.6 (2029) |
| Segments Covered | Technology, Product Type, Type, End User |
US IR Spectroscopy Market Report Segmentation
4 segment dimensions are covered across the global market.
By Technology
- Dispersive Infrared Spectroscopy
- Fourier Transform Infrared Spectroscopy
By Product Type
- Benchtop Spectroscopes
- Hyphenated Spectroscopes
- Micro Spectroscopes
- Portable Spectroscopes
By Type
- Far-Infrared Spectroscopy
- Mid-Infrared Spectroscopy
- Near-Infrared Spectroscopy
By End User
- Biomedical Research & Biomaterials
- Chemicals
- Consumer Electronics
- Environmental
- Food & Beverages
- Healthcare & Pharmaceuticals
Target Audience
- Semiconductor Manufacturers : US-based semiconductor fabrication plants require detailed market intelligence to optimize procurement strategies for IR spectroscopy instruments and plan capital equipment investments.
- Electronics OEMs : Original equipment manufacturers in the US electronics sector need market forecasts to align quality control infrastructure with production scaling and regulatory compliance requirements.
- Analytical Instrument Vendors : Manufacturers and distributors of spectroscopy equipment require US-specific market data to identify growth opportunities, target customer segments, and develop region-appropriate product strategies.
- Research & Development Institutions : US universities, national laboratories, and private research organizations need market insights to justify equipment budgets and understand emerging applications in materials science and nanotechnology.
- Investment & Strategy Consultants : Financial analysts, private equity firms, and management consultants require accurate US market data to evaluate investment opportunities and advise clients on sector positioning.
Reasons to Buy this Report
- Regional Market Specificity : Gain detailed insights exclusive to the US market, including localized growth drivers, regulatory landscape, and competitive dynamics specific to American semiconductor and electronics sectors.
- Accurate Forecasting Data : Access precise market projections from $410.3M (2024) to $577.0M (2029) with 7.1% CAGR, enabling confident strategic planning and investment decisions for US operations.
- Competitive Intelligence : Understand the US competitive landscape, identify key market players, and benchmark your position against regional leaders in IR spectroscopy instrumentation and services.
- Industry Application Insights : Discover specific use cases and applications driving demand across US semiconductor manufacturing, electronics production, pharmaceuticals, and research institutions.
- Strategic Investment Guidance : Make informed decisions on market entry, expansion, or product development in the US with comprehensive analysis of growth opportunities and market dynamics through 2029.
Frequently asked questions
What is the current size of the US IR Spectroscopy Market?
The US IR Spectroscopy Market is valued at $410.3 million in 2024.
What is the projected size of the US IR Spectroscopy Market by 2029?
The US IR Spectroscopy Market is projected to reach $577.0 million by 2029.
What is the growth rate of the US IR Spectroscopy Market?
The US IR Spectroscopy Market is expected to grow at a CAGR of 7.1% from 2024 to 2029.
Which industries drive demand in the US IR Spectroscopy Market?
The US market is primarily driven by semiconductor, pharmaceutical, chemical, and materials science industries requiring advanced analytical instrumentation.
What factors are contributing to growth in the US IR Spectroscopy Market?
Growth in the US market is driven by technological advancements, increasing R&D investments, stringent regulatory requirements, and rising adoption of non-destructive testing methods.
RESEARCH METHODOLOGY
The study involved four major activities in estimating the size of the IR spectroscopy market. Exhaustive secondary research has been carried out to collect information on the market, the peer markets, and the parent market. Both top-down and bottom-up approaches have been employed to estimate the total market size. Market breakdown and data triangulation methods have also been used to estimate the market for segments and subsegments.
Secondary Research
Revenues of companies offering IR spectroscopy systems have been obtained from the secondary data available through paid and unpaid sources. The revenues have also been derived by analyzing the product portfolio of key companies, and these companies have been rated according to the performance and quality of their products.
In the secondary research process, various sources have been referred to for identifying and collecting information for this study on the IR spectroscopy market. Secondary sources considered for this research study include government sources, corporate filings, and trade, business, and professional associations. Secondary data has been collected and analyzed to arrive at the overall market size, which has been further validated through primary research.
Secondary research has been mainly used to obtain key information about the supply chain of IR spectroscopy systems to identify key players based on their products and prevailing industry trends in the IR spectroscopy market by technology, type, product type, end-user industry, and region. Secondary research also helped obtain market information- and technology-oriented key developments undertaken by market players to expand their presence and increase their market share.
Primary Research
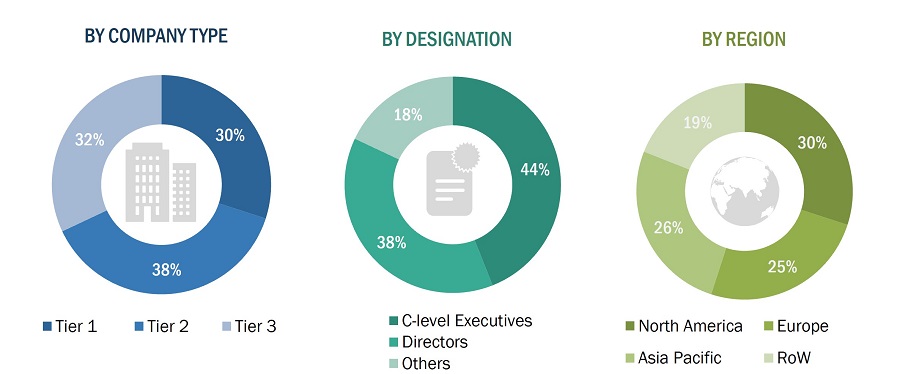
Extensive primary research has been conducted after understanding and analyzing the current scenario of the IR spectroscopy market through secondary research. Several primary interviews have been conducted with the key opinion leaders from the demand and supply sides across four main regions—North America, Europe, Asia Pacific, and the Rest of Europe. Approximately 25% of the primary interviews were conducted with the demand-side respondents, while approximately 75% were conducted with the supply-side respondents. The primary data has been collected through questionnaires, emails, and telephone interviews.
After interacting with industry experts, brief sessions were conducted with highly experienced independent consultants to reinforce the findings from our primary. This, along with the in-house subject matter experts’ opinions, has led us to the findings as described in the remainder of this report. The breakdown of primary respondents is as follows:
To know about the assumptions considered for the study, download the pdf brochure
Market Size Estimation
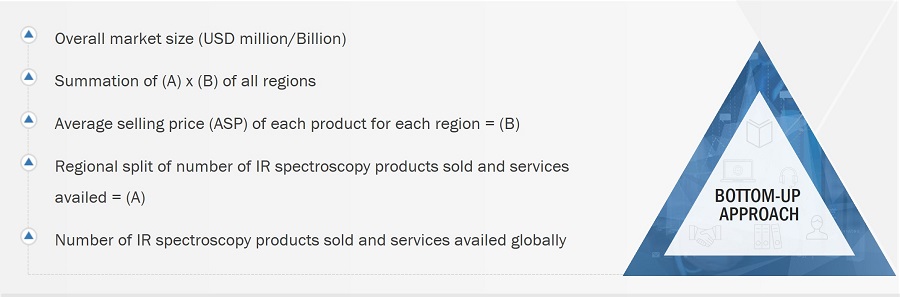
The bottom-up procedure has been employed to arrive at the overall size of the IR spectroscopy market.
- Identifying end-use industries wherein IR spectroscopy systems are deployed or are expected to use
- Analyzing major providers of IR spectroscopy equipment’s and original equipment manufacturers (OEMs), as well as studying their portfolios and understanding different technologies used
- Analyzing the average selling price of IR spectroscopy systems powered by different technologies
- Arriving at the market estimates by analyzing the revenue of companies and then combining these figures to arrive at the market size
- Studying various paid and unpaid sources, such as annual reports, press releases, white papers, and databases, to gather the required information
- Tracking the ongoing developments and identifying the upcoming developments in the market that include investments, research and development activities, product launches, contracts, collaborations, and partnerships undertaken, and forecasting the market size based on these developments
- Carrying out multiple discussions with key opinion leaders to understand the types of IR spectroscopy products, services, and software designed and developed, thereby analyzing the break-up of the scope of work carried out by the major companies in the IR spectroscopy market
- Arriving at the market estimates by analyzing the revenue generated by key companies providing IR spectroscopy products on the basis of their locations (countries) and then combining the market size for each country to get the market estimate by region
- Verifying and crosschecking the estimates at every level by discussing with key opinion leaders, including CXOs, directors, and operation managers, and then finally with the domain experts at MarketsandMarkets
- Studying various paid and unpaid sources of information, such as annual reports, press releases, white papers, and databases
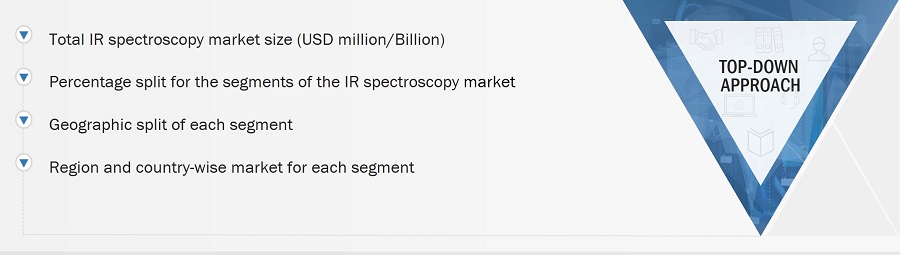
The top-down approach has been used to estimate and validate the total size of the IR spectroscopy market.
- Focusing on top-line investments and expenditures being made in the ecosystems of various applications
- Calculating the market size, considering revenues from major players through the cost of IR spectroscopy systems
- Segmenting each application of the IR spectroscopy system in each region and deriving the global market size based on the region
- Acquiring and analyzing information related to revenues generated by players through their crucial product offerings
- Conducting multiple on-field discussions with key opinion leaders involved in developing various IR spectroscopy solutions
- Estimating geographical splits by using secondary sources on the basis of various factors, such as the number of players in a specific country and region, types of IR spectroscopy products/solutions, and levels of services offered across several end-user industries
Data Triangulation
After arriving at the overall market size-using the market size estimation processes as explained above-the market has been split into several segments and subsegments. To complete the entire market engineering process and arrive at the exact statistics of each market segment and subsegment, data triangulation and market breakdown procedures have been employed, wherever applicable. The data has been triangulated by studying various factors and trends from the demand and supply sides in the IR spectroscopy market.
Market Definition
IR spectroscopes operate in the IR region of the electromagnetic spectrum used for the study and identification of chemical compounds in a sample, which can be either be in the gaseous, liquid, or solid form. In IR spectroscopy, IR light interacts with matter to identify the composition of the materials using three ways of measurement: reflection, emission, and absorption, for quality control and other applications. IR spectroscopy is used in various verticals, such as biological research, healthcare & pharmaceuticals, and food & beverages, to study and check the quality of materials produced during the manufacturing process. The instruments used for IR spectroscopy include IR spectrometers or spectrophotometers. IR spectroscopy works in the IR spectrum, which can be further divided into near-infrared (NIR), mid-infrared (MIR), and far-infrared (FIR).
Key Stakeholders
- Raw material and manufacturing equipment suppliers
- Semiconductor wafer vendors
- Original equipment manufacturers (OEMs)
- Original design manufacturers (ODMs) and OEM technology solution providers
- Networking solutions providers
- Distributors and retailers
- Research organizations
- Technology standards organizations, forums, alliances, and associations
- End users
- Technical universities
- Government/private research institutes
- Market research and consulting firms
Report Objectives
- To describe and forecast the size of the IR spectroscopy market, by type, technology, product type, end-user industry, and region, in terms of value
- To describe and forecast the market size of various segments across four key regions—North America, Europe, Asia Pacific, and Rest of the World (RoW), in terms of value
- To forecast the size of the IR spectroscopy market by product type, in terms of volume
- To provide detailed information regarding the drivers, restraints, opportunities, and challenges influencing the growth of the IR spectroscopy market
- To analyze the IR spectroscopy value chain and ecosystem, along with the average selling price of IR spectroscopy systems
- To strategically analyze the regulatory landscape, tariff, standards, patents, Porter’s five forces, import and export scenarios, trade values, and case studies pertaining to the market under study
- To strategically analyze micromarkets1 with regard to individual growth trends, prospects, and contributions to the overall market
- To analyze opportunities in the market for stakeholders by identifying high-growth segments
- To provide details of the competitive landscape for market leaders
- To analyze strategies such as product launches, expansion, collaborations, acquisitions, partnerships, and expansions adopted by players in the IR spectroscopy market
- To profile key players in the IR spectroscopy market and comprehensively analyze their market ranking based on their revenue, market share, and core competencies2
Available customizations:
With the given market data, MarketsandMarkets offers customizations according to the specific requirements of companies. The following customization options are available for the report:
- Detailed analysis and profiling of additional market players based on various blocks of the supply chain
Get the Full IR Spectroscopy Market Report
Full forecast, segment splits, and company analysis for all IR Spectroscopy Market.
- Canada IR Spectroscopy Market
- Mexico IR Spectroscopy Market
- Germany IR Spectroscopy Market
- UK IR Spectroscopy Market
- France IR Spectroscopy Market
- Italy IR Spectroscopy Market
- Rest Of Europe IR Spectroscopy Market
- China IR Spectroscopy Market
- Japan IR Spectroscopy Market
- India IR Spectroscopy Market
- South Korea IR Spectroscopy Market
- Rest Of Asia Pacific IR Spectroscopy Market
Need a Tailored Report?
Customize this report to your needs
Get 10% FREE Customization
Customize This Report
