
Rest Of Europe Knowledge Graph Market (2026-2031)

The Rest Of Europe Knowledge Graph Market was valued at $117.18 Million in 2026 and projected to reach to $491.01 Million by 2031, representing a compound annual growth rate of 27.0%. Rest Of Europe's Knowledge Graph Market is positioned for substantial growth through 2031, driven by accelerating digital transformation across enterprise, financial services, and healthcare sectors.


| Market Size in | USD 26.32 MN |
| Market Forecast in | |
| CAGR | |
| Forecast Period | |
| Units Considered | Value (USD MN) |
Rest Of Europe Knowledge Graph Market Trends and Insights
- This 27.0% compound annual growth rate reflects strong regional adoption of knowledge graph technologies across enterprise, financial services, and healthcare sectors.
- Rest Of Europe is capitalizing on digital transformation initiatives and increased investment in AI-driven data management solutions. The market in Rest Of Europe is driven by growing demand for semantic search, enhanced data interoperability, and intelligent automation capabilities.
- Rest Of Europe's enterprises are increasingly recognizing the strategic value of knowledge graphs in improving customer experiences and operational efficiency.
- Between 2026 and 2031, Rest Of Europe is expected to see accelerated deployment across mid-market and large-scale organizations seeking competitive advantages through advanced data intelligence..
Key Market Statistics
- CAGR (2026-2031) 27.0% CAGR
- Market Size, 2026 ~USD 117.18 Million
- Forecast, 2031 ~USD 491.01 Million
- Country Rest Of Europe
Rest Of Europe Knowledge Graph Market Overview
Strong Regional Growth Trajectory :
Rest Of Europe's Knowledge Graph Market is expanding at 27% CAGR, growing from $117.18 million in 2026 to $491.01 million by 2031, demonstrating accelerating adoption across the region.
Enterprise Digital Transformation :
Organizations across Rest Of Europe are increasingly implementing knowledge graph solutions to enhance data integration, improve decision-making, and streamline enterprise operations amid ongoing digital transformation initiatives.
Sector-Specific Expansion :
Financial services and healthcare sectors in Rest Of Europe are leading knowledge graph adoption, leveraging the technology for risk management, customer insights, and clinical decision support systems.
Outpacing Global Growth :
Rest Of Europe's 27% CAGR, while strong, reflects regional momentum distinct from the global market's 31.6% growth rate, indicating unique market dynamics and localized adoption patterns.
Rest Of Europe Knowledge Graph Market Dynamics
- Organizations are increasingly recognizing knowledge graphs' value in data management, semantic search, and AI-powered analytics, creating robust demand for advanced solutions tailored to regional regulatory and operational requirements. The region's growth trajectory reflects strong investment in emerging technologies and data-driven decision-making frameworks.
- As enterprises prioritize data governance and interoperability, knowledge graph adoption will expand beyond early adopters into mainstream business operations.
- Regional players and global vendors are capitalizing on this momentum by developing localized solutions addressing specific industry needs and compliance standards across Rest Of Europe..
Market Ecosystem

KNOWLEDGE GRAPH MARKET: COMMERCIAL USE CASES ACROSS INDUSTRIES
| COMPANY | USE CASE DESCRIPTION | BENEFITS |
|---|---|---|
 |
Neo4j supported UBS in implementing a knowledge graph platform to enhance fraud detection and customer data analysis. The solution connected transaction data, customer profiles, and behavioral patterns, enabling real-time detection of suspicious activities and improved risk assessment across financial operations. | Reduced fraud risk | Real-time anomaly detection | Improved customer insights | Enhanced regulatory compliance |
 |
TigerGraph collaborated with Intuit to develop a knowledge graph-based fraud detection system for its financial services platform. The implementation enabled the integration of large-scale transactional and user data, allowing faster identification of fraud patterns and improving decision-making accuracy. | Faster fraud detection | Scalable data processing | Improved decision accuracy | Reduced financial loss |
 |
AWS supported Zalando by implementing a knowledge graph using Amazon Neptune to power product recommendations and personalization. The system connected product data, user behavior, and inventory information to deliver more accurate and context-aware recommendations. | Improved recommendation accuracy | Enhanced customer experience | Increased conversion rates | Scalable infrastructure |
Logos and trademarks shown above are the property of their respective owners. Their use here is for informational and illustrative purposes only.
Related Ecosystem
Analytics
- Natural Language Processing (NLP)
- Machine Learning
- Supply Chain Management
- Predictive Analytics
- Image Sensors
- International Business Machines Corporation
- MICROSOFT CORPORATION
- Oracle Corporation
- SAP SE
Software And Services
- Natural Language Processing (NLP)
- Machine Learning
- Supply Chain Management
- Predictive Analytics
- Image Sensors
- International Business Machines Corporation
- MICROSOFT CORPORATION
- Oracle Corporation
- SAP SE
- Amazon.com, Inc.
Key Takeaways
- Rest Of Europe's Knowledge Graph Market will grow from $117.18M (2026) to $491.01M (2031), representing a 27.0% CAGR.
- Rest Of Europe is witnessing accelerated enterprise adoption driven by digital transformation and AI integration priorities.
- Rest Of Europe's market expansion is supported by increasing demand for semantic search and intelligent data management solutions.
- Rest Of Europe's mid-market and large enterprises are primary growth drivers, seeking competitive advantages through knowledge graph deployment.
Knowledge Graph Market Report Scope
| Report Metric | Details |
|---|---|
| Base Year | 2026 |
| Fastest Growing Segment | OTHER MODEL TYPE (Model Type) |
| Forecast Period | 2026–2031 |
| Growth Rate | CAGR of 31.6% from 2026 to 2031 |
| Largest Segment | SOLUTIONS (Offering) |
| Market Size Base Year (Billions) | ~USD 1.9 (2026) |
| Revenue Forecast (Billions) | ~USD 7.51 (2031) |
| Segments Covered | Offering, Solution, Service, Model Type, Application, Vertical |
Rest Of Europe Knowledge Graph Market Report Segmentation
6 segment dimensions are covered across the global market.
By Offering
- Services
- Solutions
By Solution
- Enterprise Knowledge Graph Platform
- Enterprise Knowledge Graph Platforms
- Graph Database Engine
- Graph Database Engines
- Knowledge Management Toolset
- Knowledge Management Toolsets
By Service
- Managed Services
- Professional Services
By Model Type
- Labeled Property Graph
- Labeled Property Graph (Lpg)
- Other Model Type
- Other Model Types
- Resource Description Framework (Rdf) Triple Stores
By Application
- Data Analytics & Business Intelligence
- Data Governance & Master Data Management
- Infrastructure & Asset Management
- Knowledge & Content Management
- Market & Customer Intelligence And Sales Optimization
- Other Applications
- Process Optimization & Resource Management
- Product & Configuration Management
- Risk Management, Compliance, And Regulatory Reporting
- Virtual Assistants, Self-Service Data, And Digital Asset Discovery
By Vertical
- Banking, Financial Services, And Insurance (Bfsi)
- Energy, Utilities, And Infrastructure
- Government
- Healthcare, Life Sciences, And Pharmaceuticals
- Manufacturing & Automotive
- Media & Entertainment
- Other Verticals
- Retail & Ecommerce
- Telecom & Technology
- Transportation & Logistics
- Travel & Hospitality
Target Audience
- Enterprise Technology Leaders : CIOs and technology executives in Rest Of Europe need regional market intelligence to evaluate knowledge graph solutions, benchmark adoption rates, and align technology investments with regional growth trends.
- Financial Services Institutions : Banks, insurance companies, and fintech firms across Rest Of Europe require sector-specific insights on knowledge graph applications for risk management, compliance, and customer analytics.
- Healthcare & Life Sciences Organizations : Healthcare providers and pharmaceutical companies in Rest Of Europe need data on knowledge graph adoption for clinical decision support, drug discovery, and patient data management solutions.
- Software Vendors & Solution Providers : Knowledge graph platform vendors and system integrators targeting Rest Of Europe need regional market forecasts, competitive analysis, and customer segment data to optimize product positioning and sales strategies.
- Investment & Strategy Consultants : Private equity firms, management consultants, and strategic advisors require detailed Rest Of Europe market analysis to support M&A decisions, portfolio company growth strategies, and client advisory services.
Key Companies in the Rest Of Europe Knowledge Graph Market
| Company | HQ | Ownership | Strongest segments |
|---|---|---|---|
| IBM | United States | Public Company | Software (Hybrid Cloud and AI Platforms),Consulting,Infrastructure, |
| MICROSOFT | United States | Public Company | Productivity and Business Processes,Intelligent Cloud (Azure, Server, GitHub, Nuance),Personal Computing (Windows, Devices, Gaming, Ads), |
| SAP | Germany | Public Company | SAP S/4HANA and core ERP finance/supply chain,Human Experience Management (SAP SuccessFactors and payroll/time),Business Technology Platform and integration/automation, |
| ORACLE | United States | Public Company | Cloud applications (Fusion ERP/EPM/SCM/HCM, NetSuite, Oracle Health, CX),Database and middleware (Oracle Database, MySQL, Java, middleware tools),Cloud infrastructure (compute, storage, networking, AI/ML, IoT, blockchain), |
| FRANZ INC. | Germany | Private Investment Firm | Health and well-being,Recycling and environmental protection services,Climate-neutral energy production & renewable energies, |
| ALTAIR | United States | Private Company | CAE and Multidisciplinary Simulation (HyperWorks and related),Data Analytics and AI (Altair RapidMiner and services),HPC, Cloud, and Altair One Platform, |
| PROGRESS SOFTWARE CORPORATION | United States | Public Company | Application Development & Digital Experience (OpenEdge, Sitefinity, Developer Tools),Managed & Secure File Transfer (MOVEit, Automate MFT, ShareFile),Data Connectivity & Agility (DataDirect, MarkLogic, Semaphore), |
IBM
IBM is a public company founded in 1911 in the United States with 264,300 employees.
MICROSOFT
Microsoft is a public company founded in 1975 in the United States with 228,000 employees.
SAP
SAP is a public company founded in 1972 in Germany with 111,038 employees.
ORACLE
Oracle is a public company founded in 1977 in the United States with 141,000 employees.
FRANZ INC.
Franz Inc. is a private investment firm founded in 1756 in Germany with 21,685 employees.
ALTAIR
Altair is a private company founded in 1985 in the United States with 3,500 employees.
PROGRESS SOFTWARE CORPORATION
Progress Software Corporation is a public company founded in 1981 in the United States with 2,801 employees.
Reasons to Buy this Report
- Regional Market Sizing & Forecasts : Obtain precise market valuations specific to Rest Of Europe with detailed projections through 2031, enabling accurate budget allocation and investment planning for regional expansion strategies.
- Sector-Specific Insights : Understand knowledge graph adoption patterns across enterprise, financial services, and healthcare sectors in Rest Of Europe, identifying high-opportunity verticals for targeted product development and go-to-market strategies.
- Competitive Landscape Analysis : Gain intelligence on regional market dynamics, competitive positioning, and emerging players specific to Rest Of Europe, supporting strategic decision-making and market entry planning.
- Growth Driver Identification : Identify key drivers of the 27% CAGR in Rest Of Europe including digital transformation initiatives, regulatory requirements, and technology adoption trends shaping regional demand.
- Investment & Partnership Opportunities : Discover high-potential investment targets, partnership opportunities, and customer segments within Rest Of Europe's rapidly expanding knowledge graph ecosystem through 2031.
Frequently asked questions
What is the current market size of Knowledge Graphs in Rest Of Europe?
Rest Of Europe's Knowledge Graph Market was valued at $117.18 million in 2026 and is projected to grow to $491.01 million by 2031.
What is the expected growth rate for Rest Of Europe's Knowledge Graph Market?
Rest Of Europe's Knowledge Graph Market is expected to grow at a compound annual growth rate (CAGR) of 27.0% from 2026 to 2031.
Which industries in Rest Of Europe are driving Knowledge Graph adoption?
Rest Of Europe's enterprise, financial services, and healthcare sectors are primary drivers of Knowledge Graph adoption, supported by digital transformation initiatives.
What are the key factors fueling growth in Rest Of Europe's Knowledge Graph Market?
Rest Of Europe's market growth is driven by demand for semantic search, data interoperability, intelligent automation, and AI-driven enterprise solutions.
Which organization sizes in Rest Of Europe are adopting Knowledge Graphs most rapidly?
Rest Of Europe's mid-market and large-scale enterprises are leading Knowledge Graph adoption, seeking competitive advantages through advanced data intelligence capabilities.
RESEARCH METHODOLOGY
This research study involved the extensive use of secondary sources, directories, and databases, such as Dun & Bradstreet (D&B), Hoovers, and Bloomberg BusinessWeek, to identify and collect information useful for a technical, market-oriented, and commercial study of the Knowledge graph market. The primary sources have been mainly industry experts from the core and related industries and preferred suppliers, manufacturers, distributors, service providers, technology developers, alliances, and organizations related to all segments of the value chain of this market. In-depth interviews have been conducted with various primary respondents, including key industry participants, subject matter experts, C-level executives of key market players, and industry consultants, to obtain and verify critical qualitative and quantitative information.
Secondary Research
The market for companies offering knowledge graph solutions and services to different end users has been estimated and projected based on the secondary data made available through paid and unpaid sources, and by analyzing their product portfolios in the ecosystem of the knowledge graph market. In the secondary research process, various sources such as JAX Magazine, International Journal of Electrical and Computer Engineering (IJECE), and Frontiers have been referred to for identifying and collecting information for this study on the Knowledge graph market. The secondary sources included annual reports, press releases, investor presentations of companies, white papers, journals, certified publications, and articles by recognized authors, directories, and databases. Secondary research has been mainly used to obtain essential information about the supply chain of the market, the total pool of key players, market classification, segmentation according to industry trends to the bottommost level, regional markets, and key developments from both market- and technology-oriented perspectives that primary sources have further validated.
Primary Research
In the primary research process, various primary sources from both the supply and demand sides were interviewed to obtain qualitative and quantitative information on the market. The primary sources from the supply side included various industry experts, including Chief Experience Officers (CXOs); Vice Presidents (VPs); directors from business development, marketing, and product development/innovation teams; related critical executives from Knowledge graph service vendors, system Integrators, professional service providers, and industry associations; and key opinion leaders. Primary interviews were conducted to gather insights, such as market statistics, revenue data collected from services, market breakups, market size estimations, market forecasts, and data triangulation. Primary research also helped in understanding various trends related to technologies, applications, deployments, and regions. Stakeholders from the demand side, such as Chief Information Officers (CIOs), Chief Technology Officers (CTOs), Chief Strategy Officers (CSOs), and end users using knowledge graph services, were interviewed to understand the buyer’s perspective on suppliers, products, service providers, and their current usage of Knowledge graph services, which would impact the overall knowledge graph market.
BREAKDOWN OF PRIMARIES
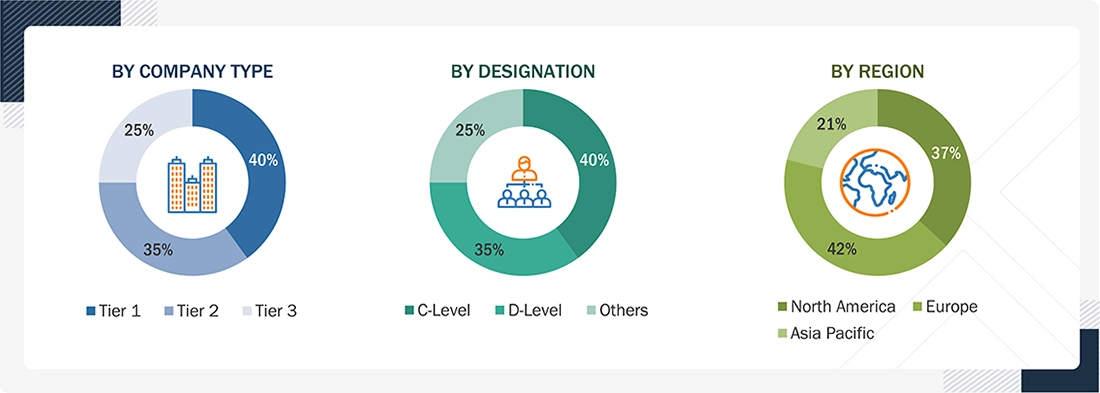
Note: Others include sales managers, marketing managers, and product managers.
To know about the assumptions considered for the study, download the pdf brochure
Market Size Estimation
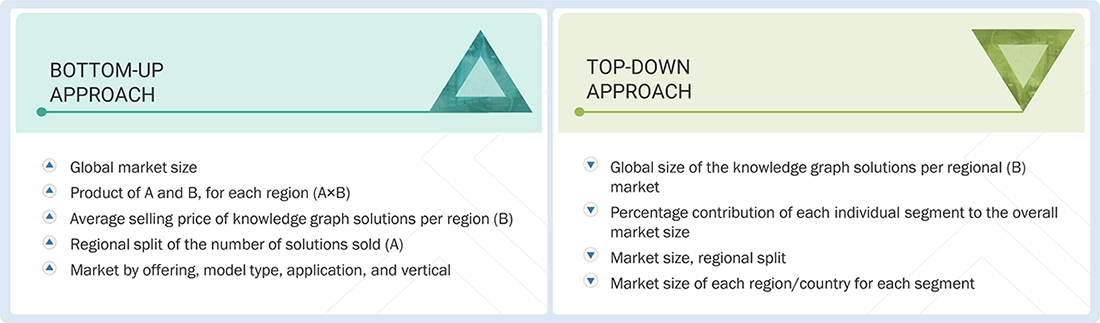
Multiple approaches were adopted to estimate and forecast the size of the knowledge graph market. The first approach involves estimating market size by summing up the revenue generated by companies through the sale of the knowledge graph solution and services.
Both top-down and bottom-up approaches were used to estimate and validate the total size of the Knowledge graph market. These methods were extensively used to estimate the size of various segments in the market. The research methodology used to estimate the market size includes the following:
- Key players in the market have been identified through extensive secondary research.
- In terms of value, the industry’s supply chain and market size have been determined through primary and secondary research processes.
- All percentage shares, splits, and breakups have been determined using secondary sources and verified through primary sources.
- After arriving at the overall market size, the knowledge graph market was divided into several segments and subsegments.
Data Triangulation
After arriving at the overall market size, the knowledge graph market was divided into several segments and subsegments.
The data was triangulated by studying various factors and trends from the demand and supply sides. Along with data triangulation and market breakdown, the market size was validated by the top-down and bottom-up approaches.
Market Definition
A knowledge graph is a type of database designed to store, query, and manage data in the form of nodes, edges, and properties. Nodes represent entities, edges capture relationships between them, and properties provide additional details. This structure enables efficient analysis of complex, interconnected data. It is widely used in scenarios like social networks, recommendation systems, and fraud detection.
Key Stakeholders
- Solution providers
- Technology vendors
- Enterprise buyers
- System integrators
- Consulting firms and sis
- Open-source communities
- Regulatory bodies
- Industry alliances
Report Objectives
- To determine, segment, and forecast the knowledge graph market based on offerings, type, application, vertical, and region in terms of value
- To forecast the size of the market segments with respect to five main regions: North America, Europe, Asia Pacific, the Middle East & Africa, and Latin America
- To provide detailed information about the major factors (drivers, restraints, opportunities, and challenges) influencing the growth of the market
- To study the complete value chain and related industry segments, and perform a value chain analysis of the market landscape
- To strategically analyze the macro and micromarkets with respect to individual growth trends, prospects, and contributions to the total market
- To analyze the industry trends, pricing data, patents, and innovations related to the market
- To analyze the opportunities for stakeholders by identifying the high-growth segments of the market
- To profile the key players in the market and comprehensively analyze their market share/ranking and core competencies
- To track and analyze competitive developments, such as mergers & acquisitions, product launches & developments, partnerships, agreements, collaborations, business expansions, and R&D activities.
Available customizations:
With the given market data, MarketsandMarkets offers customizations as per the company’s specific needs. The following customization options are available for the report:
- Country-wise information
- Analysis for additional countries (up to five)
Company Information
- Detailed analysis and profiling of additional market players (up to five)
Get the Full Knowledge Graph Market Report
Full forecast, segment splits, and company analysis for all Knowledge Graph Market.
- Canada Knowledge Graph Market
- US Knowledge Graph Market
- UK Knowledge Graph Market
- Italy Knowledge Graph Market
- China Knowledge Graph Market
- India Knowledge Graph Market
- UAE Knowledge Graph Market
- Brazil Knowledge Graph Market
- France Knowledge Graph Market
- Germany Knowledge Graph Market
- Spain Knowledge Graph Market
- Japan Knowledge Graph Market
- Rest Of Asia Pacific Knowledge Graph Market
- South Korea Knowledge Graph Market
Need a Tailored Report?
Customize this report to your needs
Get 10% FREE Customization
Customize This Report
