
North America LiDAR Simulation Market (2025-2030)

The North America LiDAR Simulation Market was valued at $328.6 Million in 2025 and projected to reach to $1425.2 Million by 2030, representing a compound annual growth rate of 23.3%. North America's LiDAR simulation market is poised for substantial growth through 2030, reaching $1,425.2 million as autonomous vehicle programs mature and regulatory frameworks tighten.


| Market Size in | USD 26.32 MN |
| Market Forecast in | |
| CAGR | |
| Forecast Period | |
| Units Considered | Value (USD MN) |
North America LiDAR Simulation Market Trends and Insights
- In 2025, North America's market is valued at $328.6 million, reflecting strong investment from automotive OEMs and technology providers across the United States and Canada.
- North America leads global adoption due to its mature automotive infrastructure, significant R&D spending, and concentration of autonomous vehicle testing programs. By 2030, North America's LiDAR simulation market is forecast to reach $1,425.2 million, representing a compound annual growth rate of 23.3%.
- This expansion reflects North America's critical role in validating sensor technologies before real-world deployment and the region's commitment to safety-first autonomous driving standards.
- North America's dominance is reinforced by partnerships between automotive manufacturers, simulation software vendors, and semiconductor companies, positioning the region as the primary hub for LiDAR simulation innovation through 2030..
Key Market Statistics
- CAGR (2025-2030) 23.3% CAGR
- Market Size, 2025 ~USD 328.6 Million
- Forecast, 2030 ~USD 1425.2 Million
- Geography North America
North America LiDAR Simulation Market Overview
Market Valuation :
North America's LiDAR simulation market reached $328.6 million in 2025, establishing the region as a critical hub for autonomous vehicle technology development and validation.
Aggressive Growth Trajectory :
With a 23.3% CAGR through 2030, North America's market is expanding faster than the global average of 23.1%, driven by concentrated OEM investment and regulatory compliance requirements.
Regulatory Momentum :
Advanced driver-assistance systems (ADAS) mandates across the U.S. and Canada are accelerating LiDAR simulation adoption as automakers require validated testing environments before real-world deployment.
OEM & Tech Provider Concentration :
Major automotive manufacturers and simulation software providers are heavily investing in North American facilities, creating a competitive ecosystem that drives innovation and market consolidation.
North America LiDAR Simulation Market Dynamics
- The region benefits from established automotive infrastructure, significant R&D budgets from leading OEMs, and proximity to technology innovation hubs.
- Increasing complexity in autonomous systems and the need for comprehensive validation across diverse driving conditions will sustain demand for advanced simulation platforms. The competitive landscape will intensify as both established simulation vendors and emerging startups target North American automotive clients.
- Investment in cloud-based and AI-enhanced simulation capabilities will differentiate market players.
- Strategic partnerships between OEMs, Tier-1 suppliers, and software developers will accelerate technology adoption, while regulatory harmonization between U.S.
- and Canadian standards will streamline market expansion across the region..
Market Ecosystem
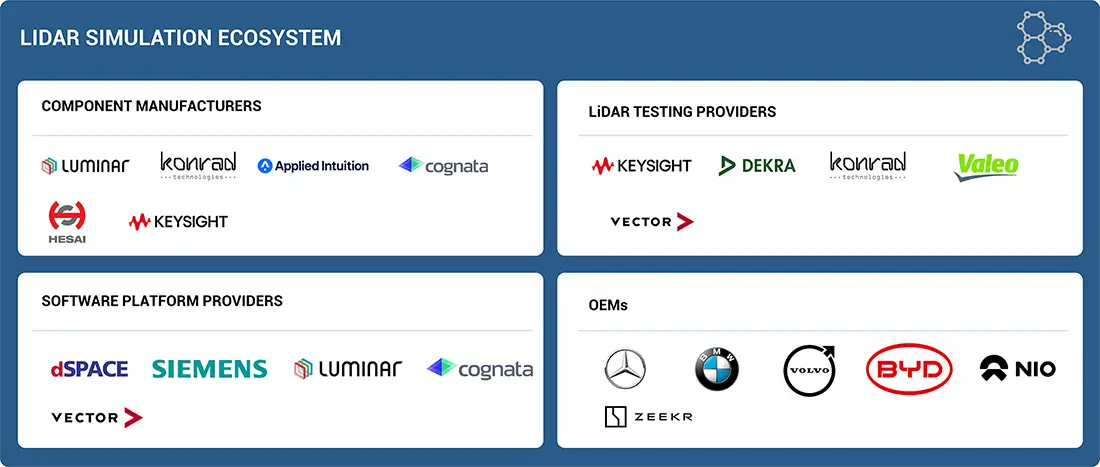
LiDAR Simulation Market: COMMERCIAL USE CASES ACROSS INDUSTRIES
| COMPANY | USE CASE DESCRIPTION | BENEFITS |
|---|---|---|
 |
Uses LiDAR simulation and validation services for ADAS and autonomous vehicle testing, including safety certification and compliance checks under real-world and virtual scenarios | Ensures vehicles meet regulatory standards, reduces physical testing costs, and accelerates homologation for global markets |
 |
Supplies high-performance long-range LiDAR (Iris, Hydra) and perception software for OEM integration, supported by virtual validation and OTA simulation for safety-critical applications | Delivers industry-leading range and resolution for highway autonomy, enables scalable deployment in production vehicles, and strengthens OEM trust in advanced autonomy programs |
 |
Provides LiDAR-in-the-loop (LiL) and LiDAR OTA simulation platforms for OEMs to validate perception algorithms, sensor fusion, and system safety in virtual environments | Cuts down development time, improves accuracy of ADAS features, and enables cost-efficient testing of edge cases not possible on-road |
 |
Develops automotive-grade solid-state LiDAR sensors (Valeo SCALA) and integrates them with simulation environments for ADAS and autonomous driving applications | Enables mass production of reliable LiDAR, enhances detection for safety systems, and strengthens Valeo’s role as a Tier-1 supplier for OEMs |
 |
Offers LiDAR sensors and perception software, integrated with digital twin and simulation platforms to validate autonomous driving under diverse traffic and weather conditions. Provides high-resolution, cost-effective LiDAR, accelerates adoption in EVs and robotaxis, and supports continuous OTA updates for perception improvement | Provides high-resolution, cost-effective LiDAR, accelerates adoption in EVs and robotaxis, and supports continuous OTA updates for perception improvement |
Logos and trademarks shown above are the property of their respective owners. Their use here is for informational and illustrative purposes only.
Related Ecosystem
Automotive Electronics And Electrical Equipment
- Battery Electric Vehicle (BEV)
- Light Commercial Vehicles (LCVs)
- Fuel Cell Electric Vehicle (FCEV)
- Sensors
- Hybrid Electric Vehicle (HEV)
- BOSCH LIMITED
- Continental ag
- DENSO Corporation
- Panasonic Holdings Corporation
- Texas Instruments Incorporated
Semi Autonomous And Autonomous Vehicle
- Light Commercial Vehicles (LCVs)
- Battery Electric Vehicle (BEV)
- Fuel Cell Electric Vehicle (FCEV)
- Internal Combustion Engine (ICE)
- Fuel Cell
- BOSCH LIMITED
- Visteon Corporation
- Continental ag
- DENSO Corporation
- Infineon technologies ag
Key Takeaways
- North America's LiDAR simulation market is valued at $328.6 million in 2025 and is projected to grow to $1,425.2 million by 2030, representing a 23.3% CAGR.
- North America leads global LiDAR simulation adoption due to its concentration of autonomous vehicle development programs and stringent safety regulations.
- The region's market growth is driven by OEM investment in sensor validation, simulation software advancement, and partnerships across the automotive and tech ecosystems.
- North America's mature infrastructure and regulatory environment position it as the primary testing ground for LiDAR technologies before global deployment.
LiDAR Simulation Market Report Scope
| Report Metric | Details |
|---|---|
| Base Year | 2025 |
| Fastest Growing Segment | LEVEL 4/5 (Level Of Autonomy) |
| Forecast Period | 2025-2030 |
| Growth Rate | CAGR of 23.1% from 2025 to 2030 |
| Largest Segment | PASSENGER CARS (Vehicle Type) |
| Market Size Base Year (Billions) | ~USD 0.94 (2025) |
| Revenue Forecast (Billions) | ~USD 2.65 (2030) |
| Segments Covered | Level Of Autonomy, Method, Laser Wavelength, Lidar Type, Vehicle Type |
North America LiDAR Simulation Market Report Segmentation
5 segment dimensions are covered across the global market.
By Level Of Autonomy
- Level 2/2.5
- Level 3
- Level 4/5
By Method
- Simulation Method
- Testing Method
By Laser Wavelength
- Long Wave Infrared Spectrum
- Short Wave Infrared Spectrum
By Lidar Type
- Mechanical Lidar
- Solid-State Lidar
By Vehicle Type
- Commercial Vehicles
- Passenger Cars
Target Audience
- Automotive OEMs : Major U.S. and Canadian automakers need detailed market intelligence to optimize LiDAR simulation investments, benchmark R&D spending against competitors, and accelerate autonomous vehicle time-to-market.
- Simulation Software Vendors : Established and emerging simulation platform providers require North America-specific market data to identify customer segments, forecast revenue potential, and develop region-tailored product strategies.
- Tier-1 Automotive Suppliers : Component and systems suppliers need insights into North American OEM simulation requirements to align their technology offerings, secure partnerships, and capture growing validation service opportunities.
- Technology Investors & PE Firms : Investment firms evaluating autonomous vehicle and simulation technology companies require North America market forecasts and growth drivers to assess portfolio companies and identify acquisition targets.
- Regulatory & Policy Bodies : Government agencies and standards organizations in the U.S. and Canada use market data to inform ADAS regulations, safety standards, and autonomous vehicle deployment policies affecting the region.
Countries within North America - compare and drill down
| Country | 2025 size (native) |
|---|
Country market size visualization
Reasons to Buy this Report
- Regional Market Sizing & Forecasts : Obtain precise valuation data for North America ($328.6M in 2025, $1,425.2M by 2030) with detailed CAGR analysis to benchmark competitive positioning and investment decisions specific to the region.
- Regulatory & Compliance Insights : Understand how U.S. and Canadian ADAS mandates are reshaping LiDAR simulation demand, enabling compliance-driven product development and go-to-market strategies tailored to North American requirements.
- OEM Investment Landscape : Identify major automotive manufacturers and technology providers investing in North American simulation capabilities, revealing partnership opportunities and competitive threats in the region's autonomous vehicle ecosystem.
- Technology Adoption Trends : Analyze North America-specific adoption patterns for cloud-based, AI-enhanced, and real-time LiDAR simulation platforms to inform product roadmaps and feature prioritization for regional customers.
- Strategic Growth Opportunities : Discover high-growth segments within North America's market, including emerging use cases in validation, testing, and certification, to guide expansion strategies and resource allocation decisions.
Frequently asked questions
What is the current size of North America's LiDAR simulation market?
North America's LiDAR simulation market is valued at $328.6 million in 2025, making it one of the largest regional markets globally.
What is the projected market size for North America's LiDAR simulation market by 2030?
North America's LiDAR simulation market is forecast to reach $1,425.2 million by 2030, growing at a 23.3% compound annual growth rate.
Why is North America a leader in LiDAR simulation technology?
North America leads due to its concentration of autonomous vehicle development programs, mature automotive infrastructure, significant R&D investment, and stringent safety regulations that drive simulation adoption.
What factors are driving growth in North America's LiDAR simulation market?
Key drivers include accelerating autonomous vehicle development, regulatory mandates for advanced driver-assistance systems, OEM sensor validation requirements, and partnerships between automotive and technology companies.
Which countries in North America are contributing most to market growth?
The United States is the primary contributor to North America's LiDAR simulation market growth, followed by Canada, driven by autonomous vehicle testing programs and automotive manufacturing hubs.
RESEARCH METHODOLOGY
The research study uses extensive secondary sources, such as company annual reports/presentations, industry association publications, magazine articles, directories, technical handbooks, World Economic Outlook, trade websites, technical articles, and databases, to identify and collect information on the LiDAR simulation market. Primary sources, such as experts from related industries, OEMs, and suppliers, were interviewed to obtain and verify critical information and assess the growth prospects and market estimations.
Secondary Research
Secondary sources for this research study included corporate filings, such as annual reports, investor presentations, and financial statements; trade, business, and professional associations; whitepapers and autonomous vehicles and ADAS-related journals; certified publications; articles by recognized authors; directories; and databases. Secondary data has been collected and analyzed to determine the overall market size, further validated by primary research.
Primary Research
After understanding the LiDAR simulation market scenario through secondary research, extensive primary research was conducted. Primary interviews were conducted with market experts from both the demand and supply sides across North America, Europe, and Asia Pacific. Approximately 20% of interviews were conducted from the demand side, while 80% of primary interviews were conducted from the supply side. The primary data was collected through questionnaires, emails, and telephone interviews.
In the canvassing of primaries, various departments within organizations, such as sales and operations, were covered to provide a holistic viewpoint in this report. Primary sources from the supply side included various industry experts, such as CXOs, vice presidents, directors from business development, marketing, product development/innovation teams, and related key executives from various key companies. Various system integrators, industry associations, independent consultants/industry veterans, and key opinion leaders were also interviewed.
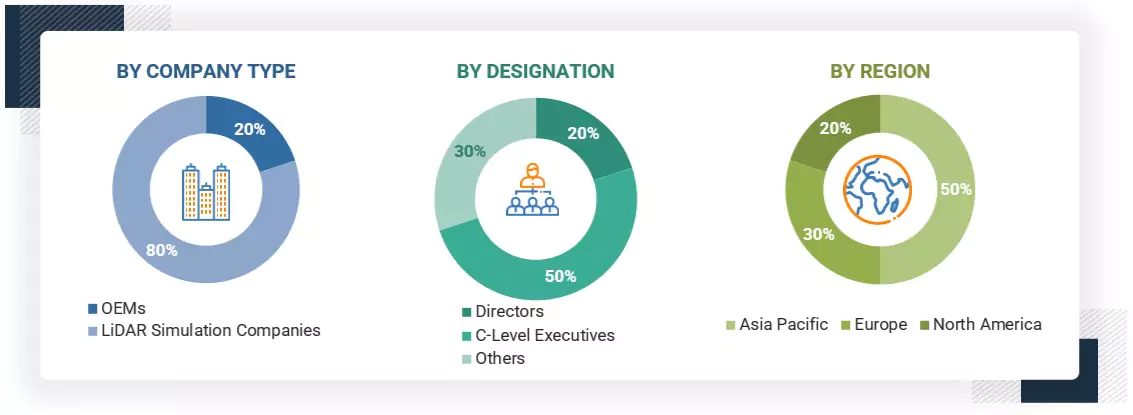
Note: Others include sales, managers, and product managers.
To know about the assumptions considered for the study, download the pdf brochure
Market Size Estimation
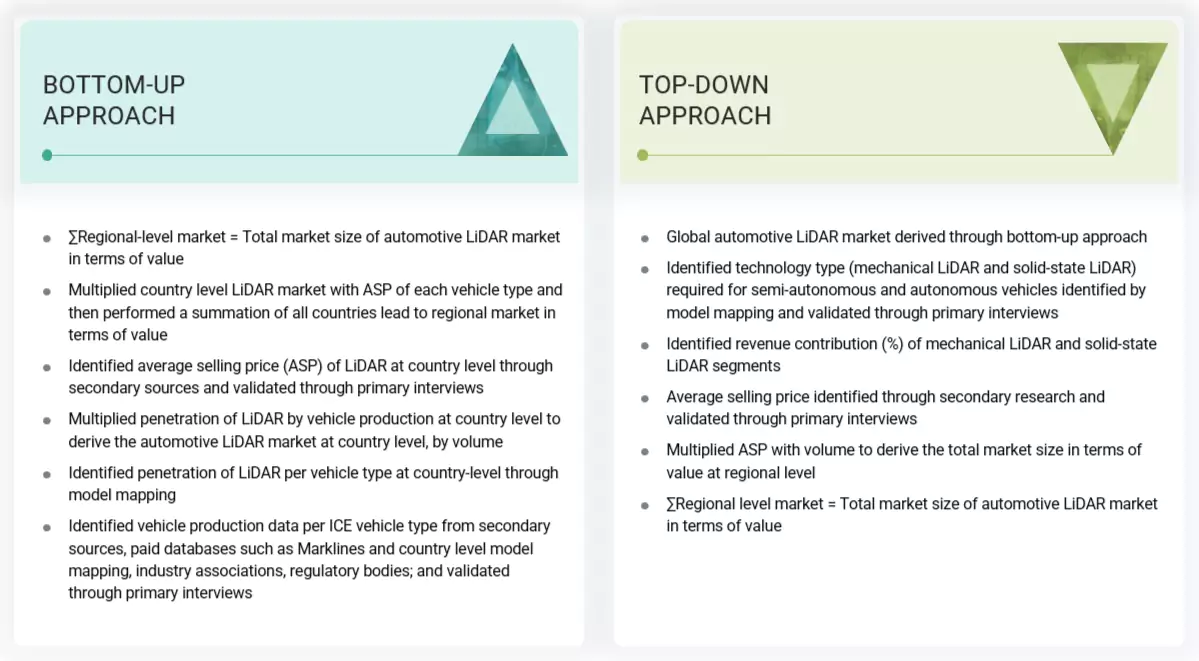
The top-down approach has been used to estimate and validate the LiDAR simulation market size. The LiDAR simulation market size, by region, was derived by mapping the key players from each region with their business segment’s revenue. The revenue of each key player from each region was mapped considering their test and simulation segment from their annual report and product portfolio (mechanical LiDAR and solid-state LiDAR) in terms of value (USD million). After this, all revenue from each region was summed to obtain the global market for LiDAR simulation. The industry experts then validated the revenue generated from each region. Additionally, the revenue forecast for testing and simulation was made considering different LiDAR types (mechanical and solid-state LiDAR), based on factors such as country-wise macroeconomic indicators, automotive industry growth, GDP growth, safety regulation, price of LiDAR components, future LiDAR adoption, and offerings in ADAS systems by the automakers, considering the regional mandates for safety.
The market size for LiDAR offered in each vehicle type was derived by mapping the LiDAR type offered in each vehicle type (passenger cars and commercial vehicles). To forecast the market’s revenue for the LiDAR type, the demand for LiDAR (mechanical and solid-state LiDAR) was derived considering the demand in vehicles, cost, maintenance, and technological advancements. Then, the market revenue split for different LiDAR types was derived and forecasted, which was then validated from the primaries. The segmental revenue for each LiDAR type was then derived by the summation of revenue from each LiDAR type. A similar approach was used for other segments, such as level of autonomy, method, and by vehicle type.
LiDAR Simulation Market : Top-Down and Bottom-Up Approach
Data Triangulation
After arriving at the overall market size of the global market through the methodology mentioned above, this market was split into several segments and subsegments. The data triangulation and market breakdown procedures were employed to complete the overall market engineering process and arrive at the exact market value data for key segments and sub-segments, wherever applicable. The extrapolated market data was triangulated by studying various macro indicators and regional trends from both the demand and supply-side participants.
Market Definition
According to Texas Instruments, LiDAR is a sensing technology that detects objects and maps their distances. The technology works by illuminating a target with an optical pulse and measuring the characteristics of the reflected return signal.
Stakeholders
- ADAS System Manufacturers
- Automobile Original Equipment Manufacturers (OEMs)
- Automotive Part Manufacturers’ Association (APMA)
- Automotive Component Manufacturers
- Governments, Financial Institutions, and Investment Communities
- European Automobile Manufacturers Association (ACEA)
- LiDAR Hardware Suppliers
- LiDAR Software Suppliers
- LiDAR System Integrators
- Manufacturers of Automotive LiDAR Microprocessors
- Original Device Manufacturer (ODM) and OEM Technology Solution Providers
- National Highway Traffic Safety Administration (NHTSA)
- Raw Material and Manufacturing Equipment Suppliers
- Research Institutes and Organizations
- Semiconductor Foundries
- Technology Investors
- Technology Standards Organizations, Forums, Alliances, and Associations
- Vehicle Safety Regulatory Bodies
Report Objectives
- To analyze and forecast the LiDAR simulation market in terms of value (USD Million) from 2025 to 2032
-
To analyze the LiDAR simulation market based on the following:
- By LiDAR Type (Mechanical LiDAR and Solid-state LiDAR)
- By Vehicle Type (Passenger Cars and Commercial Vehicles)
- By Level of Autonomy (Level 2/2.5, Level 3, and Level 4/5)
- By Method (Testing Method and Simulation Method)
- By Laser Wavelength (Short Wave Infrared Spectrum and Long Wave Infrared Spectrum)
- By Application (Intelligent Park Assist, Night Vision, Traffic Jam, Road Mapping & Localization, and Others)
- By Region (North America, Europe, and Asia Pacific)
- To identify and analyze key drivers, challenges, restraints, and opportunities influencing the market growth
- To strategically analyze the market for individual growth trends, prospects, and contributions to the total market
-
To study the following with respect to the market:
- Investment and Funding Scenario
- Supply Chain Analysis
- Ecosystem Analysis
- Technology Analysis
- Case Study Analysis
- Patent Analysis
- Regulatory Landscape
- Key Stakeholders and Buying Criteria
- Key Conferences and Events
- To strategically profile the key players and comprehensively analyze their market share and core competencies
- To analyze the impact of AI on the market
- To track and analyze competitive developments, such as deals, product launches/developments, expansions, and other activities undertaken by the key industry participants
Available Customizations
With the given market data, MarketsandMarkets offers customizations in accordance with the company’s specific needs. The following customization options are available:
- Additional Company Profiles (Up to 5)
- Global LiDAR Simulation Market, By Level of Autonomy, at the Country Level
- Global LiDAR Simulation Market, By Vehicle Type, ICE and Electric
- Global LiDAR Simulation Market, By Testing Method, By Country
Get the Full LiDAR Simulation Market Report
Full forecast, segment splits, and company analysis for all LiDAR Simulation Market.
Need a Tailored Report?
Customize this report to your needs
Get 10% FREE Customization
Customize This Report
