
Europe LNG Station Market (2025-2030)

The Europe LNG Station Market was valued at $186.8 Million in 2025 and projected to reach to $382.9 Million by 2030, representing a compound annual growth rate of 15.4%. Europe's LNG station market is positioned for exceptional growth through 2030, driven by the continent's commitment to energy independence and decarbonization.


| Market Size in | USD 26.32 MN |
| Market Forecast in | |
| CAGR | |
| Forecast Period | |
| Units Considered | Value (USD MN) |
Europe LNG Station Market Trends and Insights
- This represents a compound annual growth rate of 15.4%, significantly outpacing global market growth.
- Europe's strategic focus on energy diversification and decarbonization is driving substantial investment in LNG infrastructure across the region. The growth trajectory reflects Europe's commitment to reducing dependency on traditional energy sources and transitioning toward cleaner fuel alternatives.
- Europe's LNG station market is benefiting from regulatory support, increased industrial adoption, and expanding transportation fuel applications.
- By 2030, Europe is expected to consolidate its position as a critical hub for LNG distribution and utilization in the global energy landscape..
Key Market Statistics
- CAGR (2025-2030) 15.4% CAGR
- Market Size, 2025 ~USD 186.8 Million
- Forecast, 2030 ~USD 382.9 Million
- Geography Europe
Europe LNG Station Market Overview
Market Leadership by Germany & Italy :
Germany and Italy dominate Europe's LNG station market, collectively accounting for over USD 176 million in 2025. Germany's advanced infrastructure and Italy's strategic Mediterranean position drive significant investment in LNG terminal capacity and distribution networks.
Nordic Region Expansion :
Sweden, Finland, and Norway collectively represent USD 68.2 million in market value, reflecting strong regional commitment to LNG infrastructure as part of energy security and decarbonization strategies across Scandinavia.
Energy Diversification Imperative :
Europe's LNG station market growth is fueled by urgent need to reduce dependency on traditional energy sources and enhance supply chain resilience. Strategic investments in regasification and distribution infrastructure are accelerating across all major economies.
15.4% CAGR Outpaces Global Growth :
Europe's LNG station market is expanding at 15.4% CAGR through 2030, significantly exceeding the global 9% growth rate. This acceleration reflects regulatory support, EU green energy mandates, and substantial capital allocation toward sustainable energy transition.
Europe LNG Station Market Dynamics
- The market's 15.4% CAGR reflects increasing investments in regasification terminals, small-scale LNG facilities, and distribution infrastructure across major economies including Germany, Italy, and the Nordic region.
- Regulatory frameworks supporting renewable energy integration and reduced carbon emissions are accelerating LNG adoption as a transitional fuel. The forecast expansion to USD 382.9 million by 2030 underscores Europe's strategic pivot toward diversified energy sources and supply chain resilience.
- Key growth drivers include EU climate targets, infrastructure modernization initiatives, and rising demand for cleaner energy alternatives.
- Investment opportunities span terminal development, storage solutions, and last-mile distribution networks, particularly in emerging markets within Central and Eastern Europe..
Market Ecosystem
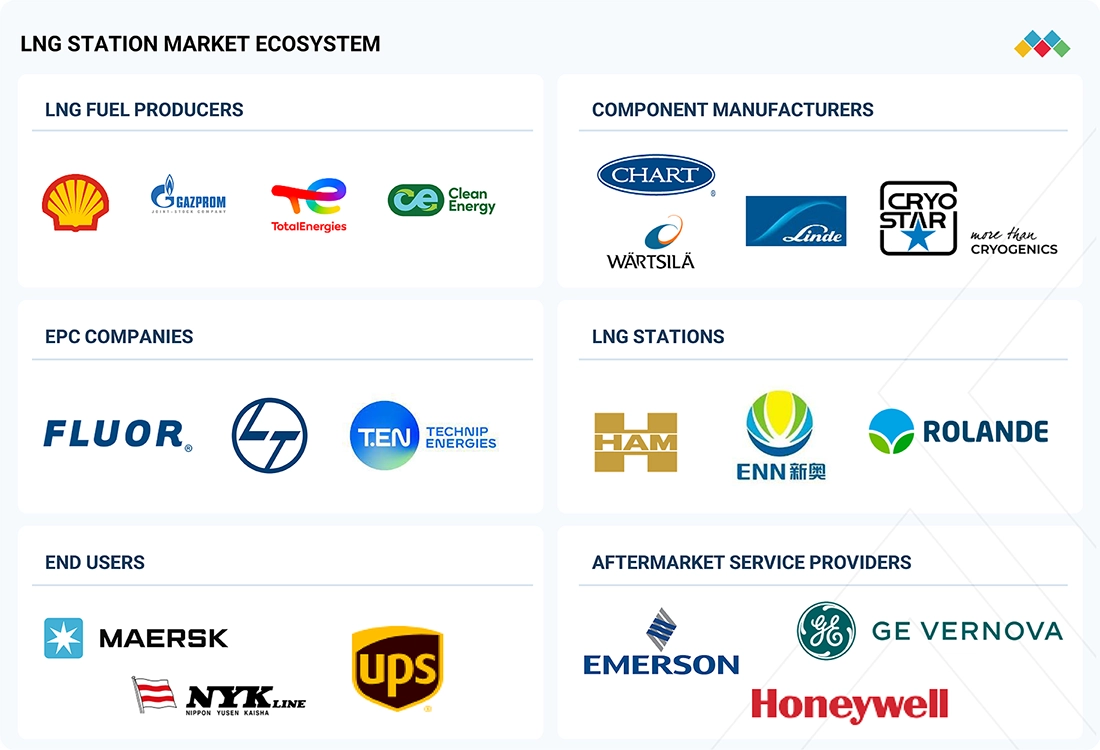
LNG Station Market: COMMERCIAL USE CASES ACROSS INDUSTRIES
| COMPANY | USE CASE DESCRIPTION | BENEFITS |
|---|---|---|
 |
A Major Energy Company wanted to design and build selective LNG fueling stations across the US. To mitigate risk and ensure profitability for the venture, they needed a way to distribute and dispense LNG in the most reliable and cost-effective manner, which could be easily replicated at new fueling station sites as needed, with a low-maintenance piping system. | The partnership between the energy company and Chart Inc. brought significant benefits in operations, economics, and the environment. Vacuum-insulated piping (VIP) systems improved thermal efficiency, cut heat loss by nearly 90%, and extended infrastructure lifespan up to ten times, lowering maintenance and downtime, reducing lifecycle costs, and boosting reliability. Each LNG station now supports up to 150 trucks daily, ensuring scalability and steady performance. Overall, the project created a sustainable, cost-effective fueling network, supporting long-term profitability and promoting cleaner, energy-efficient transportation across the US. |
 |
Cryostar SAS, a pioneer in cryogenic equipment, faced challenges in maintaining high-quality project deliverables, streamlining modification processes, and integrating components like process, piping, instrumentation, and structure in power and gas liquefaction projects. The company aimed to improve time management, support 3D piping models, and enhance engineering coordination. To stay a leader in clean energy and cryogenics, Cryostar required a fully integrated engineering and data management solution to improve accuracy and reduce costly rework. | The adoption of integrated engineering and data management solutions gave LNG station operators operational advantages by enabling real-time coordination, automation, and standardized data flow, which minimized errors, reduced manual work, lowered rework and costs, and improved project efficiency and asset performance. These benefits enhanced project delivery, resource use, and competitiveness. |
Logos and trademarks shown above are the property of their respective owners. Their use here is for informational and illustrative purposes only.
Related Ecosystem
Energy Storage
- Energy Harvesting
- HVAC System
- Applicant Tracking System
- Battery Electric Vehicle (BEV)
- Carboxymethyl Cellulose (CMC)
- MOMENTIVE PERFORMANCE MATERIALS INC.
- Panasonic Holdings Corporation
- ABB India Limited
- Lg corp
- FDK Corporation
Power Infrastructure
- Geographical Information System (GIS)
- Cogeneration
- Battery Electric Vehicle (BEV)
- Cellular Network
- Fuel Cell
- Siemens ag
- ABB India Limited
- SCHNEIDER ELECTRIC SE
- General Electric Company
- Eaton Corporation plc
Key Takeaways
- Europe's LNG station market will nearly double from USD 186.8M (2025) to USD 382.9M (2030), driven by 15.4% CAGR growth.
- Europe's energy transition policies and regulatory frameworks are accelerating LNG infrastructure investment and adoption.
- Europe's market expansion is supported by growing demand for cleaner fuels in transportation, industrial, and power generation sectors.
- Europe's strategic geographic position and port infrastructure position the region as a key LNG distribution hub through 2030.
LNG Station Market Report Scope
| Report Metric | Details |
|---|---|
| Base Year | 2025 |
| Fastest Growing Segment | MARINE (Application) |
| Forecast Period | 2025–2030 |
| Growth Rate | CAGR of 9% from 2025 to 2030 |
| Largest Segment | HEAVY-DUTY VEHICLES (Application) |
| Market Size Base Year (Billions) | ~USD 1.01 (2025) |
| Revenue Forecast (Billions) | ~USD 1.56 (2030) |
| Segments Covered | Station Type, Solution, Capacity, Application |
Europe LNG Station Market Report Segmentation
4 segment dimensions are covered across the global market.
By Station Type
- Bunkering Lng Station
- Fixed Lng Station
- Mobile Lng Station
By Solution
- Components
- Engineering, Procurement, And Construction (Epc)
- Epc
By Capacity
- Large Scale
- Medium Scale
- Small Scale
By Application
- Heavy-Duty Vehicle
- Heavy-Duty Vehicles
- Light-Duty Vehicle
- Light-Duty Vehicles
- Marine
EUROPE: LNG STATION MARKET, BY APPLICATION, 2025–2030
| Segment | 2025 | 2026 | 2027 | 2028 | 2029 | 2030 | CAGR (%) |
|---|---|---|---|---|---|---|---|
| HEAVY-DUTY VEHICLES | 160.4 | 180.6 | 206 | 238.4 | 277.2 | 324.5 | 15.1 |
| LIGHT-DUTY VEHICLES | 15.9 | 17.7 | 19.9 | 22.6 | 25.9 | 29.9 | 13.5 |
| MARINE | 10.5 | 12.5 | 15.3 | 18.8 | 23.1 | 28.5 | 22.1 |
| TOTAL | 186.8 | 210.9 | 241.2 | 279.8 | 326.3 | 382.9 | 15.4 |
REST OF EUROPE: LNG STATION MARKET, BY APPLICATION, 2025–2030
| Segment | 2025 | 2026 | 2027 | 2028 | 2029 | 2030 | CAGR (%) |
|---|---|---|---|---|---|---|---|
| HEAVY-DUTY VEHICLES | 18.4 | 21.9 | 26.1 | 31.6 | 38.3 | 46.2 | 20.2 |
| LIGHT-DUTY VEHICLES | 1.9 | 2.2 | 2.7 | 3.3 | 4 | 4.9 | 21.4 |
| MARINE | 0.7 | 0.9 | 1.1 | 1.4 | 1.8 | 2.2 | 26.7 |
| TOTAL | 21 | 25 | 29.9 | 36.4 | 44.1 | 53.4 | 20.6 |
Target Audience
- Energy Infrastructure Developers : LNG terminal operators and infrastructure developers need Europe-specific market data to identify high-potential locations, assess competitive intensity, and plan regasification and distribution facility investments across the region.
- Oil & Gas Companies : Major energy corporations require detailed European market insights to optimize LNG supply chain strategies, evaluate country-level demand trends, and allocate capital toward terminal expansion and small-scale LNG operations.
- Investment & Private Equity Firms : Investors targeting energy infrastructure need comprehensive European market analysis to identify acquisition targets, assess growth potential by country, and evaluate risk-adjusted returns in LNG station development projects.
- Government & Policy Makers : European energy regulators and government agencies require market data to inform energy security policies, infrastructure investment priorities, and decarbonization strategies aligned with EU climate commitments.
- Technology & Equipment Suppliers : LNG equipment manufacturers and technology providers need European market segmentation to identify demand hotspots, target key customer segments, and develop region-specific product and service offerings.
Key Companies in the Europe LNG Station Market
| Company | HQ | Ownership | Strongest segments |
|---|---|---|---|
| CNPC | China | Private Company | Upstream oil and gas production,Refining and petrochemicals,Natural gas marketing and pipelines, |
| SHELL PLC | United Kingdom | Public Company | Integrated Gas (including LNG and GTL),Upstream (oil, gas, NGLs),Marketing (mobility, lubricants, commercial fuels, EV charging), |
| CHART INDUSTRIES | United States | Public Company | Cryo Tank Solutions (bulk, microbulk, mobile, LNG virtual pipeline, large storage),Heat Transfer Systems (brazed aluminum, cold boxes, air-cooled exchangers),Specialty Products (hydrogen, water treatment, niche process equipment), |
| GRUPO HAM | Spain | Private Company | LNG Refuelling Stations (Design, Build, Operate),CNG/Bio-CNG Stations and Equipment,Small-Scale LNG & Industrial Gas Solutions, |
| CLEAN ENERGY FUELS | United States | Public Company | RNG fuel and environmental credits,CNG/LNG fuel (non-RNG),Station design, build, operate, and maintenance services, |
| INDIAN OIL CORPORATION LTD | India | Public Company | Sale of Petroleum Products,Sale of Gas,Sale of Petrochemicals, |
| INOX INDIA LIMITED | India | Public Company | Standard cryogenic storage and transport tanks (industrial gas, LNG, LCNG),Cryogenic systems, vaporizers, piping, and turnkey project execution,Specialty cryogenic equipment (bio-series, low-pressure tanks, cylinders), |
| BHARAT PETROLEUM CORPORATION LIMITED | India | Public Company | Retail motor fuels (MS, HSD, blended fuels, CNG/LNG, AutoLPG),LPG (Bharatgas – domestic, commercial, metal cutting),Lubricants (MAK automotive and industrial), |
CNPC
CNPC is a private Chinese oil and gas company founded in 1955 with 30,173 employees. It operates as one of China's major energy enterprises.
SHELL PLC
Shell PLC is a public multinational energy company headquartered in the United Kingdom, founded in 1897 with 84,000 employees. It is a leading global oil and gas producer.
CHART INDUSTRIES
Chart Industries is a public American company founded in 1859 with 11,777 employees. It specializes in industrial equipment and cryogenic technology.
GRUPO HAM
Grupo HAM is a private Spanish company founded in 1980. It operates in the energy sector.
CLEAN ENERGY FUELS
Clean Energy Fuels is a public American company founded in 2001 with 503 employees. It provides alternative fuel solutions and infrastructure.
INDIAN OIL CORPORATION LTD
Indian Oil Corporation Ltd is a public Indian company founded in 1959 with 29,941 employees. It is a major integrated energy company in India.
INOX INDIA LIMITED
Inox India Limited is a public Indian company founded in 1976 with 752 employees. It operates in the energy and industrial equipment sector.
BHARAT PETROLEUM CORPORATION LIMITED
Bharat Petroleum Corporation Limited is a public Indian company founded in 1952 with 8,747 employees. It is a major petroleum and energy company in India.
Countries within Europe - compare and drill down
| Country | 2025 size (native) |
|---|---|
| Germany | USD 80.3 Million |
| France | USD 25.8 Million |
| UK | USD 4.4 Million |
| Spain | USD 26.7 Million |
| Italy | USD 95.8 Million |
| Netherlands | USD 7.3 Million |
| Sweden | USD 29.9 Million |
| Poland | USD 6.6 Million |
| Finland | USD 19.1 Million |
| Belgium | USD 6.6 Million |
| Norway | USD 19.2 Million |
| Portugal | USD 7.9 Million |
| Rest Of Europe | USD 53.4 Million |
Country market size visualization
Reasons to Buy this Report
- Country-Level Market Granularity : Access detailed market sizing for 14 European countries including Germany (USD 80.3M), Italy (USD 95.8M), and Sweden (USD 29.9M), enabling precise regional investment and expansion strategies.
- High-Growth Market Identification : Identify Europe's fastest-growing LNG station segments with 15.4% CAGR—significantly outpacing global 9% growth. Capitalize on emerging opportunities in Nordic and Central European markets before competition intensifies.
- Strategic Infrastructure Insights : Understand Europe's energy diversification priorities and decarbonization mandates driving LNG infrastructure investment. Align business strategies with regulatory frameworks and EU climate targets shaping market dynamics.
- Competitive Landscape Analysis : Benchmark market positions across leading European economies and identify white-space opportunities in underserved regions. Develop targeted go-to-market strategies for Germany, Italy, Spain, and emerging Nordic markets.
- Forecast-Driven Planning : Leverage 2030 market projections (USD 382.9M) to guide 5-year capital allocation, partnership development, and infrastructure expansion plans. Make data-backed decisions on facility locations, capacity investments, and technology deployments.
Frequently asked questions
What is the current size of Europe's LNG station market?
Europe's LNG station market was valued at USD 186.8 million in 2025 and is expected to grow to USD 382.9 million by 2030.
What is the growth rate for Europe's LNG station market?
Europe's LNG station market is projected to grow at a compound annual growth rate (CAGR) of 15.4% from 2025 to 2030.
What factors are driving growth in Europe's LNG station market?
Europe's market growth is driven by energy transition policies, regulatory support for cleaner fuels, industrial adoption, and expanding transportation applications.
How does Europe's LNG station market compare to global growth?
Europe's 15.4% CAGR significantly exceeds the global market CAGR of 9%, reflecting stronger regional momentum and investment.
What is the forecast market size for Europe's LNG station market by 2030?
Europe's LNG station market is forecasted to reach USD 382.9 million by 2030, representing a doubling of the 2025 market value.
RESEARCH METHODOLOGY
The study involved major activities in estimating the current size of the LNG station market. Exhaustive secondary research was done to collect information on the peer and parent markets. The next step was to validate these findings, assumptions, and sizing with industry experts across the value chain through primary research. Both top-down and bottom-up approaches were employed to estimate the complete market size. Thereafter, market breakdown and data triangulation were used to estimate the market size of the segments and subsegments.
Secondary Research
The secondary sources referred to for this research study include annual reports, press releases, investor presentations of companies, white papers, certified publications, articles from recognized authors, and databases of various companies and associations. Secondary research was mainly used to obtain key information about the industry’s supply chain, the market’s monetary chain, the total pool of key players, market classification and segmentation according to industry trends to the bottom-most level, regional markets, and key developments from both market- and technology-oriented perspectives.
Primary Research
In the primary research process, various primary sources from both the supply and demand sides were interviewed to obtain qualitative and quantitative information for this report. Primary sources from the supply side include industry experts, such as CEOs, vice presidents, marketing directors, technology & innovation directors, and related key executives from various companies and organizations operating in the LNG station market.
In the complete market engineering process, both top-down and bottom-up approaches were extensively used, along with several data triangulation methods, to perform market estimation and market forecasts for the overall market segments and subsegments listed in this report. Extensive qualitative and quantitative analysis was conducted on the complete market engineering process to list key information/insights throughout the report.
The following is the breakdown of primary respondents:
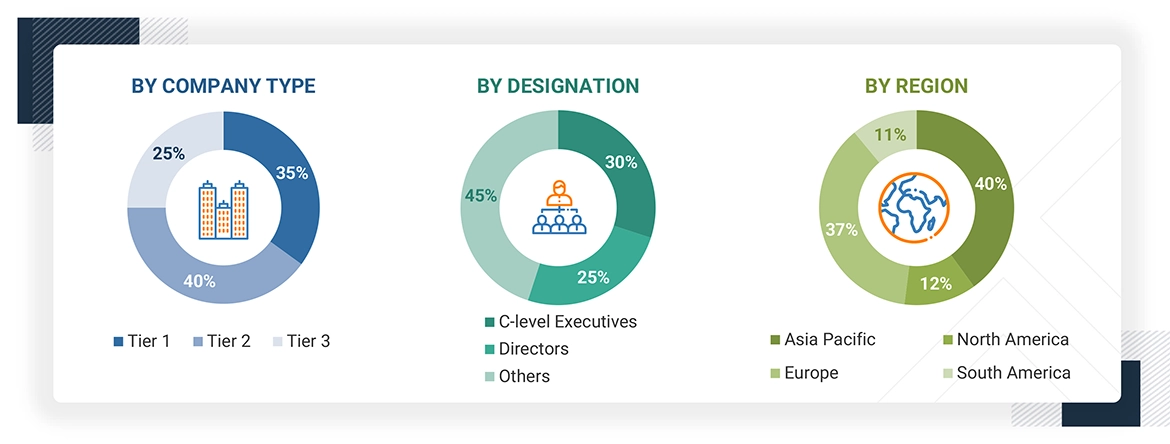
Note 1: Others include sales managers, marketing managers, and product managers.
Note 2: Tier 1 companies’ revenues are more than USD 10 billion; tier 2 companies’ revenues range between USD 1 and 10 billion; and tier 3 companies’ revenues range between USD 500 million and USD 1 billion.
Source: Industry Experts
To know about the assumptions considered for the study, download the pdf brochure
Market Size Estimation
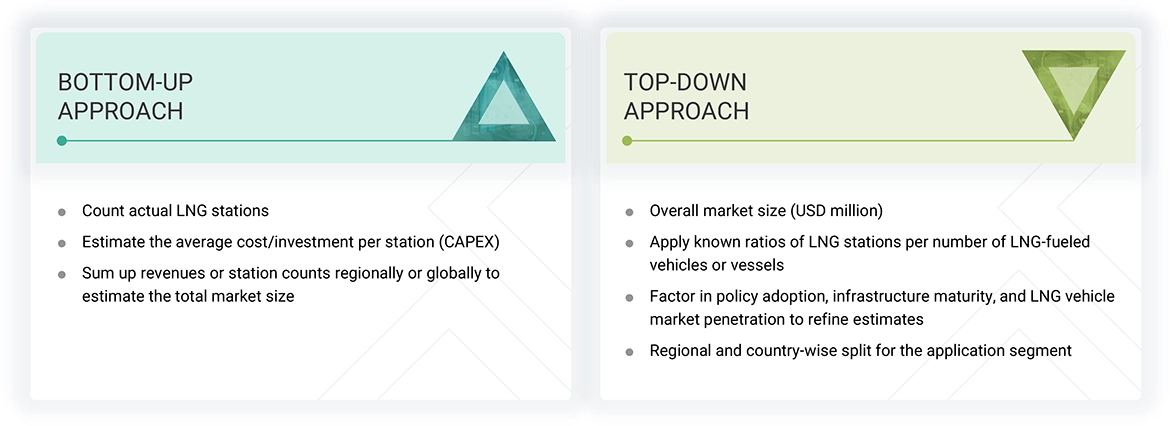
The top-down and bottom-up approaches were used to estimate and validate the size of the global LNG station market and to evaluate the sizes of various other dependent submarkets. The key players in the market were identified through secondary research, and their shares in the respective regions were determined through primary and secondary research. This entire procedure included the study of annual and financial reports of top market players and extensive interviews for key insights with industry leaders such as CEOs, VPs, directors, and marketing executives. All percentage shares, splits, and breakdowns were determined using secondary sources and verified through primary sources. All possible parameters that affect the markets covered in this research study were accounted for, viewed in extensive detail, verified through primary research, and analyzed to get the final quantitative and qualitative data.
LNG Station Market : Top-Down and Bottom-Up Approach
Data Triangulation
After arriving at the overall market size from the estimation process explained below, the total market was split into several segments and subsegments. Wherever applicable, the data triangulation and market breakdown procedures were employed to complete the overall market engineering process and arrive at the exact statistics for all the segments and subsegments. The data was triangulated by studying various factors and trends from both the demand and supply sides.
Market Definition
An LNG station is a facility that stores and dispenses liquefied natural gas, which is natural gas cooled to approximately -260°F (-162°C) to convert it into a liquid state. This liquefaction process reduces the gas's volume by about 600 times, facilitating easier storage and transportation. LNG stations are integral in supplying fuel for vehicles and ships equipped to run on LNG, contributing to reduced greenhouse gas emissions compared to conventional fuels.
The LNG station market is defined as the sum of revenues generated by the year-on-year installation of LNG stations across three regions.
Stakeholders
- LNG terminal operators
- Engineering, procurement, and construction (EPC) companies
- National and regional governments/Regulators
- LNG suppliers/Producers
- Shipping and logistics companies
- National oil and gas companies
- Consulting companies in the oil & gas industry
- Oil and gas associations
Report Objectives
- To define, describe, segment, and forecast the LNG station market by station type, application, solution, and capacity in terms of value
- To define, describe, segment, and forecast the LNG station market, by station type and region, in terms of volume
- To forecast the market sizes for three major regions, namely North America, Europe, and Asia Pacific, along with their key countries, in terms of value, whereas the rest of the world region will provide qualitative insights
- To provide detailed information regarding key drivers, restraints, opportunities, and challenges influencing the growth of the LNG station market
- To provide the supply chain analysis, trends/disruptions impacting customer business, ecosystem analysis, regulatory landscape, patent analysis, case study analysis, technology analysis, key conferences & events, the impact of AI/Gen AI, macroeconomic outlook, pricing analysis, Porter’s five forces analysis, regulatory analysis, and the impact of the 2025 US tariff on the market
- To analyze opportunities for stakeholders in the LNG station market and draw a competitive landscape of the market
- To benchmark market players using the company evaluation matrix, which analyzes market players on broad categories of business and product strategies adopted by them
- To compare key market players for the market share, product specifications, and applications
- To strategically profile key players and comprehensively analyze their market ranking and core competencies
- To analyze competitive developments, such as contracts, agreements, partnerships, and joint ventures, in the LNG station market
Available Customizations
MarketsandMarkets offers customizations according to the specific needs of the companies with the given market data.
The following customization options are available for the report:
Product Analysis
- Product matrix, which gives a detailed comparison of the product portfolio of each company
Geographic Analysis as per Feasibility
- Further breakdown of the LNG station market, by country, for Europe, Asia Pacific, and North America
Company Information
- Detailed analysis and profiling of additional market players (up to five)
Get the Full LNG Station Market Report
Full forecast, segment splits, and company analysis for all LNG Station Market.
- US LNG Station Market
- Canada LNG Station Market
- Germany LNG Station Market
- France LNG Station Market
- UK LNG Station Market
- Spain LNG Station Market
- Italy LNG Station Market
- Netherlands LNG Station Market
- Sweden LNG Station Market
- Poland LNG Station Market
- Finland LNG Station Market
- Belgium LNG Station Market
- Norway LNG Station Market
- Portugal LNG Station Market
- China LNG Station Market
- Japan LNG Station Market
- India LNG Station Market
- Rest Of Europe LNG Station Market
Need a Tailored Report?
Customize this report to your needs
Get 10% FREE Customization
Customize This Report
