
Asia Pacific Microdisplay Market (2025-2030)

The Asia Pacific Microdisplay Market was valued at $706.6 Million in 2025 and projected to reach to $2548.6 Million by 2030, representing a compound annual growth rate of 29.2%. Asia Pacific's microdisplay market is experiencing unprecedented expansion, fueled by the region's dominance in consumer electronics manufacturing and rapid commercialization of augmented and virtual reality technologies.


| Market Size in | USD 26.32 MN |
| Market Forecast in | |
| CAGR | |
| Forecast Period | |
| Units Considered | Value (USD MN) |
Asia Pacific Microdisplay Market Trends and Insights
- In 2025, Asia Pacific's microdisplay market is estimated at $706.6 million, driven by robust demand from consumer electronics, augmented reality, and virtual reality applications across the region.
- Asia Pacific is projected to expand significantly to $2,548.6 million by 2030, reflecting a compound annual growth rate of 29.2%-substantially outpacing global growth trends. The region's leadership stems from its concentration of leading semiconductor manufacturers, advanced display technology ecosystems, and early adoption of next-generation consumer devices.
- Asia Pacific's microdisplay market benefits from strong investments in AR/VR infrastructure, gaming, and enterprise applications throughout 2025-2030.
- Key markets within Asia Pacific, including China, Japan, South Korea, and Taiwan, are accelerating microdisplay integration into wearables, head-mounted displays, and industrial equipment, positioning the region as the primary revenue contributor to the global microdisplay sector..
Key Market Statistics
- CAGR (2025-2030) 29.2% CAGR
- Market Size, 2025 ~USD 706.6 Million
- Forecast, 2030 ~USD 2548.6 Million
- Geography Asia Pacific
Asia Pacific Microdisplay Market Overview
Market Leadership Position :
Asia Pacific commands the global microdisplay market with an estimated value of $706.6 million in 2025, establishing the region as the dominant growth engine for semiconductor innovation and advanced display technologies.
Exceptional Growth Trajectory :
The region is projected to reach $2,548.6 million by 2030, representing a robust 29.2% CAGR—outpacing the global average of 26.4%—driven by accelerating adoption across consumer electronics, AR, and VR applications.
China's Market Dominance :
China leads Asia Pacific with $1,016 million in market size, supported by its massive consumer electronics manufacturing base, aggressive AR/VR investments, and semiconductor innovation ecosystem.
Diversified Regional Growth :
Japan ($468.3M), South Korea ($336.7M), and India ($213.4M) contribute significantly to regional expansion, with emerging markets like Vietnam and Thailand offering untapped growth opportunities for microdisplay adoption.
Asia Pacific Microdisplay Market Dynamics
- The 29.2% CAGR through 2030 reflects strong demand from smartphone makers, gaming companies, and enterprise AR/VR solution providers concentrated across China, Japan, and South Korea.
- Government initiatives supporting semiconductor self-sufficiency and tech innovation further accelerate market penetration. The region's competitive advantage stems from established supply chains, skilled engineering talent, and substantial R&D investments by leading semiconductor firms.
- Emerging economies within Asia Pacific, including India, Vietnam, and Indonesia, present significant whitespace opportunities as consumer adoption of AR/VR devices expands beyond premium segments.
- Strategic partnerships between regional manufacturers and global technology leaders are expected to drive next-generation microdisplay innovations and cost reductions through 2030..
Market Ecosystem
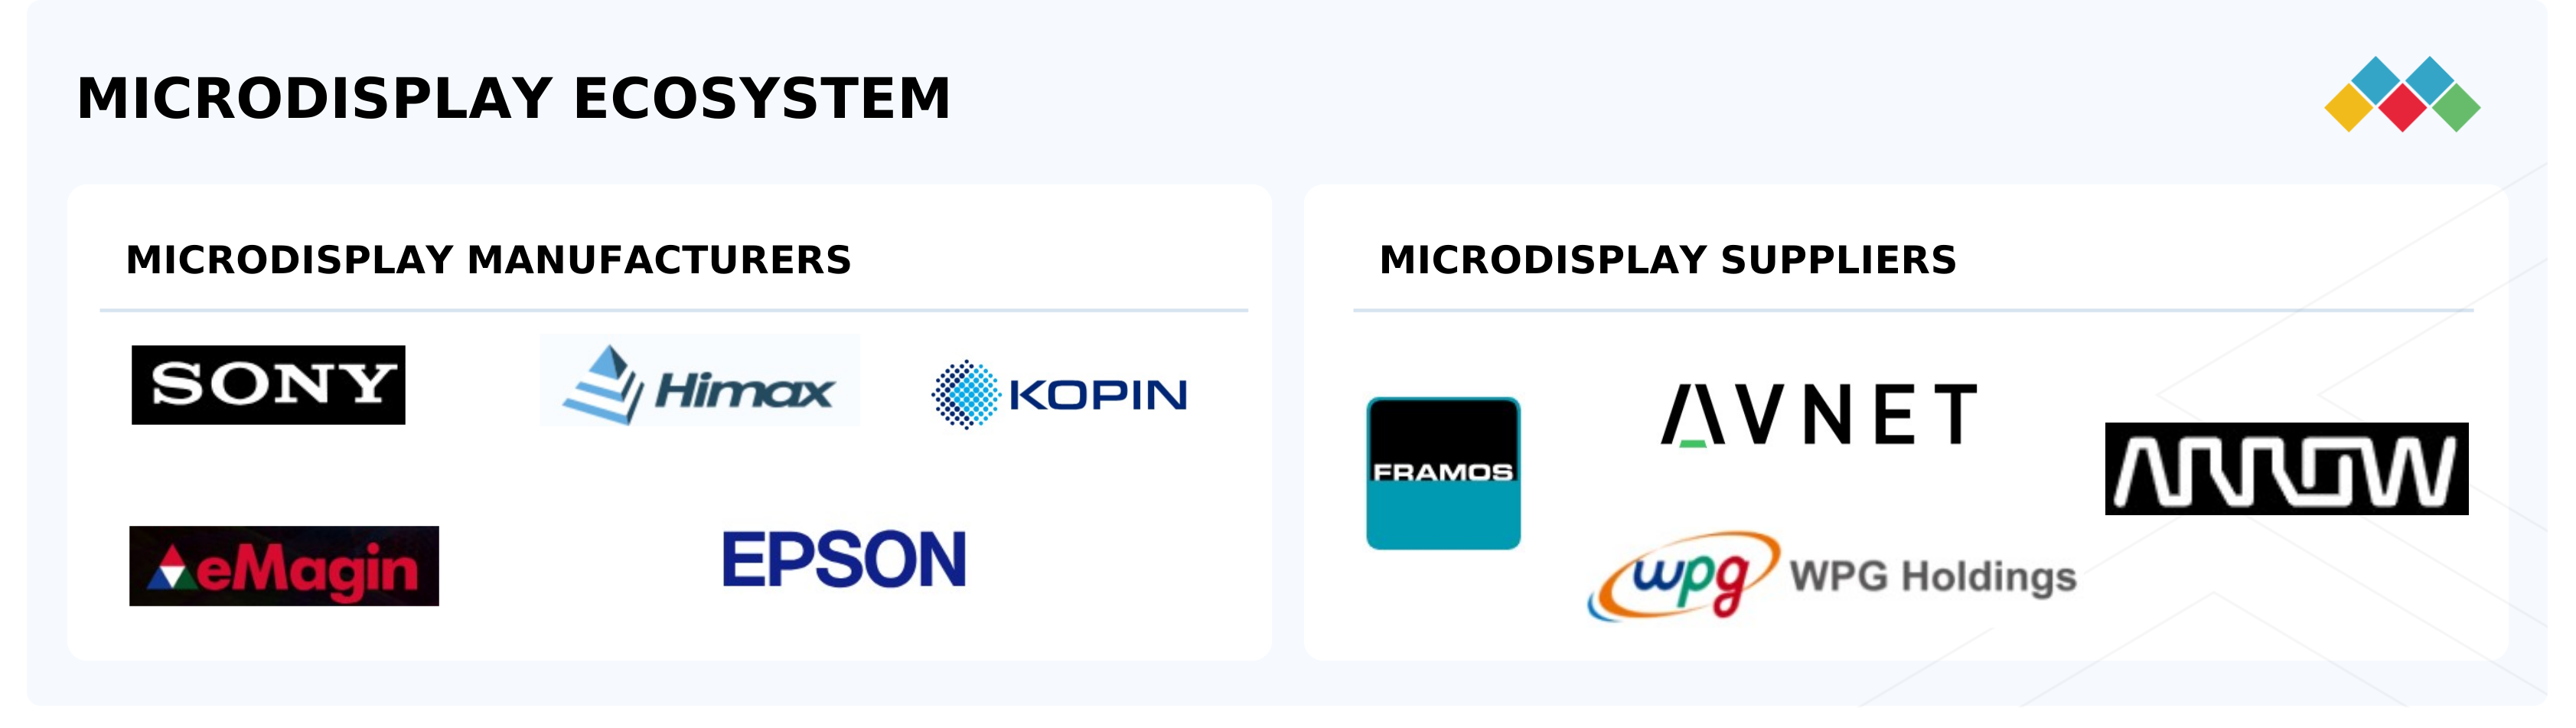
Microdisplay Marke: COMMERCIAL USE CASES ACROSS INDUSTRIES
| COMPANY | USE CASE DESCRIPTION | BENEFITS |
|---|---|---|
 |
Flexible microdisplay technology, developed by researchers at the University of California, San Diego (US), and Massachusetts General Hospital (US), demonstrates a transformative application in neurosurgery. The innovation integrates a platinum nanorod electrode grid (PtNRGrid) with Gallium Nitride (GaN) micro-LEDs on a thin, flexible film. Each micro-LED mirrors neuronal activity in real time, translating complex brain signals into intuitive, color-coded visual feedback directly within the surgical field. This enables neurosurgeons to monitor seizure onset, functional brain boundaries, and tissue differentiation without relying on external mapping teams or traditional tissue diagrams. | The technology offers multiple benefits, including enhanced surgical precision by reducing the safety buffer zone from several millimeters to less than one millimeter, improved visualization through intuitive color-coded signals, and faster operative workflows by eliminating delays from manual mapping methods. These advancements not only shorten surgery times but also lower the risk of neurological damage, thereby improving patient outcomes. Furthermore, the flexible and scalable design makes it adaptable for various neurosurgical interventions, including epilepsy treatments and tumor resections. |
 |
Sony Group Corporation (Japan) enhanced the development of augmented reality (AR) glasses by introducing its LMX-001 microdisplay module, addressing critical challenges of bulkiness, limited transparency, and poor adaptability. The module integrates a microdisplay, driver chip, optical engine, collimator, and an ultra-thin holographic waveguide that maintains over 85% see-through transmittance while delivering up to 2,000 nits of brightness. This advancement enables AR glasses to remain lightweight, slim, and comfortable, making them well-suited for industrial environments such as logistics, remote assistance, and production monitoring, where workers require high-clarity displays without compromising visibility. | The use of Sony’s microdisplay technology in AR glasses delivers multiple benefits, including improved comfort and usability through slim and lightweight designs, superior visual clarity with high brightness and transparency, and reduced visual obstruction for safer and more efficient operations. By offering development kits and production-ready modules, Sony also empowers enterprises to design customized solutions tailored to specific industrial workflows, thereby accelerating the adoption of AR technology across diverse applications and enhancing operational productivity.. |
Logos and trademarks shown above are the property of their respective owners. Their use here is for informational and illustrative purposes only.
Related Ecosystem
Automotive Electronics And Electrical Equipment
- Battery Electric Vehicle (BEV)
- Light Commercial Vehicles (LCVs)
- Fuel Cell Electric Vehicle (FCEV)
- Sensors
- Hybrid Electric Vehicle (HEV)
- BOSCH LIMITED
- DENSO Corporation
- Continental ag
- Panasonic Holdings Corporation
- Texas Instruments Incorporated
Display Technology
- Augmented Reality
- Liquid Crystal Display (LCD)
- Sensors
- Virtual Reality Devices
- Liquid Crystal on Silicon (LCOS)
- VIVITEK CORPORATION
- Samsung
- Lenovo
- Panasonic Holdings Corporation
- Lg corp
Key Takeaways
- Asia Pacific microdisplay market valued at $706.6M in 2025, expanding to $2,548.6M by 2030 at 29.2% CAGR
- Asia Pacific's 29.2% CAGR significantly exceeds the global 26.4% rate, reflecting regional technology leadership and adoption acceleration
- Asia Pacific's dominance driven by semiconductor manufacturing hubs, AR/VR ecosystem maturity, and consumer electronics demand concentration
- Key Asia Pacific markets including China, Japan, South Korea, and Taiwan lead microdisplay integration in wearables and head-mounted displays
Microdisplay Market Report Scope
| Report Metric | Details |
|---|---|
| Base Year | 2025 |
| Fastest Growing Segment | MICRO-LED (Technology) |
| Forecast Period | 2025-2030 |
| Growth Rate | CAGR of 26.4% from 2025 to 2030 |
| Largest Segment | NTE DEVICES (Product) |
| Market Size Base Year (Billions) | ~USD 1.65 (2025) |
| Revenue Forecast (Billions) | ~USD 5.33 (2030) |
| Segments Covered | Product, Near-To-Eye Device Type, Vertical, Technology, Head-Mounted Display Type, Projector Type, Resolution, Size |
Asia Pacific Microdisplay Market Report Segmentation
8 segment dimensions are covered across the global market.
By Product
- Head-Up Displays
- Head-Up Displays (Huds)
- Near-To-Eye Devices
- Nte Devices
- Projectors
By Near-To-Eye Device Type
- Cameras/Electronics Viewfinders (Evfs)
- Head-Mounted Displays (Hmds)
By Vertical
- Automotive
- Consumer
- Education
- Industrial & Enterprise
- Medical
- Military, Defense, And Aerospace
- Other Verticals
- Retail & Hospitality
- Sports & Entertainment
By Technology
- Digital Light Processing (Dpl)
- Dlp
- Liquid Crystal Display (Lcd)
- Liquid Crystal On Silicon (Lcos)
- Micro-Led
- Organic Light Emitting Diode (Oled)
By Head-Mounted Display Type
- Ar
- Vr
By Projector Type
- Data Projectors
- Pico Projectors
By Resolution
- Fhd
- Hd
- Higher Than Fhd
- Less Than Hd
By Size
- 0.5-1.0 Inch
- 1.0-2.0 Inch
- Less Than 0.5 Inch
Target Audience
- Semiconductor Manufacturers : Identify regional production hubs, competitive landscapes, and technology adoption trends across Asia Pacific to optimize manufacturing strategies, R&D investments, and supply chain positioning in the world's fastest-growing microdisplay market.
- AR/VR Solution Providers : Understand country-specific demand patterns, consumer adoption rates, and enterprise deployment opportunities across Asia Pacific to prioritize product localization, go-to-market strategies, and partnership development.
- Consumer Electronics OEMs : Access detailed market forecasts and competitive intelligence for Asia Pacific to inform product roadmaps, component sourcing decisions, and regional launch strategies for AR/VR-enabled devices.
- Investment & Private Equity Firms : Evaluate high-growth investment opportunities within Asia Pacific's microdisplay ecosystem, including emerging market potential, technology leaders, and strategic acquisition targets across the region's semiconductor value chain.
- Technology Consultants & Analysts : Deliver data-driven insights to clients on Asia Pacific microdisplay market dynamics, competitive positioning, and growth opportunities with country-level granularity and forward-looking forecasts through 2030.
Countries within Asia Pacific - compare and drill down
| Country | 2025 size (native) |
|---|---|
| China | USD 1016 Million |
| Japan | USD 468.3 Million |
| South Korea | USD 336.7 Million |
| Taiwan | USD 164.4 Million |
| India | USD 213.4 Million |
| Australia | USD 73.5 Million |
| Indonesia | USD 51.1 Million |
| Malaysia | USD 33.4 Million |
| Thailand | USD 29.7 Million |
| Vietnam | USD 27.3 Million |
Country market size visualization
Reasons to Buy this Report
- Regional Market Dominance Insights : Gain comprehensive understanding of why Asia Pacific commands 29.2% CAGR—significantly above global average—with detailed analysis of China, Japan, South Korea, and emerging market dynamics driving regional leadership.
- Country-Level Competitive Intelligence : Access granular market sizing and growth projections for 10 Asia Pacific countries, enabling precise identification of high-opportunity markets and competitive positioning strategies across the region's diverse economies.
- AR/VR Application Opportunity Mapping : Understand how consumer electronics, augmented reality, and virtual reality applications are concentrated across Asia Pacific, with specific insights into adoption patterns and revenue drivers by country and segment.
- Strategic Investment & Expansion Planning : Leverage forecasted growth from $706.6M to $2,548.6M by 2030 to identify optimal entry points, partnership opportunities, and manufacturing locations within Asia Pacific's semiconductor ecosystem.
- Emerging Market Growth Potential : Discover untapped opportunities in Vietnam, Thailand, Indonesia, and Malaysia where microdisplay adoption is accelerating, with actionable insights for market entry and localization strategies.
Frequently asked questions
What is the current size of the Asia Pacific microdisplay market in 2025?
Asia Pacific's microdisplay market is estimated at $706.6 million in 2025, representing the largest regional segment globally.
What is the projected size of Asia Pacific's microdisplay market by 2030?
Asia Pacific's microdisplay market is forecast to reach $2,548.6 million by 2030, reflecting substantial expansion over the five-year period.
Why does Asia Pacific's microdisplay market grow faster than the global average?
Asia Pacific's 29.2% CAGR exceeds the global 26.4% rate due to concentrated semiconductor manufacturing, advanced AR/VR ecosystems, and accelerated consumer device adoption across the region.
Which countries drive Asia Pacific's microdisplay market growth?
China, Japan, South Korea, and Taiwan are primary growth drivers in Asia Pacific, leveraging their semiconductor expertise and leadership in consumer electronics and display technologies.
What applications are fueling Asia Pacific microdisplay demand?
Asia Pacific microdisplay growth is driven by augmented reality, virtual reality, wearables, head-mounted displays, gaming devices, and industrial applications across the region.
RESEARCH METHODOLOGY
The study involved major activities in estimating the current size of the microdisplay market. Exhaustive secondary research has been done to collect information on the market, peer market, and parent market. The next step was to validate these findings, assumptions, and sizing with industry experts across the supply chain through primary research. Both top-down and bottom-up approaches have been employed to estimate the complete market size. After that, market breakdown and data triangulation methods have been used to estimate the market size of segments and subsegments. Secondary and primary sources have been used to identify and collect information for an extensive technical and commercial study of the microdisplay market.
Secondary Research
Secondary research for this study involved gathering information from various credible sources such as company reports, white papers, journals, and industry publications. This process helped in understanding the supply and value chains, identifying key players, analyzing market segmentation and regional trends, and tracking major market and technology developments. The data collected was used to estimate the overall market size, which was later validated through primary research.
Primary Research
Extensive primary research was conducted after gaining knowledge about the current scenario of the microdisplay market through secondary research. Several primary interviews were conducted with experts from the demand and supply sides across four major regions: North America, Europe, Asia Pacific, and RoW. This primary data was collected through questionnaires, emails, and telephone interviews.
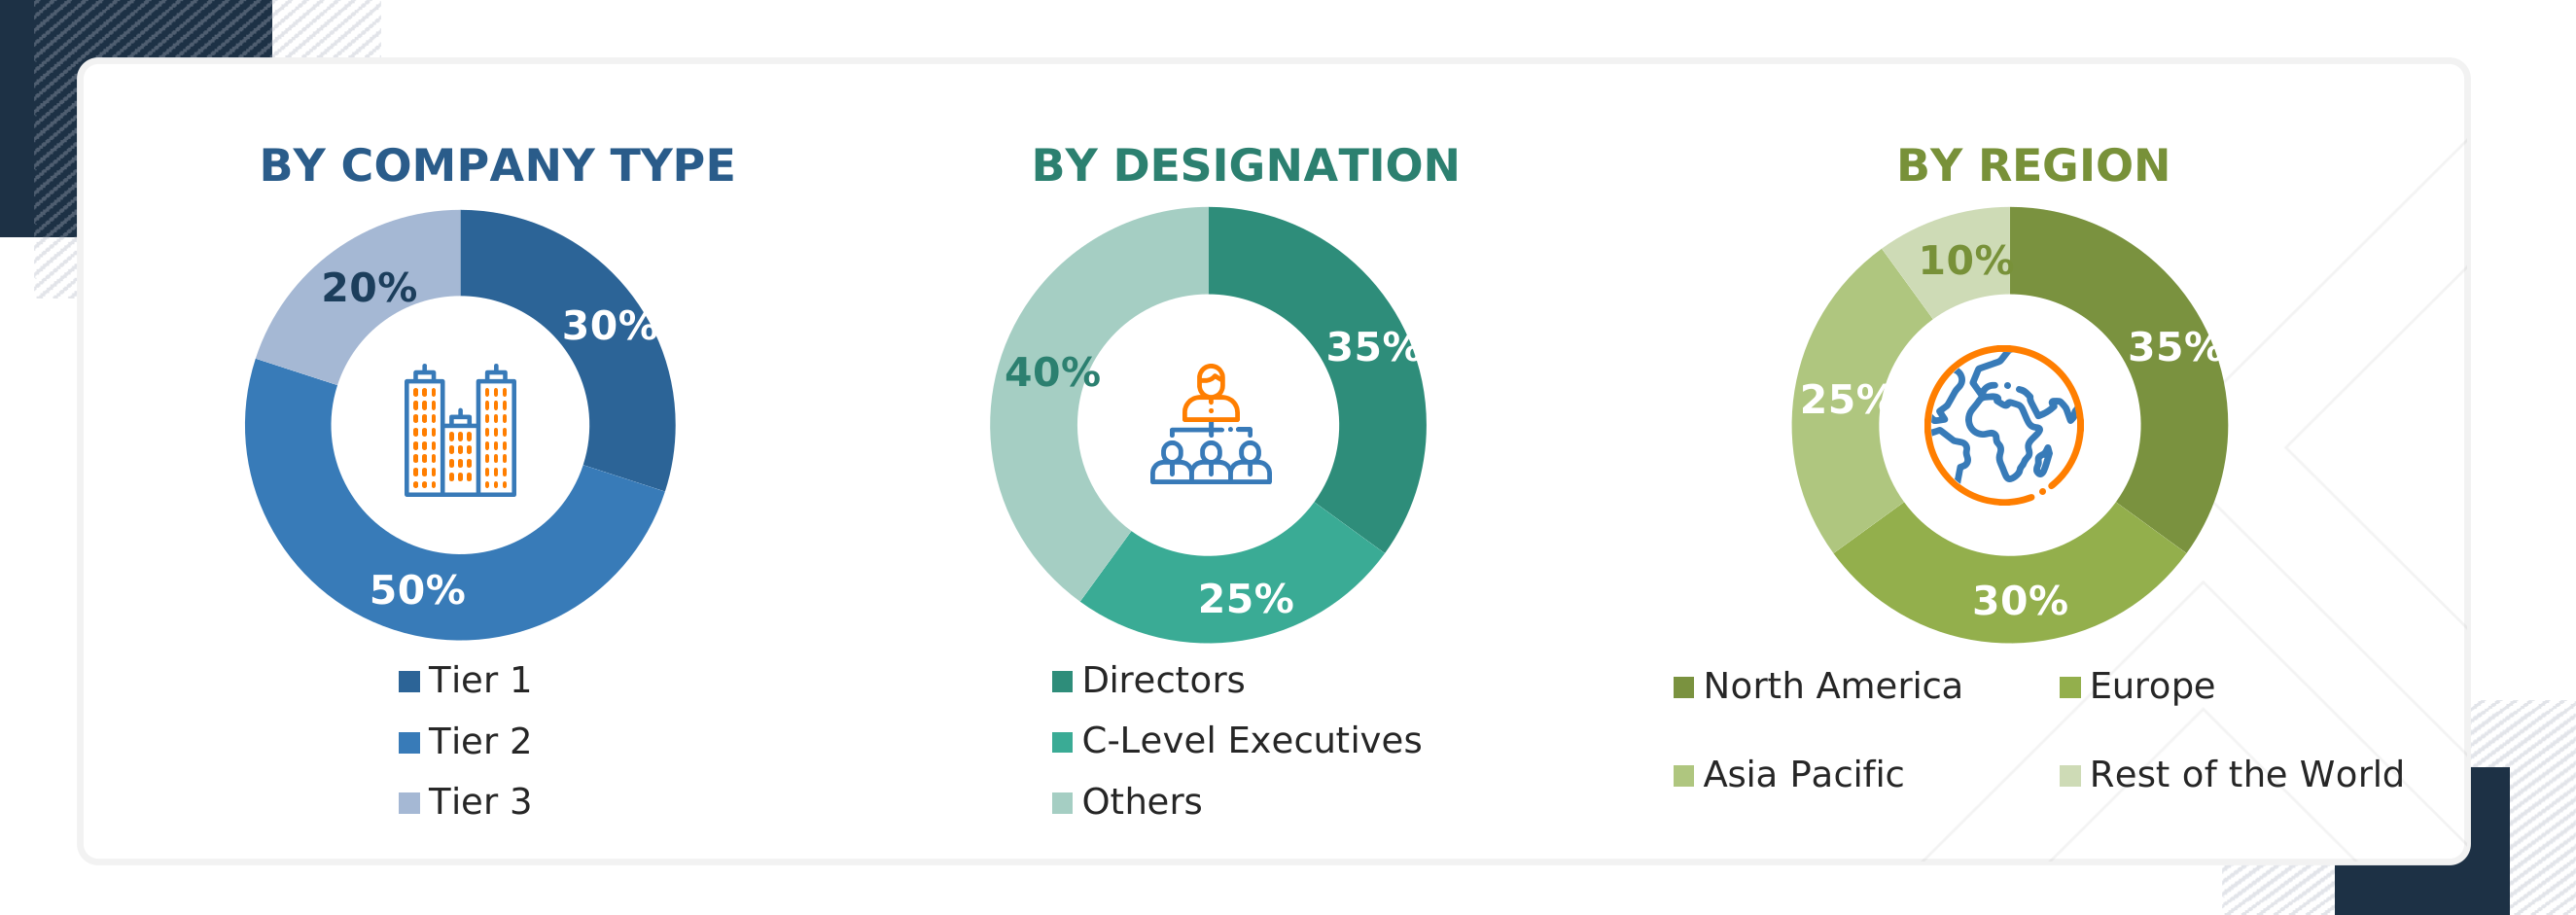
Notes: RoW mainly comprises the Middle East, Africa, and South America.
Other designations include product managers, sales managers, and marketing managers.
Three tiers of companies have been defined based on their total revenue as of 2024; tier 3: revenue less than USD 500 million; tier 2: revenue between USD 500 million and 1 billion; and tier 1: revenue more than USD 1 billion.
To know about the assumptions considered for the study, download the pdf brochure
Market Size Estimation
In the market engineering process, both top-down and bottom-up approaches, along with data triangulation methods, have been used to estimate and validate the size of the microdisplay market and other dependent submarkets. The research methodology used to estimate the market sizes includes the following:
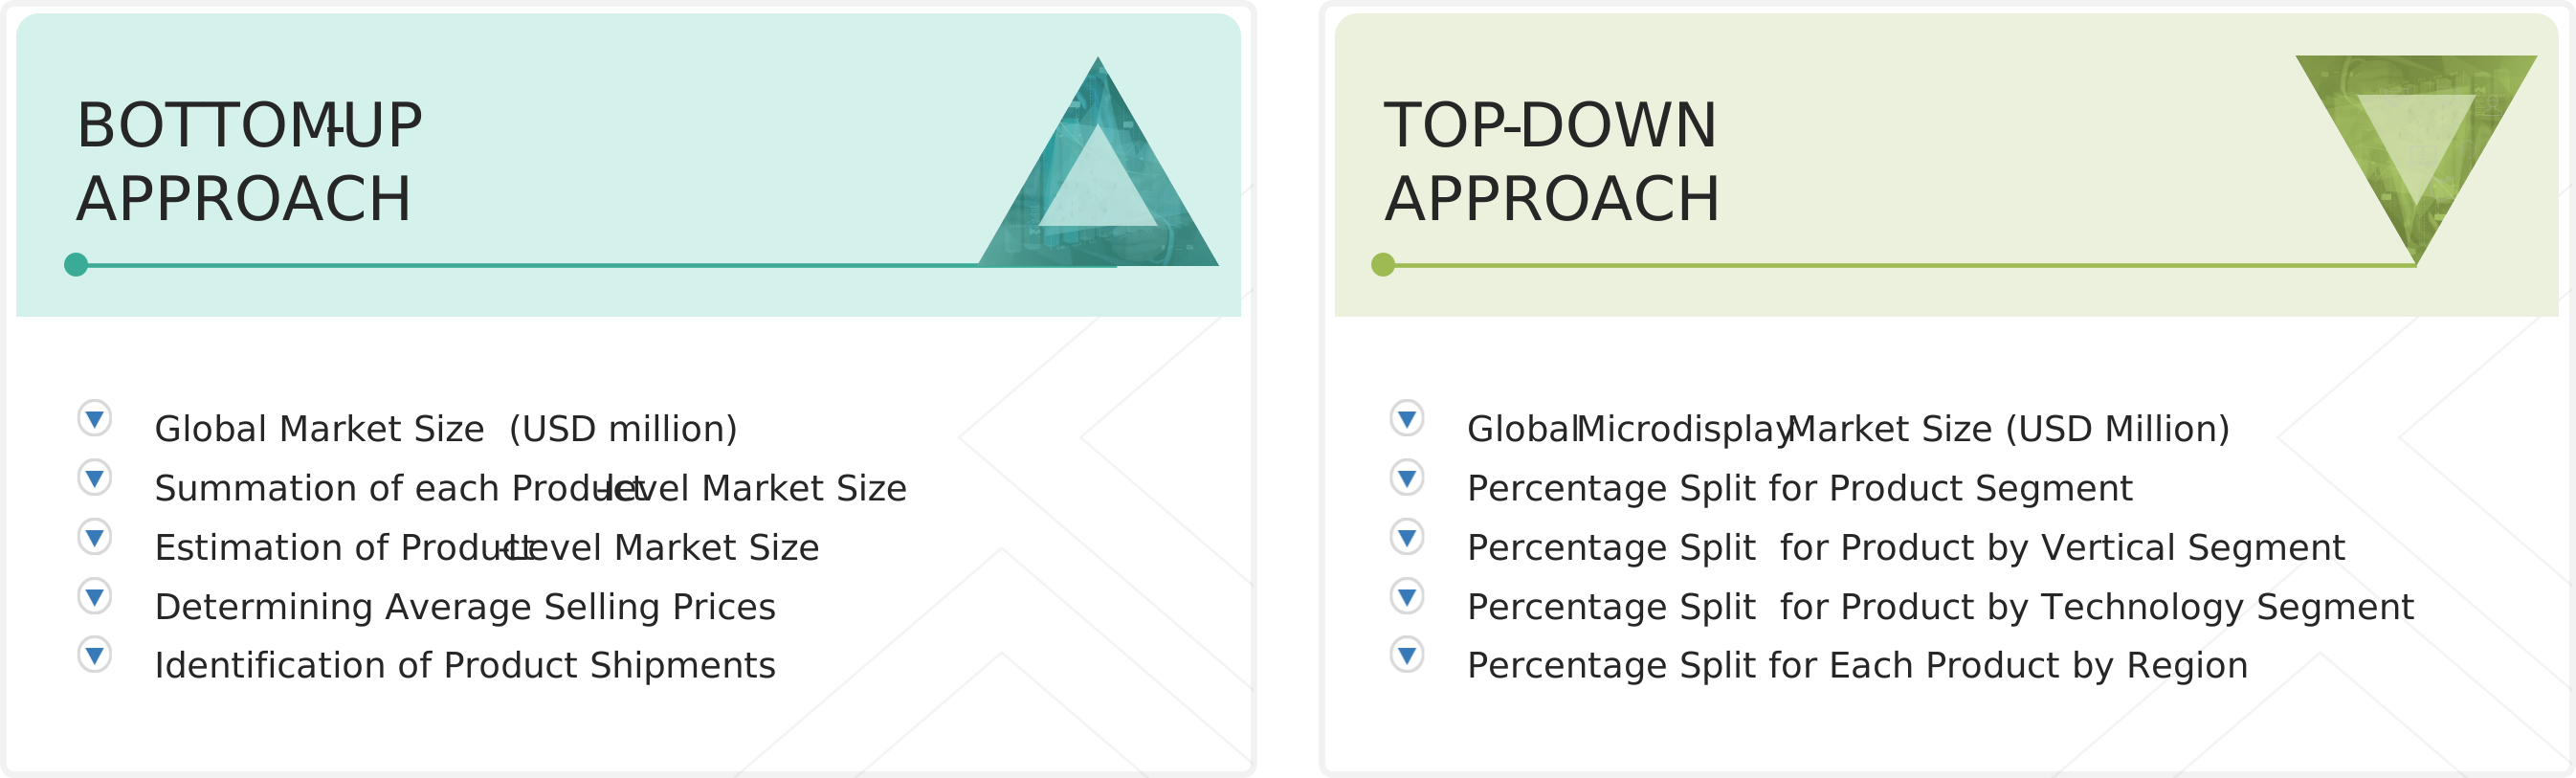
Approach to arrive at market size using bottom-up analysis (demand side):
- Extracted shipment data for each product category within the microdisplay market, which included near-to-eye devices, head-up devices, projectors, and other applications. This step allowed us to establish a clear understanding of the volume contribution of each segment.
- The average selling price (ASP) corresponding to each product category was identified. This ensured that price variations across different products and technologies were adequately reflected in our calculations.
- The ASPs were then multiplied by shipment volumes for each product category to derive the market size at the product level.
- Once the product-level market sizes were determined, they were aggregated across all categories to arrive at the overall global market size for microdisplays.
- To cross-verify the market sizing, the revenues of the key players in the microdisplay ecosystem were identified.
- The segmental revenue of each key player was then analyzed by understanding their contributions specific to microdisplay technologies and products within the scope of the study.
- Finally, the segmental revenues of these players were summed, which provided a secondary estimate of the global market size. The figure obtained through both processes was then finalized and re-verified through secondary sources and primary respondents.
- The figures are verified and cross-checked at every level through discussions with key opinion leaders, such as CXOs, directors, and operations managers, and finally with domain experts in MarketsandMarkets.
Approach to arrive at market size using top-down analysis (supply side)
- The overall market size for each major product category in the microdisplay market was identified through shipments.
- From this product-level data, the figures were further divided into verticals, capturing the demand contribution across key industries such as consumer, automotive, industrial & enterprise, military, defense & aerospace, retail & hospitality, medical, sports & entertainment education, and other verticals.
- The product-level market size was then further divided into technology categories, such as OLED, LCOS, LCD, DLP, and micro-LED, to capture adoption trends and pricing variations by technology type.
- The product-level data was further broken down by geographic regions, reflecting adoption trends, presence of key players, and demand patterns across North America, Europe, Asia Pacific, and RoW.
- By applying this top-down methodology, this research indicates a comprehensive view of the global microdisplay market, linking each product segment with its respective vertical, technology, and regional distribution.
Microdisplay Market: Top-Down and Bottom-Up Approach
Data Triangulation
After arriving at the overall market size using the market size estimation processes as explained above, the market has been split into several segments and subsegments. To complete the entire market engineering process and arrive at the exact statistics of each market segment and subsegment, data triangulation and market breakdown procedures have been employed, wherever applicable. The data has been triangulated by studying various factors and trends from the demand and supply sides in the microdisplay market.
Market Definition
The microdisplay market comprises ultra-small display panels, which are less than two inches in diagonal size, that deliver high resolution, low power consumption, and superior image quality for compact and precision-based applications. Built on technologies such as liquid crystal display (LCD), liquid crystal on silicon (LCoS), organic light-emitting diode (OLED), digital light processing (DLP), and micro-LED, these displays are integral to augmented and virtual reality (AR/VR) headsets, head-up displays (HUDs), electronic viewfinders, projectors, smart glasses, medical imaging systems, military night vision, and industrial wearables. The market is expanding due to rising adoption of immersive technologies, increased demand for lightweight and high-performance displays in consumer, automotive, healthcare, and defense sectors, and continuous innovations in brightness, pixel density, and AI-enabled imaging, positioning microdisplays as a key enabler of next-generation visual interfaces.
Key Stakeholders
- Brand Product Manufacturers/Original Equipment Manufacturers (OEMs)/Original Device Manufacturers (ODMs)
- Microdisplay Product Manufacturers
- Microdisplay Panel Manufacturers
- Semiconductor Component Suppliers/Foundries
- Microdisplay Material and Component Suppliers
- Manufacturing Equipment Suppliers
- System Integrators
- Technology/IP Developers
- Consulting and Market Research Service Providers
- Microdisplay and Material-related Associations, Organizations, Forums, and Alliances
- Venture Capitalists and Startups
- Research and Educational Institutes
- Distributors and Resellers
- End Users
Report Objectives
- To define, describe, and forecast the size of the microdisplay market by technology, resolution, size, product, and vertical in terms of value
- To forecast the size of the microdisplay market, by product, in terms of value and volume
- To forecast the size of various segments of the market with respect to four regions, namely, North America, Europe, Asia Pacific, and the Rest of the World (RoW)
- To analyze the emerging applications/use cases in the microdisplay market
- To identify key microdisplay manufacturers and analyze their product offerings in the market
- To strategically analyze trends/disruptions impacting customer business, pricing analysis, technology analysis, key stakeholders & buying criteria, case study analysis, trade analysis, patent analysis, Porter’s five forces, key conferences & events, AI impact, impact of 2025 US tariff, and regulations related to the microdisplay market
- To provide detailed information regarding drivers, restraints, opportunities, and challenges influencing the growth of the market
- To strategically analyze micromarkets1 with respect to individual growth trends, prospects, and contributions to the overall market
- To analyze market opportunities for stakeholders and provide details of the competitive landscape
- To analyze competitive developments, such as collaborations, agreements, contracts, partnerships, mergers & acquisitions, and product launches & developments in the market
- To strategically profile key players and comprehensively analyze their market share and core competencies2
Available Customizations
With the given market data, MarketsandMarkets offers customizations according to the company‘s specific needs. The following customization options are available for the report.
Company Information:
- Detailed analysis and profiling of additional market players (up to five)
Get the Full Microdisplay Market Report
Full forecast, segment splits, and company analysis for all Microdisplay Market.
- US Microdisplay Market
- Canada Microdisplay Market
- Mexico Microdisplay Market
- Germany Microdisplay Market
- France Microdisplay Market
- UK Microdisplay Market
- Spain Microdisplay Market
- Italy Microdisplay Market
- Poland Microdisplay Market
- China Microdisplay Market
- Japan Microdisplay Market
- South Korea Microdisplay Market
- Taiwan Microdisplay Market
- India Microdisplay Market
- Australia Microdisplay Market
- Indonesia Microdisplay Market
- Malaysia Microdisplay Market
- Thailand Microdisplay Market
- Vietnam Microdisplay Market
- Nordics Microdisplay Market
- Rest Of Europe Microdisplay Market
- Rest Of Asia Pacific Microdisplay Market
- Africa Microdisplay Market
- Middle East Microdisplay Market
- South America Microdisplay Market
- Bahrain Microdisplay Market
- Kuwait Microdisplay Market
- Oman Microdisplay Market
- Qatar Microdisplay Market
- Rest Of Middle East Microdisplay Market
- Saudi Arabia Microdisplay Market
- UAE Microdisplay Market
- Other African Countries Microdisplay Market
- South Africa Microdisplay Market
Need a Tailored Report?
Customize this report to your needs
Get 10% FREE Customization
Customize This Report
