
Rest Of Europe Phosphoric Acid Market (2025-2030)

The Rest Of Europe Phosphoric Acid Market was valued at $2681.9 Million in 2025 and projected to reach to $3107 Million by 2030, representing a compound annual growth rate of 2.99%. Rest Of Europe's phosphoric acid market demonstrates steady growth driven by consistent demand from the fertilizer sector and established chemical manufacturing infrastructure.


| Market Size in | USD 26.32 MN |
| Market Forecast in | |
| CAGR | |
| Forecast Period | |
| Units Considered | Value (USD MN) |
Rest Of Europe Phosphoric Acid Market Trends and Insights
- This moderate growth trajectory reflects Rest Of Europe's established industrial base and steady demand from fertilizer, food processing, and chemical manufacturing sectors.
- Rest Of Europe maintains a significant share of European phosphoric acid consumption, driven by agricultural activities and industrial applications across multiple countries in the region. The phosphoric acid market in Rest Of Europe is characterized by stable demand patterns and mature supply chains.
- Rest Of Europe's growth rate of 2.99% is notably lower than the global CAGR of 4.06%, indicating a more conservative expansion compared to emerging markets.
- Between 2025 and 2030, Rest Of Europe is expected to add approximately USD 425.1 million in market value, supported by ongoing industrial production and agricultural nutrient requirements.
- Rest Of Europe's phosphoric acid sector continues to benefit from established infrastructure and regulatory frameworks that support chemical manufacturing and distribution..
Key Market Statistics
- CAGR (2025-2030) 2.99% CAGR
- Market Size, 2025 ~USD 2681.9 Million
- Forecast, 2030 ~USD 3107 Million
- Country Rest Of Europe
Rest Of Europe Phosphoric Acid Market Overview
Steady Regional Growth :
Rest Of Europe's phosphoric acid market is estimated at USD 2,681.9 million in 2025, growing to USD 3,107.0 million by 2030 at a CAGR of 2.99%, reflecting stable demand across established industrial sectors.
Fertilizer Sector Dominance :
The fertilizer industry remains the primary driver of phosphoric acid consumption in Rest Of Europe, supported by agricultural practices and crop nutrient requirements across the region's farming communities.
Diversified End-Use Applications :
Rest Of Europe benefits from phosphoric acid demand across food processing, chemical manufacturing, and industrial applications, reducing dependency on any single market segment and ensuring resilient growth.
Moderate Growth vs. Global Trends :
At 2.99% CAGR, Rest Of Europe grows slower than the global market's 4.06%, indicating mature market dynamics with established infrastructure and competitive saturation in key industrial hubs.
Rest Of Europe Phosphoric Acid Market Dynamics
- The region's mature industrial base supports reliable consumption patterns, though growth rates remain moderate compared to emerging markets.
- Agricultural sustainability initiatives and food processing expansion provide incremental growth opportunities throughout the forecast period. The market outlook for Rest Of Europe remains stable with gradual expansion expected through 2030.
- Regulatory frameworks promoting sustainable agriculture and industrial efficiency will shape market dynamics, while competition from alternative phosphate sources may moderate growth rates.
- Investment in production capacity optimization and supply chain resilience will be critical for market participants seeking to capture growth in this established regional market..
Market Ecosystem
Related Ecosystem
Bulk Chemicals And Inorganics
- Corrosion Inhibitors
- Glycol Ethers
- Acetic Acid
- Acetone
- Ammonium Nitrate
- Basf se
- DOW CHEMICAL COMPANY
- Exxon Mobil Corporation
- AZELIS HOLDINGS SA
- Sinopec limited
Key Takeaways
- Rest Of Europe's phosphoric acid market is valued at USD 2,681.9 million in 2025 with projected growth to USD 3,107.0 million by 2030.
- Rest Of Europe exhibits a CAGR of 2.99%, reflecting slower growth compared to the global average of 4.06%.
- Rest Of Europe's market expansion is driven by stable demand from fertilizer production, food processing, and industrial chemical applications.
- Rest Of Europe's established infrastructure and regulatory environment support consistent phosphoric acid production and distribution through 2030.
Phosphoric Acid Market Report Scope
| Report Metric | Details |
|---|---|
| Base Year | 2025 |
| Fastest Growing Segment | FEED & FOOD ADDITIVES (Application) |
| Forecast Period | 2025-2030 |
| Growth Rate | CAGR of 4.06% from 2025 to 2030 |
| Largest Segment | WET PROCESS (Process Type) |
| Market Size Base Year (Billions) | ~USD 116.49 (2025) |
| Revenue Forecast (Billions) | ~USD 142.14 (2030) |
| Segments Covered | Application, Process Type |
Rest Of Europe Phosphoric Acid Market Report Segmentation
2 segment dimensions are covered across the global market.
By Application
- Detergents
- Feed & Food Additives
- Fertilizers
- Industrial Use
- Metal Finishing
- Other Application
- Other Applications
- Water Treatment Chemicals
By Process Type
- Thermal Process
- Wet Process
Target Audience
- Phosphoric Acid Manufacturers : Regional producers need Rest Of Europe-specific market data to optimize production capacity, identify distribution opportunities, and compete effectively in this mature, established market.
- Fertilizer & Agricultural Companies : Agricultural input suppliers require detailed insights into Rest Of Europe's phosphoric acid demand trends to secure raw materials, plan inventory, and support crop nutrient strategies.
- Chemical & Industrial Processors : Food processing and chemical manufacturing companies need regional market intelligence to forecast phosphoric acid requirements, negotiate supplier contracts, and plan operational expansion.
- Investment & Private Equity Firms : Investors evaluating opportunities in Rest Of Europe's chemical sector require comprehensive market analysis, growth projections, and competitive dynamics to assess portfolio potential.
- Trade & Industry Associations : Regional industry bodies need market data to advocate for member interests, inform policy recommendations, and provide members with competitive intelligence specific to Rest Of Europe.
Reasons to Buy this Report
- Regional Market Sizing & Forecasts : Obtain precise market valuations for Rest Of Europe (USD 2,681.9M in 2025, USD 3,107.0M in 2030) with detailed CAGR analysis to support strategic planning and investment decisions specific to the region.
- Sector-Specific Demand Insights : Understand phosphoric acid consumption patterns across Rest Of Europe's fertilizer, food processing, and chemical manufacturing sectors to identify high-growth opportunities and market gaps.
- Competitive Landscape Assessment : Benchmark your position against regional competitors with insights into market saturation, pricing dynamics, and competitive strategies specific to Rest Of Europe's established industrial base.
- Growth Driver Identification : Identify key growth catalysts and restraints unique to Rest Of Europe, including regulatory trends, agricultural practices, and industrial expansion plans through 2030.
- Strategic Market Entry & Expansion : Develop targeted go-to-market strategies for Rest Of Europe with data-driven insights on regional demand patterns, customer segments, and market penetration opportunities.
Frequently asked questions
What is the current market size of phosphoric acid in Rest Of Europe?
Rest Of Europe's phosphoric acid market is estimated at USD 2,681.9 million in 2025.
What is the projected market size for Rest Of Europe by 2030?
Rest Of Europe's phosphoric acid market is forecasted to reach USD 3,107.0 million by 2030.
What is the CAGR for Rest Of Europe's phosphoric acid market?
Rest Of Europe's phosphoric acid market is expected to grow at a CAGR of 2.99% from 2025 to 2030.
How does Rest Of Europe's growth rate compare to global trends?
Rest Of Europe's CAGR of 2.99% is lower than the global CAGR of 4.06%, indicating more moderate growth in the region.
What are the primary drivers of phosphoric acid demand in Rest Of Europe?
Rest Of Europe's phosphoric acid demand is primarily driven by fertilizer production, food processing applications, and industrial chemical manufacturing.
RESEARCH METHODOLOGY
The study involved four major activities in estimating the market size for phosphoric acid. Exhaustive secondary research was conducted to gather information on the market, including peer and parent markets. The next step was to validate these findings, assumptions, and sizing with industry experts across the value chain through primary research. Both top-down and bottom-up approaches were used to estimate the total market size. Subsequently, market breakdown and data triangulation methods were applied to determine the sizes of segments and subsegments.
Secondary Research
Secondary sources used in this study included annual reports, press releases, and investor presentations of companies; white papers; certified publications; articles from recognized authors; and gold standard & silver standard websites such as Factiva, ICIS, and Bloomberg. The findings of this study were verified through primary research by conducting extensive interviews with key officials such as CEOs, VPs, directors, and other executives.
Primary Research
The phosphoric acid market comprises several stakeholders, such as raw material suppliers, end-product manufacturers, and regulatory organizations in the supply chain. The demand side of this market is characterized by key opinion leaders in various applications for the phosphoric acid market. The supply side is characterized by advancements in technology and diverse application industries. Various primary sources from both the supply and demand sides of the market were interviewed to obtain qualitative and quantitative information.
The breakdown of profiles of the primary interviewees is illustrated in the figure below:
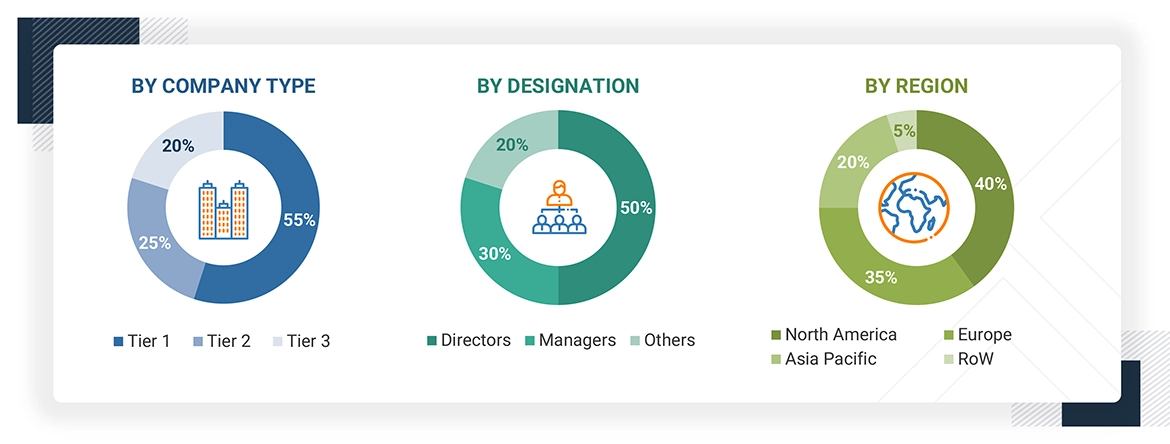
Note: Tier 1, Tier 2, and Tier 3 companies are classified based on their market revenue in 2023/2024, available in the public domain, product portfolios, and geographical presence.
Other designations include consultants and sales, marketing, and procurement managers.
To know about the assumptions considered for the study, download the pdf brochure
| COMPANY NAME | DESIGNATION | |
|---|---|---|
| OCP Group | Senior Manager | |
| The Mosaic Company | Innovation Manager | |
| PJSC PhosAgro | Vice-President | |
| ICL Group Ltd. | Production Supervisor | |
| Nutrien Ltd. | Sales Manager | |
Market Size Estimation
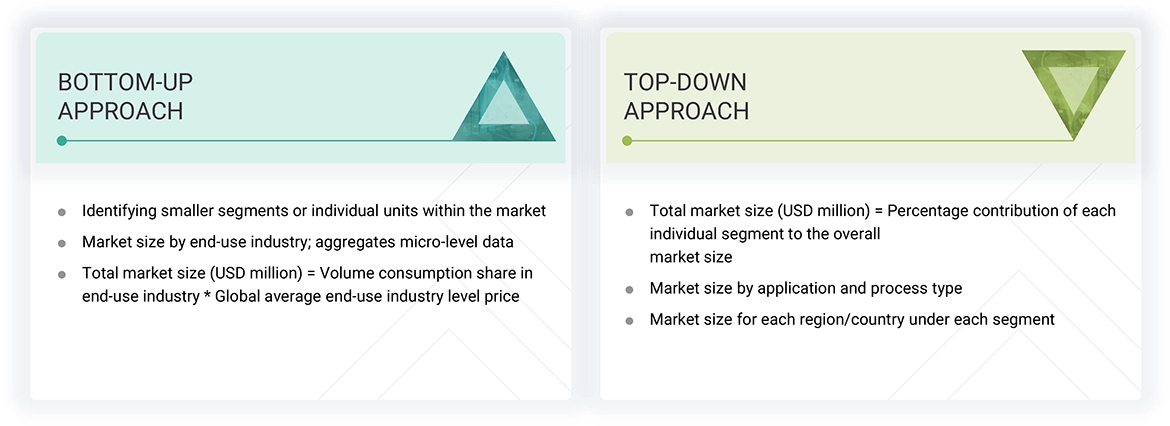
Both top-down and bottom-up approaches were used to estimate and validate the total size of the phosphoric acid market. These methods were also used extensively to estimate the size of various subsegments in the market. The research methodology used to estimate the market size includes the following:
- The key players in the industry have been identified through extensive secondary research.
- The supply chain of the industry has been determined through primary and secondary research.
- All percentage shares, splits, and breakdowns have been determined using secondary sources and verified through primary sources.
- All possible parameters that affect the markets covered in this research study have been accounted for, viewed in extensive detail, verified through primary research, and analyzed to obtain the final quantitative and qualitative data.
Data Triangulation
After arriving at the overall market size—using the market size estimation processes as explained above—the market was split into several segments and subsegments. To complete the overall market engineering process and arrive at the exact statistics of each market segment and subsegment, data triangulation, and market breakdown procedures were employed, wherever applicable. The data was triangulated by studying various factors and trends from both the demand and supply sides in the phosphoric acid industry.
Market Definition
According to the Phosphoric Acid and Phosphates Association, "Phosphates are inorganic compounds that exist in various food products and are manufactured synthetically from phosphoric acid.” Phosphoric acid is an inorganic type of acid that is derived from one or more inorganic compounds. The key raw materials for phosphoric acid production are rock phosphate, sulfuric acid, and elemental phosphorus. Phosphoric acid is manufactured from two major processes, the wet process and the thermal process. The wet process is the most commonly used for phosphoric acid production. The thermal process is used to produce high-purity phosphoric acid.
Stakeholders
- Phosphoric acid manufacturers
- Phosphoric acid distributors
- Raw material suppliers
- Government and research organizations
- Investment banks and private equity firms
Report Objectives
- To define, describe, and forecast the phosphoric acid market in terms of value and volume
- To provide detailed information regarding significant drivers, opportunities, restraints, and challenges, influencing market growth
- To estimate and forecast the market size by process type, application, and region
- To forecast the size of the market with respect to five main regions (along with key countries of each region): Asia Pacific, North America, Europe, the Middle East & Africa, and South America
- To strategically analyze micromarkets with respect to individual growth trends, prospects, and their contribution to the overall market
- To analyze opportunities in the market for stakeholders and provide a competitive landscape of the market leaders
- To analyze competitive developments, such as product launches, acquisitions, partnerships, and expansions
- To strategically profile the key players and comprehensively analyze their core competencies
Get the Full Phosphoric Acid Market Report
Full forecast, segment splits, and company analysis for all Phosphoric Acid Market.
- China Phosphoric Acid Market
- India Phosphoric Acid Market
- Indonesia Phosphoric Acid Market
- Australia Phosphoric Acid Market
- Pakistan Phosphoric Acid Market
- US Phosphoric Acid Market
- Mexico Phosphoric Acid Market
- Canada Phosphoric Acid Market
- France Phosphoric Acid Market
- Poland Phosphoric Acid Market
- Russia Phosphoric Acid Market
- Spain Phosphoric Acid Market
- Turkey Phosphoric Acid Market
- Brazil Phosphoric Acid Market
- Argentina Phosphoric Acid Market
- Egypt Phosphoric Acid Market
- Rest Of Asia Pacific Phosphoric Acid Market
- GCC Countries Phosphoric Acid Market
- Morocco Phosphoric Acid Market
- -Rest Of GCC Phosphoric Acid Market
- Rest Of South America Phosphoric Acid Market
Need a Tailored Report?
Customize this report to your needs
Get 10% FREE Customization
Customize This Report
