
US Preclinical Imaging Market (2024-2029)

The US Preclinical Imaging Market was valued at $114.2 Million in 2024 and projected to reach to $141.1 Million by 2029, representing a compound annual growth rate of 4.3%. The US preclinical imaging market is poised for steady growth through 2029, supported by robust pharmaceutical R&D budgets and the presence of leading academic research institutions.


| Market Size in | USD 26.32 MN |
| Market Forecast in | |
| CAGR | |
| Forecast Period | |
| Units Considered | Value (USD MN) |
US Preclinical Imaging Market Trends and Insights
- The US market benefits from advanced research infrastructure, substantial pharmaceutical and biotechnology investment, and strong academic research institutions driving demand for preclinical imaging technologies.
- In the US, adoption of multimodal imaging systems and increased funding for drug discovery pipelines are accelerating market expansion through 2029. The US preclinical imaging sector is characterized by significant technological innovation and competitive intensity among imaging solution providers.
- US research organizations increasingly leverage preclinical imaging to reduce development timelines and improve drug candidate selection, supporting the market's steady growth trajectory.
- The US market's maturity and regulatory environment position it as a critical hub for preclinical imaging adoption and advancement..
Key Market Statistics
- CAGR (2024-2029) 4.3% CAGR
- Market Size, 2024 ~USD 114.2 Million
- Forecast, 2029 ~USD 141.1 Million
- Country US
US Preclinical Imaging Market Overview
Market Size & Growth :
The US preclinical imaging market reached $114.2 million in 2024 and is expected to grow to $141.1 million by 2029, representing a steady CAGR of 4.3% driven by increased R&D spending in pharmaceutical and biotech sectors.
Research Infrastructure Leadership :
The US maintains world-class research institutions and academic medical centers that drive significant demand for advanced preclinical imaging technologies, supporting drug discovery and development pipelines across the nation.
Pharmaceutical & Biotech Investment :
Substantial capital allocation from US pharmaceutical companies and biotechnology firms toward preclinical research fuels adoption of imaging modalities including MRI, PET, CT, and optical imaging systems.
Technology Advancement :
Continuous innovation in imaging resolution, speed, and multimodal capabilities positions the US market at the forefront of preclinical imaging technology adoption and development.
US Preclinical Imaging Market Dynamics
- Increasing complexity in drug development and the need for early-stage efficacy and safety assessment will continue to drive demand for sophisticated imaging technologies.
- The market will benefit from ongoing technological advancements in multimodal imaging systems and software analytics. Key growth drivers include rising investment in personalized medicine research, expansion of biotech startups, and regulatory requirements for comprehensive preclinical data.
- The US market's maturity and high adoption rates of cutting-edge imaging technologies position it as a stable, growth-oriented segment within the global preclinical imaging landscape..
Market Ecosystem

Preclinical Imaging Market: COMMERCIAL USE CASES ACROSS INDUSTRIES
| COMPANY | USE CASE DESCRIPTION | BENEFITS |
|---|---|---|
 |
Use of PET/MRI, PET/SPECT/CT, and micro-MRI systems for oncology, neurology, and cardiovascular preclinical research. | High-resolution multimodal imaging enables the detection of biomarkers earlier, improves disease modeling, and reduces animal usage. |
 |
Optical/bioluminescence/fluorescence imaging for tracking tumor burden, cell trafficking, and gene expression in vivo. | Real-time molecular imaging accelerates drug discovery, reduces study timelines, and allows non-terminal longitudinal studies. |
 |
In vivo confocal endomicroscopy for preclinical tissue micro-architecture assessment. | Provides cellular-level imaging without the need for invasive biopsy, thereby improving tissue-level validation in drug toxicology. |
 |
Ultra-high-frequency ultrasound & photoacoustic imaging for cardiovascular, oncology, and developmental biology. | Enables non-invasive functional imaging (blood flow, oxygenation) with unmatched resolution for small animals. |
 |
Preclinical PET/CT and PET/SPECT platforms for high-sensitivity molecular imaging. | High detector sensitivity supports low-dose protocols and cost-efficient radiotracer studies. |
Logos and trademarks shown above are the property of their respective owners. Their use here is for informational and illustrative purposes only.
Related Ecosystem
Diagnostic Imaging
- Magnetic Resonance Imaging (MRI)
- Computed Tomography (CT)
- CT Scanners
- Nuclear Imaging
- Positron Emission Tomography
- Siemens healthineers
- PHILIPS HEALTHCARE
- CANON INC.
- FUJIFILM Holdings Corporation
- UNITED IMAGING HEALTHCARE CO., LTD.
Medical Devices
- Polymerase Chain Reaction (PCR)
- Magnetic Resonance Imaging (MRI)
- Disposable Autoinjectors
- Pulse Oximeters
- Blood Pressure Monitors
- Medtronic plc
- Abbott Laboratories
- Stryker Corporation
- Becton, Dickinson and Company
- CONMED Corporation
Key Takeaways
- The US preclinical imaging market is valued at $114.2 million in 2024 and will reach $141.1 million by 2029.
- The US market grows at a 4.3% CAGR, driven by pharmaceutical R&D investment and academic research demand.
- US adoption of multimodal and advanced imaging technologies is accelerating drug discovery and development efficiency.
- The US maintains a competitive landscape with strong innovation and regulatory support for preclinical imaging solutions.
Preclinical Imaging Market Report Scope
| Report Metric | Details |
|---|---|
| Base Year | 2024 |
| Fastest Growing Segment | NUCLEAR IMAGING SYSTEMS (Type) |
| Forecast Period | 2024–2029 |
| Growth Rate | CAGR of 5% from 2024 to 2029 |
| Largest Segment | PHARMACEUTICAL & BIOTECHNOLOGY COMPANIES (End User) |
| Market Size Base Year (Billions) | ~USD 4 (2024) |
| Revenue Forecast (Billions) | ~USD 5.1 (2029) |
| Segments Covered | Product, Type, Application, End User |
US Preclinical Imaging Market Report Segmentation
4 segment dimensions are covered across the global market.
By Product
- Imaging Systems
- Reagents
- Software
By Type
- Barium-Based Contrast Agents
- Bioluminescence Imaging Systems
- Fluorescence Imaging Systems
- Gadolinium-Based Contrast Agents
- Gallium-67-Based Spect Probes
- Gastrografin-Based Contrast Agents
- Gold Nanoparticles
- Iodine-131-Based Spect Probes
- Iodine-Based Contrast Agents
- Iron-Based Contrast Agents
- Magnetic Particle Imaging Systems
- Manganese-Based Contrast Agents
- Micro-Ct Systems
- Micro-Mri Systems
- Micro-Ultrasound Systems
- Nuclear Imaging Systems
- Optical Imaging Systems
- Other Optical Imaging Systems
- Other Spect Probes
- Photoacoustic Imaging Systems
- Technetium-99M-Based Spect Probes
- Thallium-201-Based Spect Probes
By Application
- Cardiology
- Immunology & Inflammation
- Infectious Diseases
- Neurology
- Oncology
- Other Applications
By End User
- Academic & Research Centers
- Imaging Centers
- Other End Users
- Pharmaceutical & Biotechnology Companies
US: PRECLINICAL IMAGING MARKET, BY END USER, 2023–2029
| Segment | 2023 | 2024 | 2025 | 2026 | 2027 | 2028 | 2029 | CAGR (%) |
|---|---|---|---|---|---|---|---|---|
| ACADEMIC & RESEARCH CENTERS | 178.6 | 188.1 | 198 | 208.5 | 219.5 | 231 | 243.2 | 5.3 |
| IMAGING CENTERS | 100.5 | 106.2 | 112.2 | 118.6 | 125.3 | 132.5 | 140 | 5.7 |
| OTHER END USERS | 44.7 | 46.4 | 48.2 | 50.1 | 52 | 54 | 56.1 | 3.9 |
| PHARMACEUTICAL & BIOTECHNOLOGY COMPANIES | 792.5 | 832.1 | 873.6 | 917.1 | 962.8 | 1010.7 | 1061 | 5 |
| TOTAL | 1116.3 | 1172.7 | 1232 | 1294.3 | 1359.6 | 1428.3 | 1500.3 | 5.1 |
Target Audience
- Pharmaceutical Companies : US pharma firms require detailed market insights to optimize preclinical imaging investments, evaluate technology partnerships, and align R&D budgets with market growth trends.
- Biotech & CRO Organizations : Biotechnology companies and contract research organizations need US market data to justify imaging technology acquisitions, benchmark operational costs, and enhance competitive positioning.
- Medical Device Manufacturers : Imaging equipment and software vendors require US-specific market analysis to identify growth segments, assess market penetration opportunities, and develop targeted sales strategies.
- Academic & Research Institutions : US universities and research centers use market intelligence to secure funding, justify equipment purchases, and demonstrate alignment with industry trends and research priorities.
- Investment & Private Equity Firms : Investors evaluating preclinical imaging companies need US market forecasts and growth metrics to assess portfolio opportunities, valuation benchmarks, and exit potential.
Key Companies in the US Preclinical Imaging Market
| Company | HQ | Ownership | Strongest segments |
|---|---|---|---|
| PATHEON INC | Netherlands | Private Company | Optical Imaging (Bioluminescance),PET,SPECT, |
| ANALOGIC CORPORATION | United States | Private Company | MRI,PET,SPECT, |
| XILINX, INC. | United States | Private Company | Optical Imaging (Bioluminescance),PET,SPECT, |
| GUERBET GROUP | France | InvalidIdentifier | PET,SPECT,MRI, |
| BRUKER CORPORATION | United States | Public Company | MRI,PET,SPECT, |
| REVVITY, INC. | United States | Public Company | Optical Imaging (Bioluminescance),PET,SPECT, |
| OPTISCAN IMAGING LTD. | Australia | Public Company | Optical Imaging (Bioluminescance),PET,SPECT, |
PATHEON INC
Patheon Inc. is a Netherlands-based private company with 9,100 employees operating in the pharmaceutical and life sciences sector.
ANALOGIC CORPORATION
Analogic Corporation is a United States-based private company founded in 1967 with 1,510 employees, specializing in medical and aerospace technology solutions.
XILINX, INC.
Xilinx, Inc. is a United States-based private company founded in 1984 with 4,890 employees, operating in the semiconductor and programmable logic industry.
GUERBET GROUP
Guerbet Group is a France-based company in the medical imaging and pharmaceutical sector.
BRUKER CORPORATION
Bruker Corporation is a United States-based public company founded in 1960 with 11,085 employees, providing scientific instruments and analytical solutions.
REVVITY, INC.
Revvity, Inc. is a United States-based public company founded in 1937 with 11,000 employees, operating in the life sciences and diagnostics industry.
OPTISCAN IMAGING LTD.
Optiscan Imaging Ltd. is an Australia-based public company founded in 1994 with 9 employees, specializing in optical imaging technology.
Reasons to Buy this Report
- Strategic Market Sizing : Obtain precise US market valuation ($114.2M in 2024) and 5-year forecasts to benchmark competitive positioning and identify growth opportunities within the American preclinical imaging landscape.
- Investment Decision Support : Access detailed CAGR analysis (4.3%) and market trajectory data to support capital allocation decisions, M&A strategies, and product development roadmaps tailored to US market dynamics.
- Competitive Intelligence : Understand US-specific market drivers including pharmaceutical R&D spending patterns, academic institution adoption rates, and technology preferences to inform go-to-market strategies.
- Regulatory & Infrastructure Insights : Leverage analysis of US research infrastructure, regulatory environment, and institutional buying patterns to optimize sales strategies and product positioning for American stakeholders.
- Forecast-Driven Planning : Utilize 2029 market projections ($141.1M) to develop long-term business plans, resource allocation strategies, and innovation timelines aligned with anticipated US market expansion.
Frequently asked questions
What is the current size of the US preclinical imaging market?
The US preclinical imaging market was valued at $114.2 million in 2024 and is expected to grow to $141.1 million by 2029.
What is the growth rate of the US preclinical imaging market?
The US preclinical imaging market is projected to grow at a compound annual growth rate (CAGR) of 4.3% from 2024 to 2029.
What drives growth in the US preclinical imaging market?
Growth in the US market is driven by increased pharmaceutical and biotechnology R&D investment, adoption of multimodal imaging systems, and strong academic research funding.
Which imaging technologies are most adopted in the US market?
The US market shows strong adoption of multimodal imaging systems, optical imaging, microCT, and PET/SPECT technologies for preclinical research applications.
Who are the primary end-users in the US preclinical imaging market?
Primary end-users in the US include pharmaceutical companies, biotechnology firms, contract research organizations (CROs), and academic research institutions.
RESEARCH METHODOLOGY
This market research study utilized extensive secondary sources, directories, and databases to identify and collect information relevant to this technical, market-oriented, and financial analysis of the preclinical imaging market. In-depth interviews were conducted with various primary respondents, including key industry participants, subject-matter experts (SMEs), C-level executives of key market players, and industry consultants, among other experts, to gather and verify critical qualitative and quantitative information, as well as to assess market prospects. The size of the preclinical imaging market was estimated through various secondary research approaches and triangulated with inputs from primary research to arrive at the final market size.
Secondary Research
The secondary research process involved the widespread use of secondary sources, directories, databases (such as Bloomberg Businessweek, Factiva, and D&B Hoovers), white papers, annual reports, company house documents, investor presentations, and SEC filings of companies. Secondary research was employed to identify and collect information relevant to the comprehensive, technical, market-oriented, and commercial study of the preclinical imaging market. It was also used to obtain important information about key players, market classification, and segmentation according to industry trends, as well as key developments related to market and technology perspectives, down to the most detailed level. A database of the key industry leaders was also prepared using secondary research.
Primary Research
Extensive primary research was conducted after acquiring a basic understanding of the global preclinical imaging market scenario through secondary research. Several primary interviews were conducted with market experts from both the demand side (hospital personnel, department heads, hospital directors, corporate personnel) and supply side (such as C-level and D-level executives, technology experts, software developers, marketing and sales managers, among others) across five major regions: North America, Europe, the Asia Pacific, Latin America, and the Middle East & Africa. This primary data was collected through questionnaires, e-mails, online surveys, personal interviews, and telephonic interviews.
Breakdown of Primary Interviews
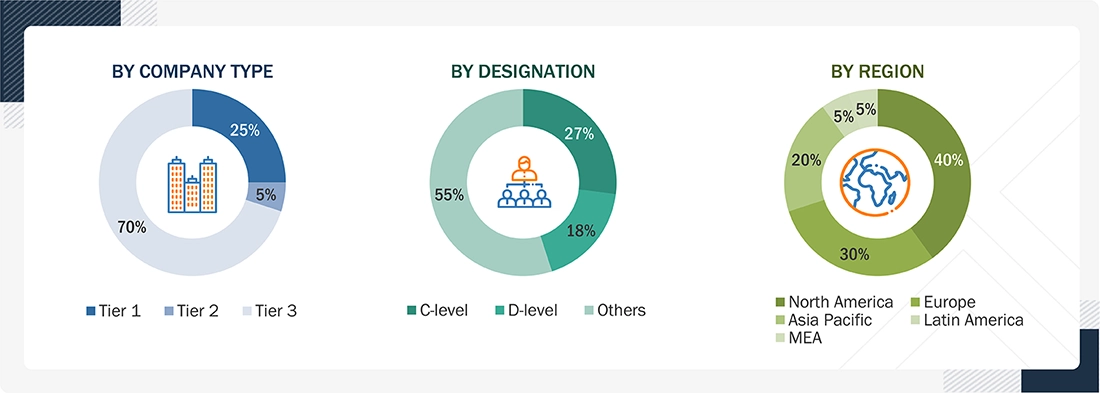
Note: Tiers are defined based on the total revenues of companies. As of 2024, Tier 1 = >USD 1 billion, Tier 2 = USD 500 million to USD 1 billion, and Tier 3 = < USD 500 million.
To know about the assumptions considered for the study, download the pdf brochure
Market Size Estimation
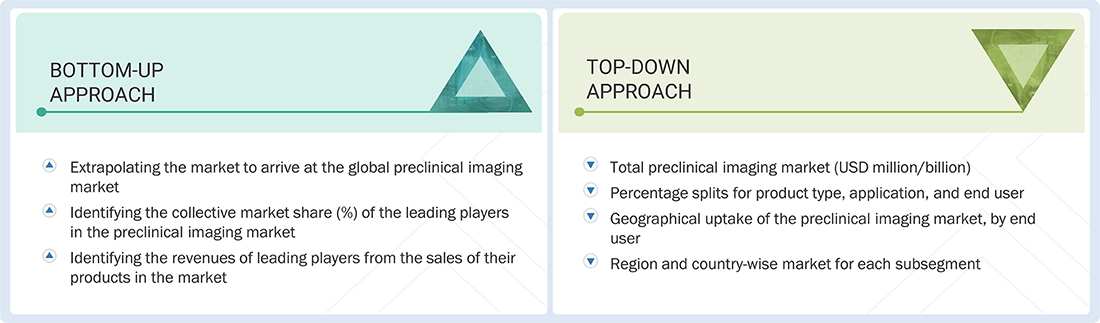
Both top-down and bottom-up approaches were used to estimate and validate the total size of the global preclinical imaging market. These methods were also used extensively to estimate the size of various subsegments in the market. The research methodology used to estimate the market size includes the following:
- Key players in the global preclinical imaging market were identified through secondary research, and their global market shares were determined through primary and secondary research.
- The research methodology included the study of the annual and quarterly financial reports and regulatory filings, data books of major market players, and interviews with industry experts for detailed market insights.
- All percentage shares, splits, and breakdowns for the global preclinical imaging market were determined by using secondary sources and verified through primary sources.
- All key macroindicators affecting the revenue growth of market segments and subsegments have been accounted for, viewed in extensive detail, verified through primary research, and analyzed to get validated and verified quantitative and qualitative data.
- The gathered market data was consolidated and added with detailed inputs and analysis and presented in this report.
Global Preclinical Imaging Market: Bottom-up and Top-down Approach
Data Triangulation
After arriving at the overall market size, from the market size estimation process explained above, the preclinical imaging market was split into segments and subsegments. To complete the overall market engineering process and to arrive at the exact statistics for all segments and subsegments, data triangulation and market breakdown procedures were employed, wherever applicable. The data was triangulated by studying various factors and trends from both the demand and supply sides in the preclinical imaging market.
Market Definition
Preclinical imaging involves the application of molecular imaging for the assessment of anatomical, physiological, and functional parameters in live animal models during preclinical studies. Preclinical imaging systems and reagents are utilized to visualize living animals in order to assess the safety and efficacy of novel drug procedures or other medical treatments for human applications. During preclinical studies, a variety of different imaging modalities are utilized, such as optical imaging systems, nuclear imaging systems (micro-PET and micro-SPECT), micro-MRI, micro-ultrasound systems, and micro-CT imaging systems.
Stakeholders
- Preclinical Imaging Instrument Manufacturers, Suppliers, and Imaging Software Providers
- Pharmaceutical and Biotechnology Companies
- Preclinical Imaging Reagent Manufacturers and Suppliers
- Contract Research Organizations (CROs)
- Research and Development (R&D) Companies
- Government Research Laboratories
- Independent Research Laboratories
- Government and Independent Regulatory Authorities
- Medical Research Laboratories
- Academic Medical Institutes and Universities
- Market Research and Consulting Service Providers
Report Objectives
- To define, describe, and forecast the preclinical imaging market by product type, application, end user, and region
- To provide detailed information regarding the major factors influencing the market growth (such as drivers, restraints, opportunities, and challenges)
- To strategically analyze micromarkets with respect to individual growth trends, prospects, and contributions to the overall market
-
To analyze the opportunities in the market for stakeholders and provide details of
the competitive landscape for preclinical imaging market leaders - To profile the key players in the market and comprehensively analyze their market shares and core competencies
-
To forecast the size of the market segments with respect to five main regions:
North America, the Asia Pacific, Europe, Latin America, and the Middle East & Africa - To track and analyze competitive developments, such as partnerships, acquisitions, product launches & approvals, and expansions
- To benchmark players within the preclinical imaging market using the Competitive Evaluation Matrix, which analyzes market players on various parameters within the broad categories of business strategy, market share, and product offering
Get the Full Preclinical Imaging Market Report
Full forecast, segment splits, and company analysis for all Preclinical Imaging Market.
- Canada Preclinical Imaging Market
- Germany Preclinical Imaging Market
- UK Preclinical Imaging Market
- France Preclinical Imaging Market
- Italy Preclinical Imaging Market
- Spain Preclinical Imaging Market
- Japan Preclinical Imaging Market
- China Preclinical Imaging Market
- India Preclinical Imaging Market
- Brazil Preclinical Imaging Market
- Mexico Preclinical Imaging Market
Need a Tailored Report?
Customize this report to your needs
Get 10% FREE Customization
Customize This Report
