
South America Refinery and Petrochemical Filtration Market (2025-2030)

The South America Refinery and Petrochemical Filtration Market was valued at $527.4 Million in 2025 and projected to reach to $656.5 Million by 2030, representing a compound annual growth rate of 4.5%. South America's refinery and petrochemical filtration market is poised for steady expansion through 2030, supported by robust crude oil production capabilities and ongoing capital investments in refining infrastructure.


| Market Size in | USD 26.32 MN |
| Market Forecast in | |
| CAGR | |
| Forecast Period | |
| Units Considered | Value (USD MN) |
South America Refinery and Petrochemical Filtration Market Trends and Insights
- South America's energy sector, driven by significant crude oil production and refining capacity, continues to invest in advanced filtration technologies to meet environmental regulations and operational efficiency standards.
- The region's petrochemical industry, concentrated in Brazil and Venezuela, relies heavily on filtration solutions to maintain product quality and minimize downtime. Growth in South America is supported by rising demand for cleaner fuels, stricter emissions compliance, and modernization of aging refinery infrastructure across the continent.
- South America's downstream sector is increasingly adopting high-performance filtration systems to reduce maintenance costs and extend equipment lifespan.
- Between 2025 and 2030, South America will experience steady market expansion as refineries upgrade their filtration capabilities to handle heavier crude grades and complex petrochemical processes..
Key Market Statistics
- CAGR (2025-2030) 4.5% CAGR
- Market Size, 2025 ~USD 527.4 Million
- Forecast, 2030 ~USD 656.5 Million
- Geography South America
South America Refinery and Petrochemical Filtration Market Overview
Strong Regional Growth Trajectory :
South America's refinery and petrochemical filtration market is expanding at a 4.5% CAGR, driven by increasing investments in refining infrastructure and stricter environmental compliance standards across the region.
Brazil's Market Leadership :
Brazil dominates South America's filtration market with USD 318.2 million in market size, leveraging its extensive crude oil production capacity and advanced refining operations requiring continuous filtration upgrades.
Environmental Regulation Compliance :
South American refineries are increasingly adopting advanced filtration technologies to meet stringent environmental regulations, driving demand for high-performance filtration solutions across the region.
Forecast Growth to USD 656.5 Million :
The South American market is projected to reach USD 656.5 million by 2030, representing a 24.5% cumulative growth opportunity as petrochemical facilities modernize their filtration systems.
South America Refinery and Petrochemical Filtration Market Dynamics
- Brazil's dominant position as the region's largest market reflects its significant refining capacity and commitment to environmental sustainability.
- The region's growth trajectory, while moderately below the global 5.9% CAGR, reflects mature market dynamics balanced against emerging opportunities in petrochemical processing and environmental compliance. Key drivers include stricter environmental regulations, aging infrastructure requiring modernization, and increased demand for high-efficiency filtration systems.
- Argentina and other regional players are also investing in refinery upgrades, contributing to market expansion.
- Strategic partnerships between local refineries and global filtration technology providers are expected to accelerate adoption of advanced solutions, positioning South America as a significant growth market within the broader Latin American energy sector..
Market Ecosystem
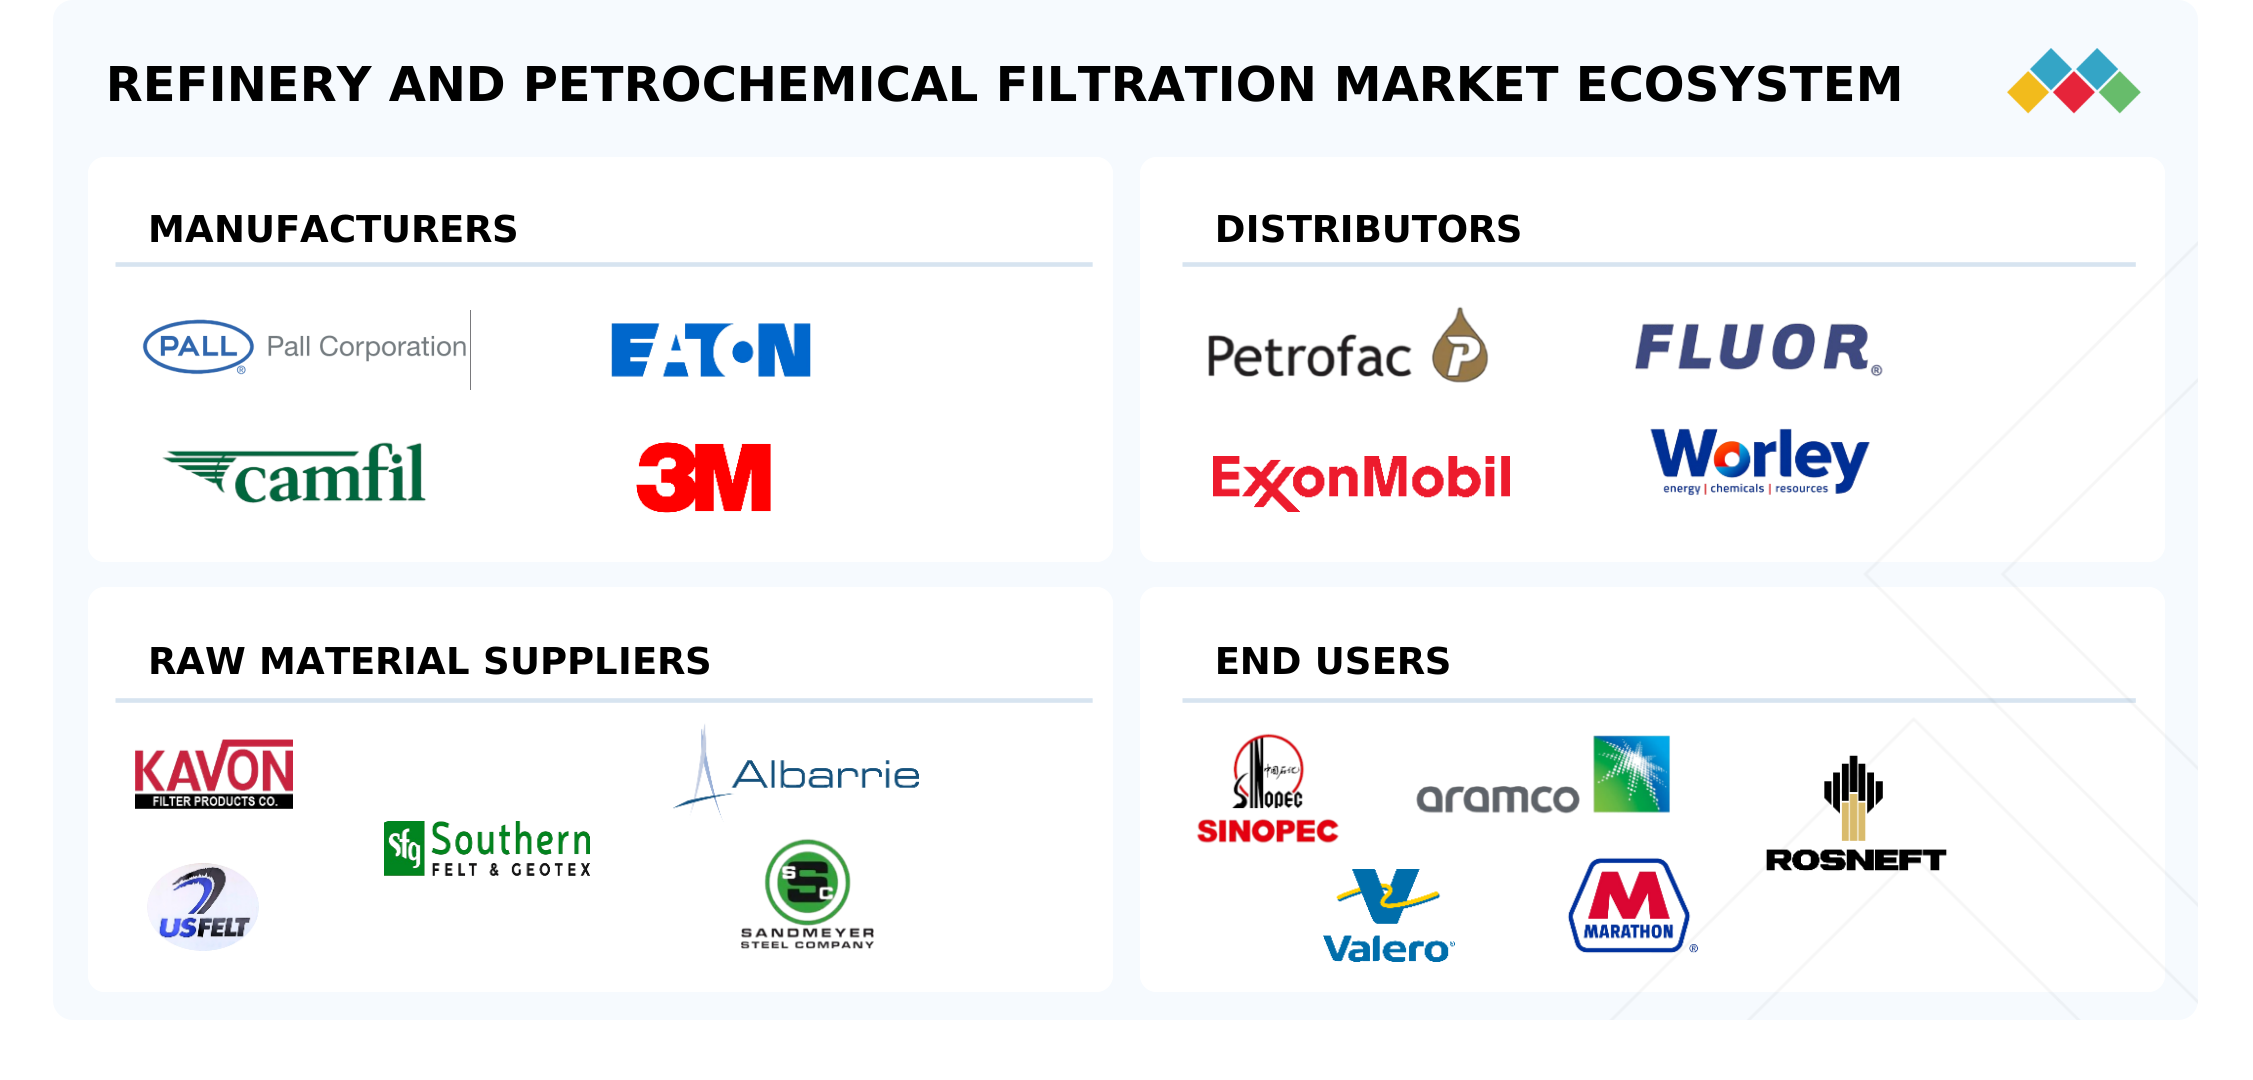
refinery and petrochemical filtration market: COMMERCIAL USE CASES ACROSS INDUSTRIES
| COMPANY | USE CASE DESCRIPTION | BENEFITS |
|---|---|---|
 |
A Texas refinery operating two coking units encountered significant issues with its hydrocracking unit’s high-temperature gas oil backwash feed filter system, especially due to increased use of opportunity crudes. The main problem was frequent unscheduled maintenance caused by persistent filter element changeouts for external cleaning, which led to safety concerns and costly maintenance. These challenges resulted in operational setbacks and high expenses, particularly after the turnaround cycle began, making filter maintenance a continuous burden. | To resolve these problems, Jonell Systems implemented a pre-filtration solution by installing a custom-engineered High-Temperature High Flow Cartridge Filter upstream of the backwash feed filter. This resulted in completely eliminating external filter element cleaning and significantly reduced filter maintenance needs. The refinery achieved savings of approximately USD 2 million per year in filter maintenance, and the reduced catalyst changeouts contributed to multi-million dollar cost reductions, ultimately exceeding USD 50 million in savings over six years. |
Logos and trademarks shown above are the property of their respective owners. Their use here is for informational and illustrative purposes only.
Related Ecosystem
Industrial Equipment
- HVAC System
- Fiberglass
- Actuators
- Cartridge Filters
- Electrostatic Precipitators
- Siemens ag
- ABB India Limited
- GRUNDFOS GROUP
- SCHNEIDER ELECTRIC SE
- Emerson Electric Co.
Key Takeaways
- South America's refinery and petrochemical filtration market will grow from USD 527.4 million in 2025 to USD 656.5 million by 2030 at a 4.5% CAGR.
- South America's major refineries are investing in advanced filtration to comply with environmental regulations and improve operational efficiency.
- South America's petrochemical sector, particularly in Brazil, drives demand for specialized filtration solutions for product quality assurance.
- South America's aging refinery infrastructure modernization initiatives will accelerate filtration technology adoption through 2030.
Refinery and Petrochemical Filtration Market Report Scope
| Report Metric | Details |
|---|---|
| Base Year | 2025 |
| Fastest Growing Segment | COALESCER FILTER (Filter Type) |
| Forecast Period | 2025-2030 |
| Growth Rate | CAGR of 5.9% from 2025 to 2030 |
| Largest Segment | REFINERIES (End User) |
| Market Size Base Year (Billions) | ~USD 5.08 (2025) |
| Revenue Forecast (Billions) | ~USD 6.76 (2030) |
| Segments Covered | Filter Type, Application, End User |
South America Refinery and Petrochemical Filtration Market Report Segmentation
3 segment dimensions are covered across the global market.
By Filter Type
- Bag Filter
- Cartridge Filter
- Coalescer Filter
- Depth Cartridge
- Electrostatic Precipitator
- Filter Press
- High Flow Cartridge
- Liquid-Gas
- Liquid-Gas Coalescer
- Liquid-Liquid
- Liquid-Liquid Coalescer
- Other Filter Types
- Pleated Cartridge
By Application
- Liquid-Gas Separation
- Liquid-Liquid Separation
- Other Applications
By End User
- Petrochemical Industry
- Refineries
Target Audience
- Refinery Operators & Managers : South American refinery operators need market intelligence to evaluate filtration technology upgrades, benchmark operational efficiency, and ensure compliance with regional environmental standards.
- Filtration Equipment Manufacturers : Global and regional filtration vendors require detailed South American market data to identify growth opportunities, assess competitive dynamics, and develop localized product strategies for Brazil and Argentina.
- Petrochemical Companies : Petrochemical producers operating in South America need insights into filtration market trends, supplier capabilities, and technology innovations to optimize production processes and reduce operational costs.
- Investment & Private Equity Firms : Investors evaluating opportunities in South American energy infrastructure require market sizing, growth forecasts, and regional dynamics to assess portfolio companies and identify acquisition targets.
- Environmental & Regulatory Consultants : Compliance specialists and environmental consultants need market data to advise refineries on filtration solutions meeting South American environmental regulations and international standards.
Countries within South America - compare and drill down
| Country | 2025 size (native) |
|---|---|
| Brazil | USD 318.2 Million |
| Argentina | USD 181.8 Million |
| Rest Of South America | USD 156.5 Million |
Country market size visualization
Reasons to Buy this Report
- Brazil Market Dominance Insights : Gain detailed intelligence on Brazil's USD 318.2 million market segment, including competitive landscape, key refineries, and investment trends driving the region's largest filtration market.
- Growth Opportunity Identification : Identify high-potential segments within South America's 4.5% CAGR expansion, with forecasts through 2030 enabling strategic market entry and expansion planning for filtration solution providers.
- Regulatory Compliance Roadmap : Understand environmental regulations and compliance requirements across South American refineries, enabling vendors to tailor filtration solutions to regional standards and capture market share.
- Competitive Positioning Strategy : Benchmark against regional competitors and identify market gaps in Argentina, Chile, and other emerging South American markets with detailed country-level market sizing data.
- Investment Decision Support : Make informed capital allocation decisions with comprehensive market forecasts, country-specific data, and growth projections supporting business development and partnership strategies in South America.
Frequently asked questions
What is the current market size of refinery and petrochemical filtration in South America?
South America's refinery and petrochemical filtration market is valued at USD 527.4 million in 2025.
What is the projected market size for South America by 2030?
South America's market is forecast to reach USD 656.5 million by 2030, representing a 4.5% CAGR.
Which countries in South America dominate the filtration market?
Brazil and Venezuela lead South America's refinery and petrochemical filtration market due to their significant crude oil production and refining capacity.
What are the primary drivers of growth in South America's filtration market?
South America's market growth is driven by stricter environmental regulations, demand for cleaner fuels, and modernization of aging refinery infrastructure.
How does South America's filtration market compare to global trends?
South America's 4.5% CAGR is slightly below the global average of 5.9%, reflecting regional economic and infrastructure development patterns.
RESEARCH METHODOLOGY
The study involved major activities in estimating the current size of the refinery and petrochemical filtration market. Exhaustive secondary research was done to collect information on the peer and parent markets. The next step was to validate these findings, assumptions, and sizing with industry experts across the value chain through primary research. Both the top-down and bottom-up approaches were employed to estimate the complete market size. Thereafter, market breakdown and data triangulation were used to estimate the market size of the segments and subsegments.
Secondary Research
This research study on the refinery and petrochemical filtration market involved the use of extensive secondary sources, directories, and databases, such as Hoovers, Bloomberg, Businessweek, Factiva, International Energy Agency, and BP Statistical Review of World Energy, to identify and collect information useful for a technical, market-oriented, and commercial study of the refinery and petrochemical filtration market. The other secondary sources included annual reports, press releases & investor presentations of companies, white papers, certified publications, articles by recognized authors, manufacturer associations, trade directories, and databases.
Primary Research
The refinery and petrochemical filtration market comprises several stakeholders, such as refinery and petrochemical filtration manufacturers, manufacturing technology providers, and technical support providers in the supply chain. The demand side of this market is characterized by the rising demand for refinery and petrochemical filtration in liquid-liquid separation, liquid-gas separation, and other applications. The supply side is characterized by rising demand for contracts from the industrial sector and mergers & acquisitions among big players. Various primary sources from both the supply and demand sides of the market were interviewed to obtain qualitative and quantitative information. Following is the breakdown of primary respondents:
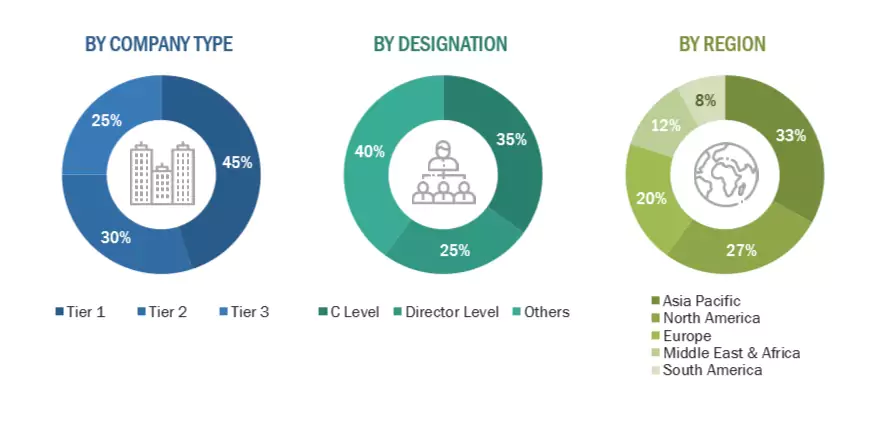
Note: “Others” include sales managers, engineers, and regional managers
The tier of the companies is defined on the basis of their total revenue as of 2024; Tier 1 = > USD 1
billion, Tier 2 = From USD 500 million to USD 1 billion, and Tier 3 = < USD 500 million.
To know about the assumptions considered for the study, download the pdf brochure
Market Size Estimation
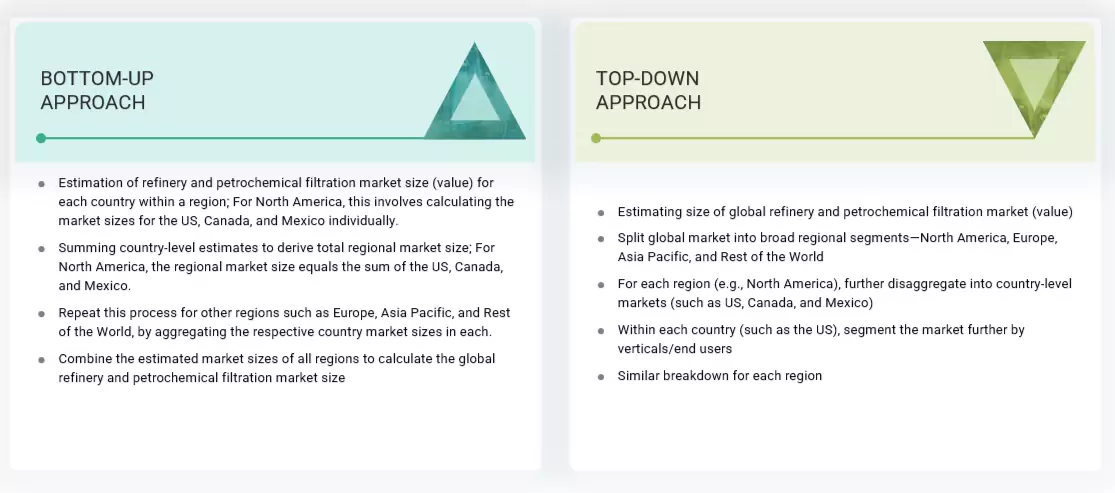
Both top-down and bottom-up approaches were used to estimate and validate the total size of the refinery and petrochemical filtration market. These methods were also used extensively to estimate the size of various subsegments in the market. The research methodology used to estimate the market size includes the following:
- The key players in the industry and market have been identified through extensive secondary research, and their market share in the respective regions has been determined through both primary and secondary research.
- The industry’s value chain and market size, in terms of value, have been determined through primary and secondary research processes.
- All percentage shares, splits, and breakdowns have been determined using secondary sources and verified through primary sources.
Refinery and Petrochemical Filtration Market : Top-Down and Bottom-Up Approach
Data Triangulation
After arriving at the overall market size from the estimation process explained above, the total market has been split into several segments and subsegments. To complete the overall market engineering process and arrive at the exact statistics for all the segments and subsegments, the data triangulation and market breakdown processes have been employed, wherever applicable. The data has been triangulated by studying various factors and trends from both the demand and supply sides. Along with this, the market has been validated using both the top-down and bottom-up approaches.
Market Definition
The refinery and petrochemical filtration refers to the specialized filtration systems used in refineries and petrochemical plants. These filtration systems remove impurities, contaminants, and particles from process streams, ensuring product quality, protecting equipment, and maintaining smooth operations. Various types of filters, such as cartridge, bag, filter press, coalescers, and electrostatic precipitators, among others, are employed for this purpose. The growth of the refinery and petrochemical filtration market can be attributed to the development of the downstream sector across major countries in North America, Europe, Asia Pacific, South America, and the Middle East & Africa.
Stakeholders
- Associations, forums, and alliances related to the refinery and petrochemical filtration market
- Consulting companies in the energy sector
- Government and research organizations
- Refinery owners
- Petrochemical plant owners
- Public and private downstream companies
- State and national regulatory authorities
- Energy management companies
- Government & research organizations
- OEMs
- Refinery and petrochemical filtration equipment manufacturers
- Support infrastructure equipment providers
- Oil and gas engineering, procurement, and construction (EPC) companies
Report Objectives
- To define, describe, and forecast the refinery and petrochemical filtration market based on filter type, end user, application, and region, in terms of value and volume
- To describe and forecast the refinery and petrochemical filtration market for various segments with respect to five main regions: North America, Europe, Asia Pacific, South America, and the Middle East & Africa, in terms of value
- To provide detailed information regarding the drivers, restraints, opportunities, and challenges influencing the growth of the market
- To provide a detailed overview of the refinery and petrochemical filtration value chain, along with industry trends, use cases, security standards, and Porter’s five forces analysis
- To strategically analyze micromarkets with respect to individual growth trends, prospects, and contributions to the total market
- To analyze opportunities in the market for various stakeholders by identifying high-growth segments in the refinery and petrochemical filtration market
- To strategically profile key players and comprehensively analyze their market position in terms of ranking and core competencies, along with detailing the competitive landscape of the market.
- To analyze growth strategies adopted by market players, such as partnerships, mergers & acquisitions, agreements, and product launches, in the refinery and petrochemical filtration market.
Available Customizations
With the given market data, MarketsandMarkets offers customizations according to the specific requirements of companies. The following customization options are available for the report:
Product Analysis
- Product Matrix, which provides a detailed comparison of the product portfolio of each company
Company Information
- Detailed analyses and profiling of additional market players
Get the Full Refinery and Petrochemical Filtration Market Report
Full forecast, segment splits, and company analysis for all Refinery and Petrochemical Filtration Market.
- Rest Of Europe Refinery and Petrochemical Filtration Market
- Rest Of Asia Pacific Refinery and Petrochemical Filtration Market
- Rest Of South America Refinery and Petrochemical Filtration Market
- China Refinery and Petrochemical Filtration Market
- India Refinery and Petrochemical Filtration Market
- Japan Refinery and Petrochemical Filtration Market
- Australia Refinery and Petrochemical Filtration Market
- South Korea Refinery and Petrochemical Filtration Market
- Canada Refinery and Petrochemical Filtration Market
- Mexico Refinery and Petrochemical Filtration Market
- US Refinery and Petrochemical Filtration Market
- Russia Refinery and Petrochemical Filtration Market
- Germany Refinery and Petrochemical Filtration Market
- UK Refinery and Petrochemical Filtration Market
- France Refinery and Petrochemical Filtration Market
- Italy Refinery and Petrochemical Filtration Market
- Saudi Arabia Refinery and Petrochemical Filtration Market
- UAE Refinery and Petrochemical Filtration Market
- South Africa Refinery and Petrochemical Filtration Market
- Brazil Refinery and Petrochemical Filtration Market
- Argentina Refinery and Petrochemical Filtration Market
Need a Tailored Report?
Customize this report to your needs
Get 10% FREE Customization
Customize This Report
