
Asia Pacific IoT Sensors Market (2024-2029)

The Asia Pacific IoT Sensors Market was valued at $5790.2 Million in 2024 and projected to reach to $30651.6 Million by 2029, representing a compound annual growth rate of CAGR 39.6%. Asia Pacific stands as the fastest-growing region for IoT sensors globally, driven by unprecedented industrialization, smart city investments, and 5G infrastructure rollout.


| Market Size in | USD 26.32 MN |
| Market Forecast in | |
| CAGR | |
| Forecast Period | |
| Units Considered | Value (USD MN) |
Asia Pacific IoT Sensors Market Trends and Insights
- The region's explosive growth trajectory, driven by rapid industrialization, smart city initiatives, and widespread 5G deployment, positions Asia Pacific as a critical growth engine for IoT sensor adoption.
- Asia Pacific's 39.6% compound annual growth rate substantially outpaces the global average, reflecting strong demand from manufacturing, healthcare, and consumer electronics sectors across China, India, Japan, and Southeast Asia. Asia Pacific's dominance in semiconductor manufacturing and electronics production creates a natural ecosystem for IoT sensor innovation and deployment.
- The region's investment in Industry 4.0 technologies, coupled with government support for digital transformation, accelerates sensor integration across industrial and consumer applications.
- By 2029, Asia Pacific is expected to capture an increasingly larger proportion of worldwide IoT sensor revenue, driven by cost-competitive production, expanding middle-class consumer bases, and aggressive technology adoption in emerging markets..
Key Market Statistics
- CAGR (2024-2029) CAGR 39.6%
- Market Size, 2024 ~USD 5790.2 Million
- Forecast, 2029 ~USD 30651.6 Million
- Geography Asia Pacific
Asia Pacific IoT Sensors Market Overview
Explosive Growth Trajectory :
Asia Pacific's IoT Sensors Market is experiencing a remarkable 39.6% CAGR, significantly outpacing the global average of 34.4%, driven by rapid industrialization and digital transformation across the region.
China Dominates Regional Market :
China leads Asia Pacific with $11,034.57 million in market size, followed by Japan ($7,226.3 million) and South Korea ($4,147.53 million), establishing the region as the world's IoT sensor powerhouse.
Smart City & 5G Catalysts :
Widespread 5G deployment and government-backed smart city initiatives across Asia Pacific are accelerating IoT sensor adoption in urban infrastructure, manufacturing, and connected devices ecosystems.
Forecast Expansion to $30.6 Billion :
The Asia Pacific IoT Sensors Market is projected to grow from $5,790.2 million in 2024 to $30,651.6 million by 2029, representing a 429% increase and cementing the region's critical role in global IoT growth.
Asia Pacific IoT Sensors Market Dynamics
- Countries like China, Japan, and South Korea are spearheading innovation in sensor technology, while emerging markets in India and Southeast Asia present substantial untapped opportunities.
- The region's manufacturing prowess and digital ecosystem create ideal conditions for IoT sensor proliferation across industrial automation, smart buildings, and consumer applications. The forecast period through 2029 will witness accelerated adoption as governments prioritize digital transformation and Industry 4.0 initiatives.
- Rising investments in IoT infrastructure, coupled with decreasing sensor costs and increasing connectivity, will drive market expansion.
- Asia Pacific's dominance in electronics manufacturing and semiconductor production further strengthens its position as the global IoT sensors hub, attracting major technology investments and fostering competitive innovation..
Market Ecosystem
Related Ecosystem
Sensors And Control
- Sensors
- Temperature Sensors
- Image Sensors
- Pressure Sensors
- Flow Sensors
- BAUMER ELECTRIC AG
- HONEYWELL INTERNATIONAL INC.
- Stmicroelectronics
- Lenovo
- Texas Instruments Incorporated
Smart Home
- Sensors
- Pressure Sensors
- Temperature Sensors
- Actuators
- Face Recognition
- HONEYWELL INTERNATIONAL INC.
- SCHNEIDER ELECTRIC SE
- Siemens ag
- Samsung
- Godrej Industries Limited
Aviation
- Narrow Body Aircraft
- Wide Body Aircraft
- Military Helicopters
- Special Mission Aircraft
- Fighter Aircraft
- HONEYWELL INTERNATIONAL INC.
- COLLINS AEROSPACE
- Thales group
- Safran group
- HEICO Corporation
Key Takeaways
- Asia Pacific IoT Sensors Market will grow from $5,790.2M (2024) to $30,651.6M (2029) at a 39.6% CAGR, significantly outpacing global growth.
- Asia Pacific's manufacturing dominance and 5G infrastructure investments position the region as the fastest-growing IoT sensor market globally.
- Industrial IoT, smart cities, and consumer electronics drive Asia Pacific sensor demand across China, India, Japan, and Southeast Asian economies.
- Asia Pacific's cost-competitive production ecosystem and government digital transformation initiatives accelerate IoT sensor adoption through 2029.
IoT Sensors Market Report Scope
| Report Metric | Details |
|---|---|
| Base Year | 2024 |
| Fastest Growing Segment | CONSUMER IOT (Vertical) |
| Forecast Period | 2024-2029 |
| Growth Rate | CAGR of 34.4% from 2024 to 2029 |
| Largest Segment | WIRELESS (Network Technology) |
| Market Size Base Year (Billions) | ~USD 15.99 (2024) |
| Revenue Forecast (Billions) | ~USD 70.1 (2029) |
| Segments Covered | Sensor Type, Vertical, Network Technology, Type, End Use Applications, Retail Applications, Healthcare Applications, Smart Agriculture Applications |
Asia Pacific IoT Sensors Market Report Segmentation
8 segment dimensions are covered across the global market.
By Sensor Type
- Accelerometers
- Acoustic Sensors
- Co2 Sensors
- Flow Sensors
- Gyroscopes
- Humidity Sensors
- Image Sensors
- Inertial Sensors
- Magnetometers
- Motion Sensors
- Occupancy Sensors
- Other Sensor Types
- Other Sensors
- Pressure Sensors
- Proximity Sensors
- Temperature Sensors
- Touch Sensors
By Vertical
- Commercial IoT
- Consumer IoT
- Industrial IoT
By Network Technology
- Wired
- Wireless
By Type
- 6Lowpan
- Bluetooth
- Dali
- Dect-Ule
- Enocean
- Ethernet
- Knx
- Lonworks
- Modbus
- Nfc
- Profibus
- Rfid
- Thread
- Whart
- Wi-Fi
- Z-Wave
- Zigbee
By End Use Applications
- Aerospace & Defense
- Corporate Offices
- Energy
- Entertainment
- Financial Institutes
- Healthcare
- Industrial Automation
- Logistics, Supply Chain, And Transportation
- Retail
- Smart Agriculture
- Smart Cities
By Retail Applications
- Advertising And Marketing
- Digital Signage
- Digital Signages
- Energy Optimization
- Intelligent Payment Solutions
- Real-Time/ Streaming Analytics
- Resource Management
- Safety & Security
- Smart Shelves And Smart Doors
- Smart Vending Machines
By Healthcare Applications
- Clinical Operations And Workflow Management
- Connected Imaging
- Inpatient Monitoring
- Medication Management
- Other Healthcare Applications
- Telemedicine
By Smart Agriculture Applications
- Fish Farming
- Livestock Monitoring
- Other Smart Agriculture Applications
- Precision Farming
- Smart Greenhouses
Target Audience
- IoT Sensor Manufacturers : Understand Asia Pacific's explosive demand growth, competitive dynamics, and country-specific opportunities to optimize production capacity, R&D investments, and go-to-market strategies.
- Technology & Semiconductor Companies : Identify high-growth markets within Asia Pacific for sensor chips, connectivity solutions, and edge computing platforms driven by 5G and smart city deployments.
- System Integrators & Solution Providers : Access market intelligence on IoT sensor adoption trends across industrial automation, smart buildings, and infrastructure to develop region-specific solutions and service offerings.
- Investment & Private Equity Firms : Evaluate Asia Pacific IoT sensor market potential with detailed growth forecasts, regional dynamics, and country-level performance data for M&A and investment decisions.
- Government & Policy Makers : Leverage market data to inform digital transformation policies, 5G infrastructure investments, and smart city initiatives aligned with Asia Pacific's IoT sensor market trajectory.
Countries within Asia Pacific - compare and drill down
| Country | 2025 size (native) |
|---|---|
| China | USD 11034.57 Million |
| Japan | USD 7226.3 Million |
| South Korea | USD 4147.53 Million |
| India | USD 3831.45 Million |
| Australia | USD 1754.34 Million |
| Rest Of Asia Pacific | USD 2657.4 Million |
Country market size visualization
Reasons to Buy this Report
- Regional Market Leadership Insights : Gain comprehensive understanding of Asia Pacific's 39.6% CAGR growth dynamics, outpacing global trends by 5.2 percentage points, with detailed analysis of regional drivers and competitive positioning.
- Country-Level Market Intelligence : Access granular market data across China ($11.03B), Japan ($7.23B), India ($3.83B), and South Korea ($4.15B) to identify high-potential markets and localized growth opportunities.
- 5G & Smart City Opportunity Mapping : Understand how 5G deployment and smart city initiatives across Asia Pacific are creating unprecedented demand for IoT sensors, with forecasts through 2029 for strategic planning.
- Competitive Landscape & Market Gaps : Identify emerging players, technology gaps, and white-space opportunities in Asia Pacific's rapidly evolving IoT sensor ecosystem across industrial, consumer, and infrastructure segments.
- Investment & Expansion Strategy : Leverage detailed market forecasts ($30.65B by 2029) and regional growth patterns to inform market entry strategies, partnership decisions, and capital allocation in Asia Pacific.
Frequently asked questions
What is the projected size of the Asia Pacific IoT Sensors Market by 2029?
Asia Pacific's IoT Sensors Market is forecast to reach $30,651.6 million by 2029, up from $5,790.2 million in 2024, representing a 39.6% CAGR.
Why is Asia Pacific experiencing faster IoT sensor growth than the global average?
Asia Pacific's rapid industrialization, 5G deployment, smart city initiatives, and strong semiconductor manufacturing base drive sensor adoption faster than the global 34.4% CAGR.
Which countries in Asia Pacific are leading IoT sensor market growth?
China, India, Japan, and Southeast Asian nations are primary growth drivers in Asia Pacific, fueled by manufacturing expansion, digital transformation, and consumer electronics demand.
What sectors are driving IoT sensor demand in Asia Pacific?
Industrial IoT, smart city infrastructure, healthcare applications, and consumer electronics are the primary sectors accelerating sensor adoption across Asia Pacific through 2029.
How does Asia Pacific's IoT sensor market compare to other global regions?
Asia Pacific's 39.6% CAGR significantly exceeds the global average of 34.4%, making it the fastest-growing region for IoT sensors and a critical market for industry players.
RESEARCH METHODOLOGY
The study involved four major activities in estimating the size of the IoT sensors market. Exhaustive secondary research has been done to collect information on the market, peer market, and parent market. Validation of these findings, assumptions, and sizing with industry experts across the value chain through primary research has been the next step. Both top-down and bottom-up approaches have been employed to estimate the global market size. After that, market breakdown and data triangulation have been used to estimate the market sizes of segments and subsegments.
Secondary Research
Secondary sources that were referred to for this research study include corporate filings (such as annual reports, investor presentations, and financial statements); trade, business, and professional associations; white papers; certified publications; articles from recognized authors; directories; and databases. Secondary data was collected and analyzed to arrive at the overall market size, further validated by primary research.
Primary Research
Extensive primary research was conducted after understanding and analyzing the IoT sensors market size scenario through the secondary research process. Several primary interviews were conducted with key opinion leaders from both the demand- and supply-side vendors across four major regions—North America, Asia Pacific, Europe, and RoW (including the Middle East & Africa and South America).
After interacting with industry experts, brief sessions were conducted with highly experienced independent consultants to reinforce the findings from our primary. This, along with the in-house subject matter experts’ opinions, has led us to the findings as described in the remainder of this report.
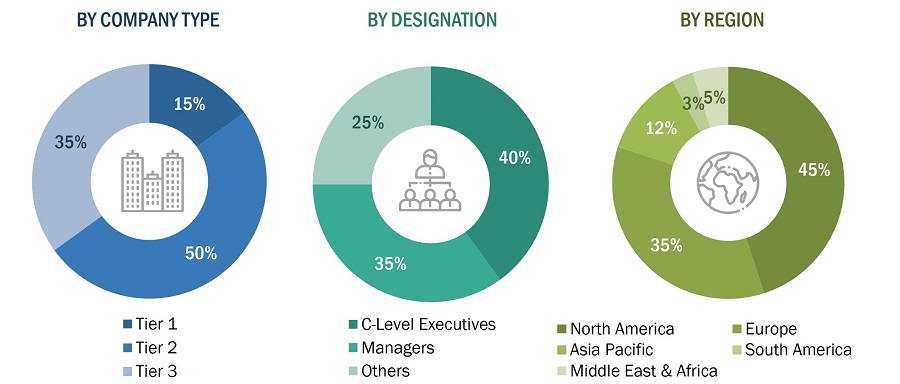
To know about the assumptions considered for the study, download the pdf brochure
IoT Sensors Market Size Estimation
In the complete market engineering process, both top-down and bottom-up approaches have been used, along with several data triangulation methods to perform market estimation and forecasting for the overall market segments and subsegments listed in this report. Extensive qualitative and quantitative analyses have been performed on the complete market engineering process to list key information/insights. The research methodology used to estimate the market size includes the following:
- Key players in major applications and markets have been identified through extensive secondary research.
- The industry’s supply chain and market size, in terms of value, have been determined through primary and secondary research processes.
- All percentage shares, splits, and breakdowns have been determined using secondary sources and verified through primary sources.
After arriving at the overall market size from the market size estimation process explained above, the total market has been split into several segments and subsegments. To complete the overall market engineering process and arrive at the exact statistics for all segments and subsegments, the market breakdown and data triangulation procedures have been employed, wherever applicable. The data has been triangulated by studying various factors and trends from both demand-and supply-side. Along with this, the market has been validated using both top-down and bottom-up approaches.
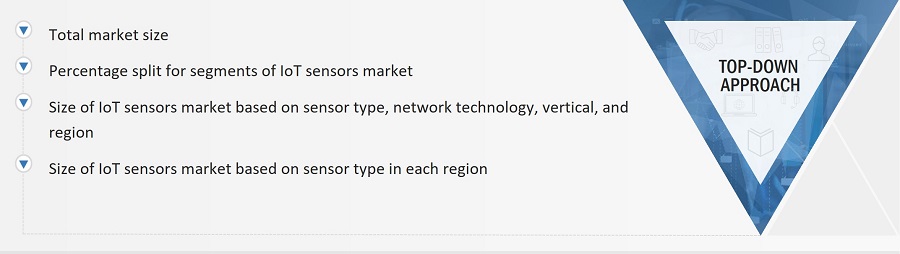
IoT sensors Market Top-down Approach
Data Triangulation
After arriving at the overall market size through the process explained earlier, the total market was split into several segments. The market breakdown and data triangulation procedures were employed, wherever applicable, to complete the overall market engineering process and arrive at the exact statistics for all the segments and subsegments. The data was triangulated by studying various factors and trends from both the demand and supply sides. The market was validated using both the top-down and bottom-up approaches.
Market Definition
IoT sensors refer to sensors used in smart applications, which require uninterrupted connectivity to carry out real-time data analytics. They require common connecting platforms for collecting and analyzing data. IoT sensors are based on the computing concept that considers every physical object to be connected to the Internet to communicate with each other. Sensors are the most important component in the IoT ecosystem. They gather required data from their surroundings and communicate it to the concerned operators. Image, temperature, pressure, ultrasonic, light, and position sensors, accelerometers, and gyroscopes are the key sensors in the IoT ecosystem.
Key Stakeholders
- Semiconductor Companies
- Embedded System Companies
- Consumer Electronics Manufacturers
- Sensor Manufacturers
- Technology Providers
- Original Equipment Manufacturers (OEMs)
- Universities and Research Organizations
- Internet Identity Management, Privacy, and Security Companies
- Machine-to-Machine (M2M), IoT, and Telecommunication Companies
- Government Bodies
Report Objectives
- To describe and forecast the size of the Internet of Things (IoT) sensors market in terms of value, based sensor type, network technology, vertical, and region
- To forecast the market size, in terms of value, for various segments in four key regions, namely, North America, Europe, Asia Pacific (APAC), and the Rest of the World (RoW)
- To forecast the size of the IoT sensors market size in terms of volume
- To provide detailed information regarding the key factors such as drivers, restraints, opportunities, and challenges influencing the growth of the IoT sensors market
- To analyze micromarkets1 with respect to individual growth trends, prospects, and contribution to the total market
-
To analyze the opportunities in the market for various stakeholders by identifying the
high-growth segments of the IoT sensors market size - To profile the key players and comprehensively analyze their market ranking and core competencies2, along with a detailed competitive landscape for the market leaders.
- To map the competitive intelligence based on the company profiles, key player strategies, and game-changing developments, such as product launches and developments, partnerships, collaborations, and acquisitions undertaken in the market.
Available customizations:
MarketsandMarkets offers the following customizations for this market report:
- Further breakdown of the market in different regions to the country-level
- Detailed analysis and profiling of additional market players (up to 5)
Get the Full IoT Sensors Market Report
Full forecast, segment splits, and company analysis for all IoT Sensors Market.
- US IoT Sensors Market
- France IoT Sensors Market
- Germany IoT Sensors Market
- Italy IoT Sensors Market
- Rest Of Europe IoT Sensors Market
- Spain IoT Sensors Market
- UK IoT Sensors Market
- Australia IoT Sensors Market
- China IoT Sensors Market
- India IoT Sensors Market
- Japan IoT Sensors Market
- Rest Of Asia Pacific IoT Sensors Market
- South Korea IoT Sensors Market
- Canada IoT Sensors Market
- Mexico IoT Sensors Market
Need a Tailored Report?
Customize this report to your needs
Get 10% FREE Customization
Customize This Report
