
Europe Virtual Production Market (2025-2030)

The Europe Virtual Production Market was valued at $485.5 Million in 2025 and projected to reach to $1751.6 Million by 2030, representing a compound annual growth rate of 29.3%. Europe's virtual production market is poised for significant expansion, growing from $485.5 million in 2025 to $1,751.6 million by 2030.


| Market Size in | USD 26.32 MN |
| Market Forecast in | |
| CAGR | |
| Forecast Period | |
| Units Considered | Value (USD MN) |
Europe Virtual Production Market Trends and Insights
- This represents a compound annual growth rate of 29.3%, driven by increasing adoption of real-time rendering technologies and LED volume stage solutions across Europe's film, television, and gaming sectors.
- Europe is positioning itself as a critical hub for virtual production innovation, with major production facilities and technology investments concentrated across the United Kingdom, Germany, and Scandinavia. The growth trajectory in Europe reflects strong demand from content creators seeking cost-efficient and sustainable production alternatives.
- Europe's virtual production market benefits from established infrastructure, skilled workforce availability, and regulatory support for digital media innovation.
- Between 2025 and 2030, Europe is expected to capture significant market share as broadcasters and studios increasingly integrate virtual production into their workflows, reducing on-location shooting requirements and accelerating post-production timelines..
Key Market Statistics
- CAGR (2025-2030) 29.3% CAGR
- Market Size, 2025 ~USD 485.5 Million
- Forecast, 2030 ~USD 1751.6 Million
- Geography Europe
Europe Virtual Production Market Overview
Strong CAGR Growth :
Europe's virtual production market is expanding at 29.3% CAGR from 2025 to 2030, demonstrating robust investment in real-time rendering and LED volume stage technologies across the region.
LED Volume Stage Adoption :
European film and television studios are rapidly adopting LED volume stage solutions, reducing production costs and timelines while enabling creative flexibility for content creators.
Gaming & Entertainment Hub :
Europe's thriving gaming and entertainment sectors are driving demand for virtual production tools, positioning the region as a critical innovation center for immersive content creation.
Real-Time Rendering Revolution :
Increasing adoption of real-time rendering technologies across European production facilities is transforming workflows and enabling faster iteration cycles for premium content.
Europe Virtual Production Market Dynamics
- This growth trajectory reflects the region's strong commitment to adopting cutting-edge production technologies and the increasing demand for cost-efficient, high-quality content creation solutions.
- Major European studios and production companies are investing heavily in LED volume stages and real-time rendering infrastructure to remain competitive in the global entertainment landscape. The region's established film, television, and gaming industries provide a robust foundation for virtual production adoption.
- With supportive regulatory environments, skilled technical workforces, and substantial production budgets, European markets are accelerating the transition toward virtual production methodologies.
- This shift is expected to drive innovation, reduce production timelines, and create new opportunities for content creators across the continent..
Market Ecosystem
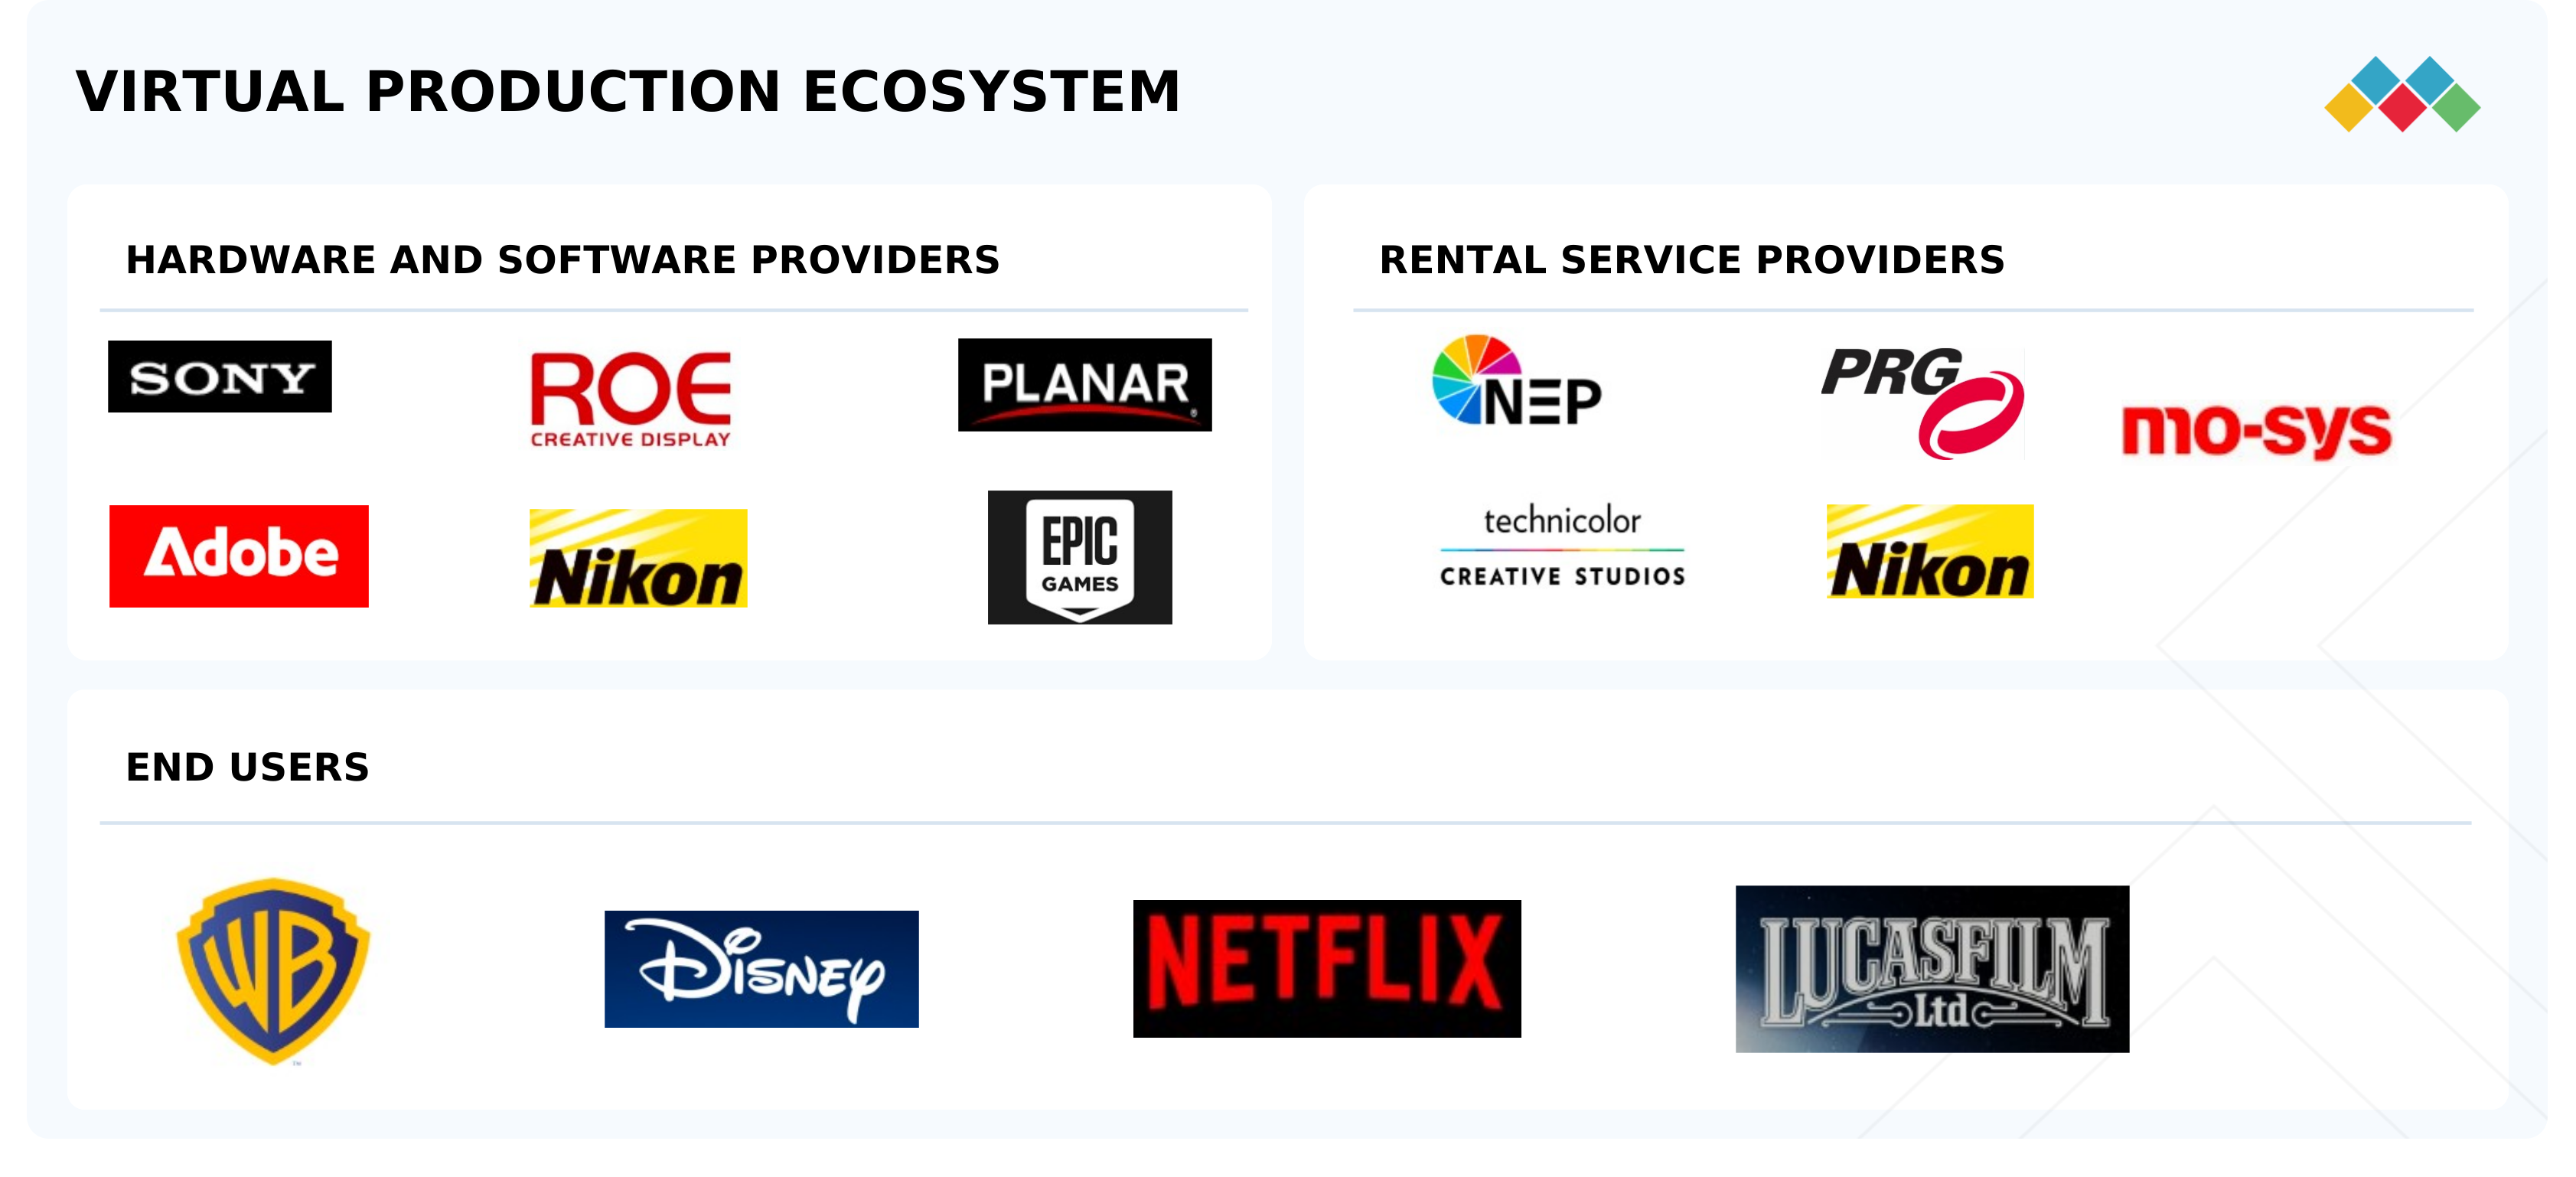
Virtual Production Market Growth: COMMERCIAL USE CASES ACROSS INDUSTRIES
| COMPANY | USE CASE DESCRIPTION | BENEFITS |
|---|---|---|
 |
Uses large-scale LED volumes and in-camera VFX for blockbuster franchises such as The Mandalorian and Marvel films | Reduces reliance on on-location shoots | Accelerates post-production | Improves creative control with immersive environments |
 |
Employs cloud-based virtual production workflows and LED stages for original series and films | Enables remote collaboration | Shortens production timelines | Ensures consistent quality | Lowers global filming costs |
 |
Integrates virtual production hardware and rental LED stages for Prime Video originals | Enhances storytelling flexibility | Scales productions efficiently | Reduces the carbon footprint of international shoots |
 |
Deploys VP software and LED wall rentals in hybrid productions across films and advertising | Improves cost efficiency | Supports creative experimentation | Enables faster turnaround of high-quality content |
 |
Uses VP solutions for television series and live broadcasting | educes set-building costs | Enhances broadcast visuals | Supports more sustainable production workflows |
Logos and trademarks shown above are the property of their respective owners. Their use here is for informational and illustrative purposes only.
Related Ecosystem
Display Technology
- Augmented Reality
- Liquid Crystal Display (LCD)
- Sensors
- Virtual Reality Devices
- Liquid Crystal on Silicon (LCOS)
- VIVITEK CORPORATION
- Samsung
- Lenovo
- Panasonic Holdings Corporation
- Lg corp
Key Takeaways
- Europe's virtual production market will grow from $485.5M (2025) to $1,751.6M (2030) at a 29.3% CAGR.
- Europe leads in LED volume stage adoption and real-time rendering technology integration across content production.
- UK, Germany, and Scandinavia are primary growth drivers with established production infrastructure and innovation hubs.
- European broadcasters and studios are prioritizing virtual production to reduce costs and environmental impact by 2030.
Virtual Production Market Report Scope
| Report Metric | Details |
|---|---|
| Base Year | 2025 |
| Fastest Growing Segment | PRE-PRODUCTION (Type) |
| Forecast Period | 2025-2030 |
| Growth Rate | CAGR of 33.1% from 2025 to 2030 |
| Largest Segment | MOVIES (End User) |
| Market Size Base Year (Billions) | ~USD 2.1 (2025) |
| Revenue Forecast (Billions) | ~USD 8.76 (2030) |
| Segments Covered | Offering, Type, End User |
Europe Virtual Production Market Report Segmentation
3 segment dimensions are covered across the global market.
By Offering
- Hardware
- Rental Services
- Software
By Type
- Post-Production
- Pre-Production
- Production
By End User
- Commercial Advertisements
- Movies
- Online Videos
- Other End Users
- Television Series
EUROPE: VIRTUAL PRODUCTION MARKET, BY END USER, 2025–2030
| Segment | 2025 | 2026 | 2027 | 2028 | 2029 | 2030 | CAGR (%) |
|---|---|---|---|---|---|---|---|
| COMMERCIAL ADVERTISEMENTS | 54.1 | 70.3 | 90.2 | 114.3 | 143.1 | 177.3 | 26.8 |
| MOVIES | 241.4 | 320.5 | 420.3 | 544.5 | 697.2 | 882.7 | 29.6 |
| ONLINE VIDEOS | 21.7 | 26.8 | 32.8 | 39.6 | 47.2 | 55.6 | 20.7 |
| OTHER END USERS | 43.6 | 56.6 | 72.2 | 90.7 | 111.9 | 135.9 | 25.6 |
| TELEVISION SERIES | 124.7 | 168.7 | 225.3 | 297.3 | 387.8 | 500.1 | 32 |
| TOTAL | 485.5 | 643 | 840.8 | 1086.3 | 1387.2 | 1751.6 | 29.3 |
REST OF EUROPE: VIRTUAL PRODUCTION MARKET, BY END USER, 2025–2030
| Segment | 2025 | 2026 | 2027 | 2028 | 2029 | 2030 | CAGR (%) |
|---|---|---|---|---|---|---|---|
| COMMERCIAL ADVERTISEMENTS | 8.3 | 10.5 | 13.1 | 16.1 | 19.4 | 23.1 | 22.6 |
| MOVIES | 36.4 | 46.6 | 58.7 | 72.9 | 89 | 107.2 | 24.1 |
| ONLINE VIDEOS | 2.9 | 3.5 | 4.1 | 4.8 | 5.6 | 6.3 | 17 |
| OTHER END USERS | 5.3 | 6.5 | 7.9 | 9.5 | 11 | 12.6 | 19 |
| TELEVISION SERIES | 19.3 | 25 | 32 | 40.3 | 49.9 | 61 | 25.9 |
| TOTAL | 72.2 | 92.2 | 115.9 | 143.5 | 175 | 210.2 | 23.8 |
Target Audience
- Production Equipment Manufacturers : Manufacturers of LED stages, rendering engines, and virtual production hardware need Europe-specific market data to identify growth opportunities and tailor product offerings to regional demands.
- Film & Television Studios : European production companies require market intelligence to benchmark their virtual production investments, understand competitive positioning, and plan technology adoption roadmaps.
- Software & Technology Providers : Real-time rendering and virtual production software vendors need regional market insights to prioritize European expansion, localize solutions, and capture growing demand.
- Investment & Private Equity Firms : Investors evaluating opportunities in European entertainment technology and semiconductor sectors need detailed market forecasts and growth metrics to assess portfolio companies and acquisition targets.
- Gaming & Interactive Media Companies : European gaming studios and interactive media producers need market data to justify virtual production investments and understand technology adoption trends within their regional ecosystem.
Countries within Europe - compare and drill down
| Country | 2025 size (native) |
|---|---|
| UK | USD 770.7 Million |
| Germany | USD 490.4 Million |
| France | USD 280.3 Million |
| Rest Of Europe | USD 210.2 Million |
Country market size visualization
Reasons to Buy this Report
- Regional Market Sizing : Obtain precise market valuations for Europe's virtual production sector with country-level breakdowns including UK, Germany, and France, enabling targeted investment and expansion strategies.
- Growth Trajectory Analysis : Understand Europe's 29.3% CAGR performance relative to the global 33.1% rate, identifying regional opportunities and competitive positioning within the semiconductor and electronics industry.
- Technology Adoption Insights : Gain detailed intelligence on LED volume stage and real-time rendering adoption patterns across European film, television, and gaming sectors to inform product development and go-to-market strategies.
- Competitive Landscape : Access comprehensive data on European market leaders, emerging players, and technology trends to benchmark performance and identify partnership or acquisition opportunities.
- Forecast-Driven Planning : Leverage 2030 market projections ($1,751.6M) to develop long-term business strategies, resource allocation plans, and investment decisions with confidence in regional growth dynamics.
Frequently asked questions
What is the current size of Europe's virtual production market in 2025?
Europe's virtual production market is valued at $485.5 million in 2025, representing a significant segment within the broader Semiconductor & Electronics industry.
What is the projected market size for Europe's virtual production sector by 2030?
Europe's virtual production market is forecast to reach $1,751.6 million by 2030, reflecting a 29.3% compound annual growth rate over the five-year period.
Which European countries are leading the virtual production market growth?
The United Kingdom, Germany, and Scandinavian countries are primary drivers of Europe's virtual production market, supported by established production infrastructure and technology innovation centers.
What technologies are driving Europe's virtual production market expansion?
Real-time rendering technologies, LED volume stages, and advanced camera tracking systems are the primary technologies accelerating adoption across Europe's content production sector.
Why is Europe's virtual production market growing faster than traditional production methods?
Europe's virtual production adoption is accelerating due to cost efficiency, reduced environmental impact, faster post-production timelines, and increasing demand from broadcasters and studios for sustainable production alternatives.
RESEARCH METHODOLOGY
The research study involved four main activities in estimating the size of the virtual production market. Extensive secondary research was conducted to gather important information about the market and related markets. The validation of these findings, assumptions, and sizing was then carried out through primary research with industry experts across the entire value chain. Both top-down and bottom-up approaches were used to estimate the market size. The market segmentation and data triangulation were employed to determine the market sizes of different segments sub-segments.
Secondary Research
In the secondary research process, various secondary sources were used to identify and gather information for this study. These sources include annual reports, press releases, investor presentations, white papers, and articles by reputable authors. The secondary research mainly aimed to gather key information about the market’s value chain, leading market players, market segmentation based on industry trends, regional outlooks, and developments in both market and technology perspectives.
In the virtual production market report, the global market size has been estimated using both top-down and bottom-up approaches, along with several other related submarkets. The major players in the market were identified through extensive secondary research, and their presence was confirmed using both secondary and primary research. All percentage shares, splits, and breakdowns have been determined from secondary sources and verified through primary sources.
Primary Research
Extensive primary research has been conducted after gaining an understanding of the virtual production market scenario through secondary research. Several primary interviews have been carried out with key opinion leaders from demand- and supply-side vendors across four major regions—Americas, Europe, Asia Pacific, and the Rest of the World. About 25% of the primary interviews have involved demand-side vendors, while 75% have involved supply-side vendors. Most primary data collection has been done through telephonic interviews, accounting for 80% of all primary interviews; questionnaires and emails have also been used to gather information data.
After successful interactions with industry experts, brief sessions were held with highly experienced independent consultants to reinforce the findings of our primary research. This, along with the opinions of in-house subject matter experts, has led us to the findings described in the report.
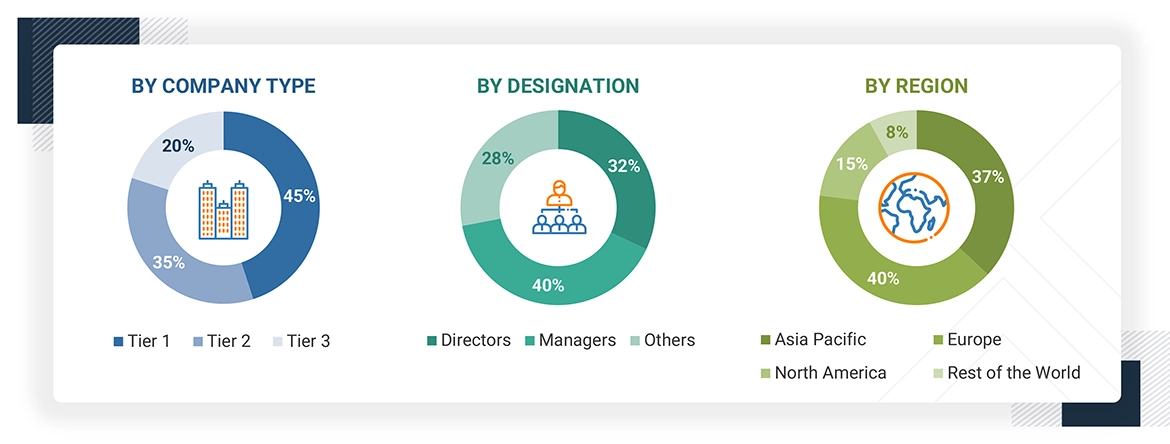
Note: Others include sales, marketing, and product managers
To know about the assumptions considered for the study, download the pdf brochure
Market Size Estimation
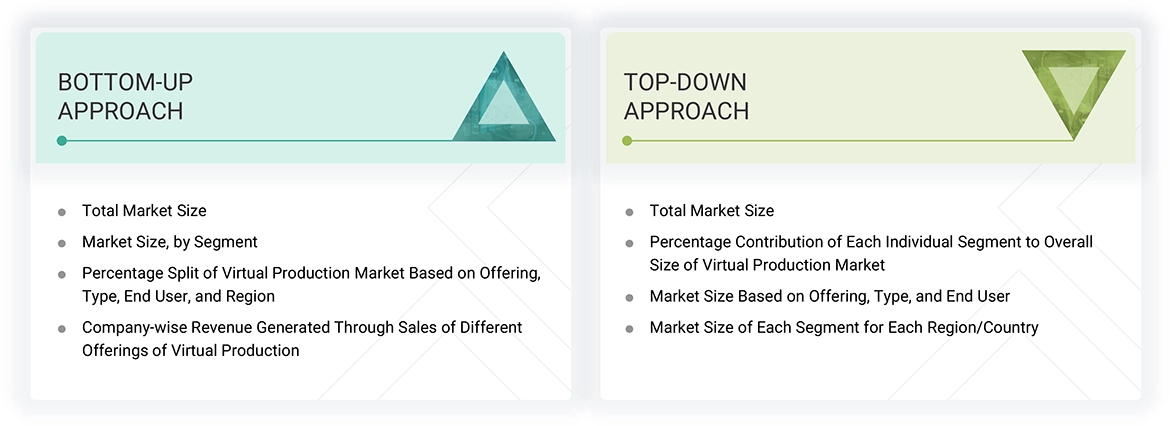
In the market engineering process, both top-down and bottom-up approaches, along with data triangulation methods, are used to estimate and validate the size of the virtual production market and other related areas submarkets. The research methodology used to estimate the market sizes includes the following:
- Identifying top-line investments and spending in the ecosystem and considering segment-level splits and significant market developments
- Identifying different stakeholders in the virtual production market that influence the entire market, along with participants across the supply chain
- Analyzing major manufacturers and rental service providers in the virtual production market and studying their product portfolio
- Analyzing trends related to the adoption of virtual production products
- Monitoring recent and upcoming market developments, including investments, R&D activities, product launches, expansions, acquisitions, partnerships, collaborations, agreements, and investments, as well as projecting the market size based on these developments and other critical factors
- Carrying out multiple discussions with key opinion leaders to identify the adoption trends of virtual production
- Segmenting the overall market into various other market segments
- Validating the estimates at every level through discussions with key opinion leaders, such as chief executives (CXOs), directors, and operations managers, and finally with the domain experts at MarketsandMarkets
Virtual Production Market : Top-Down and Bottom-Up Approach
Data Triangulation
After determining the overall market size using the estimation process described in the previous section, the virtual production market has been divided into multiple segments and subsegments. To complete the whole market analysis and obtain precise statistics for all segments, data triangulation and market breakdown methods have been applied where suitable. The data has been triangulated by analyzing various factors and trends from both demand and supply perspectives. In addition to data triangulation and market breakdown, the market has been validated through top-down and bottom-up approaches.
Market Definition
The virtual production market includes the ecosystem of technologies, solutions, and services that combine real-time computer graphics with traditional filmmaking methods to create a seamless blend of physical and digital worlds in content creation. Instead of using conventional green screens, virtual production employs LED walls or volumes, where hyper-realistic, computer-generated environments respond dynamically to camera movements, enabling directors and cinematographers to capture final-quality shots during filming.
The virtual production market is divided based on offering, type, end user, and region. By offering, it includes hardware, software, and rental services. Hardware consists of LED volumes, advanced cameras, and motion capture systems that form the main infrastructure of immersive workflows, while software features real-time rendering engines, tracking solutions, and editing platforms that seamlessly combine digital and physical elements. Rental services increase access by offering short-term use of high-cost equipment to smaller studios and independent creators. By type, the market is categorized into pre-production, production, and post-production. Pre-production is gaining popularity with tools like virtual location scouting, digital set design, and pre-visualization, which enable cost savings and creative flexibility. The production phase holds the largest share, driven by the use of LED walls, real-time rendering, and tracking systems that reduce reshoots and speed up filming schedules. Post-production also benefits from virtual workflows through real-time editing, VFX integration, and collaborative pipelines. By end user, the market includes movies, television series, commercial advertisements, online videos, and others, such as live events, theater, and concerts. Movies lead the market due to extensive VP adoption in blockbuster filmmaking. Television series are quickly increasing their use to meet the demand for cinematic-quality episodic content, while advertising, online videos, and live entertainment segments are increasingly using VP for faster turnaround and immersive experiences.
Key Stakeholders
- System Integrators
- Original Equipment Manufacturers (OEMs)
- Integrated Device Manufacturers (IDMs)
- Original Design Manufacturers (ODMs)
- Content Studios and Production Houses
- Suppliers and Distributors
- Governments and Other Regulatory Bodies
- Research Institutes and Organizations
- Market Research and Consulting Firms
Report Objectives
- To describe and forecast the size of the virtual production market based on offering, type, and end user in terms of value
- To describe and forecast the size of the market based on hardware offerings in terms of value and volume
- To describe and forecast the size of various segments of the market for four main regions, namely, North America, the Asia Pacific, Europe, and the Rest of the World, in terms of value
- To provide detailed information regarding drivers, restraints, opportunities, and challenges influencing the growth of the market
- To study the complete supply chain and related industry segments and perform a supply chain analysis of the market landscape
- To strategically analyze the ecosystem, Porter’s Five Forces, key stakeholders & buying criteria, technology analysis, key conferences & events, tariffs and regulations, patent landscape, trade landscape, and case studies pertaining to the market under study
- To analyze the impact of AI/Gen AI and the impact of the 2025 US tariff on the virtual production market.
- To strategically analyze micromarkets with respect to individual growth trends, prospects, and their contributions to the overall market
- To analyze opportunities for the stakeholders by identifying high-growth segments in the market
- To strategically profile the key players and provide a detailed competitive landscape of the market
- To analyze strategic approaches adopted by the leading players in the market, including product launches/developments and acquisitions
Available Customizations
With the given market data, MarketsandMarkets offers customizations according to the specific requirements of companies. The following customization options are available for the report:
Country-wise Information:
- Country-wise breakdown for North America, Europe, the Asia Pacific, and the Rest of the World
Company Information:
- Detailed analysis and profiling of additional market players (up to five)
Get the Full Virtual Production Market Report
Full forecast, segment splits, and company analysis for all Virtual Production Market.
- US Virtual Production Market
- Canada Virtual Production Market
- Mexico Virtual Production Market
- UK Virtual Production Market
- Germany Virtual Production Market
- France Virtual Production Market
- China Virtual Production Market
- Japan Virtual Production Market
- South Korea Virtual Production Market
- India Virtual Production Market
- Rest Of Europe Virtual Production Market
- Rest Of Asia Pacific Virtual Production Market
Need a Tailored Report?
Customize this report to your needs
Get 10% FREE Customization
Customize This Report
