
Microgrid Market Size, Share and Trends

Microgrid Market Size, Share and Trends by Power Generator, Energy Storage System, Controller, Grid-connected, Off-grid, Solar PV, Fuel Cell, Combined Heat and Power (CHP), Natural Gas, Remote Area, Utility and Military Facility - Global Forecast to 2030


Microgrid Market Size, Share & Trends
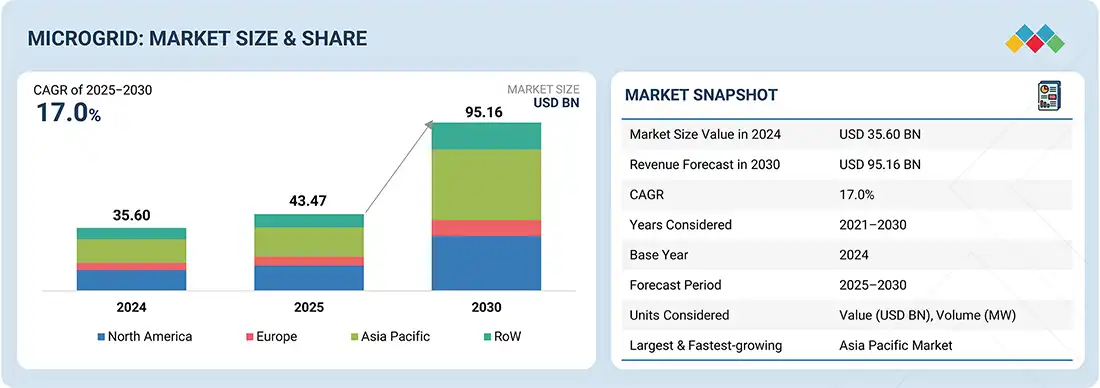
According to Marketsandmarkets, the microgrid market size is projected to reach USD 95.16 billion by 2030 from USD 43.47 billion in 2025, at a CAGR of 17.0% from 2025 to 2030. A microgrid is a localized energy system that can operate independently or with the main grid, integrating distributed energy resources for reliable and efficient power. Market growth is fueled by demand for resilient energy, renewable integration, and government initiatives supporting decarbonization and rural electrification.
The microgrid market size is expanding rapidly as governments and industries increasingly adopt decentralized and resilient energy systems. Microgrids are localized energy systems that can operate independently or alongside the main grid, integrating distributed energy resources such as solar PV, fuel cells, and combined heat and power systems to deliver reliable electricity. This rapid expansion is increasing the microgrid market share across commercial buildings, military facilities, healthcare institutions, and remote communities that require reliable power supply. As demand for resilient energy infrastructure increases, the microgrid industry is gaining significant momentum worldwide.
Several emerging microgrid market trends are shaping the future of the global microgrid industry. The increasing integration of renewable energy sources, advanced energy storage systems, and digital microgrid controllers is improving operational efficiency and supporting sustainable power generation. Solar photovoltaic systems currently contribute a significant microgrid market share, as they offer cost-effective and environmentally friendly energy generation for both grid-connected and off-grid microgrids. Additionally, the rising deployment of microgrids in remote regions and rural electrification initiatives is accelerating microgrid market growth, especially in Asia Pacific and developing economies. As governments continue investing in smart grids and clean energy infrastructure, the microgrid market size is expected to grow steadily, reinforcing the importance of the microgrid industry in building a resilient and sustainable global energy ecosystem.
MARKET SNAPSHOT TABLE
| REPORT METRIC | DETAILS |
|---|---|
| Market Size in 2025 (Value) | USD 43.47 Billion |
| Market Forecast in 2030 (Value) | USD 95.16 Billion |
| Growth Rate | CAGR of 17.00% from 2025 - 2030 |
| Years Considered | 2021−2030 |
| Base Year | 2024 |
| Forecast Period | 2025−2030 |
| Units Considered | Value (USD Billion), Volume (MW) |
| Report Coverage | Revenue forecast, company ranking, competitive landscape, growth factors, and trends |
| Top Companies |
|
| Growth Driver |
|
| Segments Covered |
|
| Regional Scope | North America, Europe, Asia Pacific, and the Rest of the World |
Market Size & Forecast
MICROGRID MARKET KEY TAKEAWAYS
-
BY OFFERINGHardware holds the largest market share, primarily comprising power generators, energy storage systems, and controllers. However, software is projected to record the highest CAGR as digital energy management, optimization, and control platforms gain traction.
-
BY CONNECTIVITYGrid-connected microgrids lead the overall market owing to increasing adoption in urban and industrial regions, while off-grid microgrids are expected to grow at the highest CAGR, driven by demand in remote and islanded communities.
-
BY POWER RATINGMicrogrids in the 1–5 MW range dominate the market due to their suitability for commercial and industrial operations. Systems above 10 MW are expected to post the highest CAGR, supported by utility-scale deployments.
-
BY POWER SOURCESolar PV is the leading power source segment in the microgrids market, offering cost efficiency and sustainability benefits. It is also expected to grow at the highest CAGR. Other key power sources include natural gas, CHP, diesel, fuel cells, and hybrid systems.
-
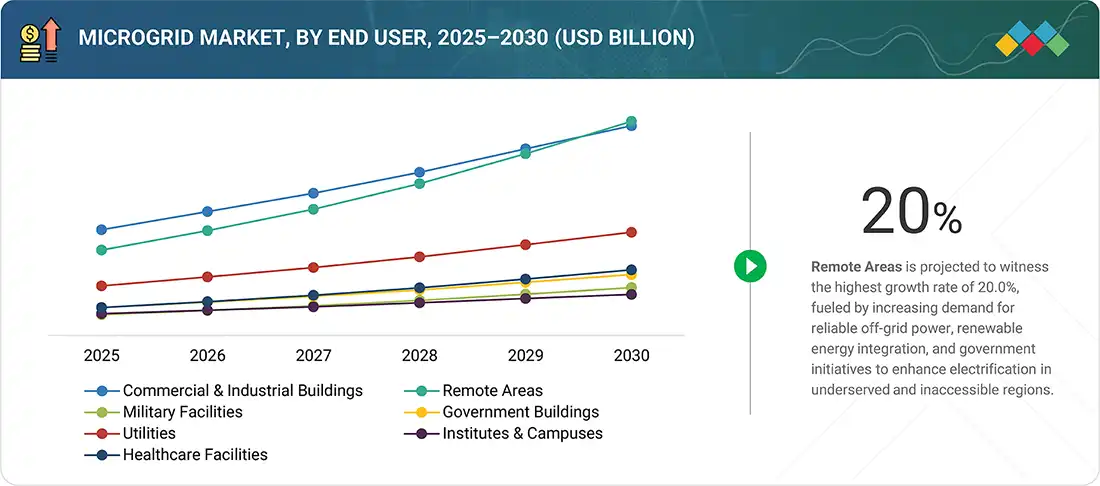
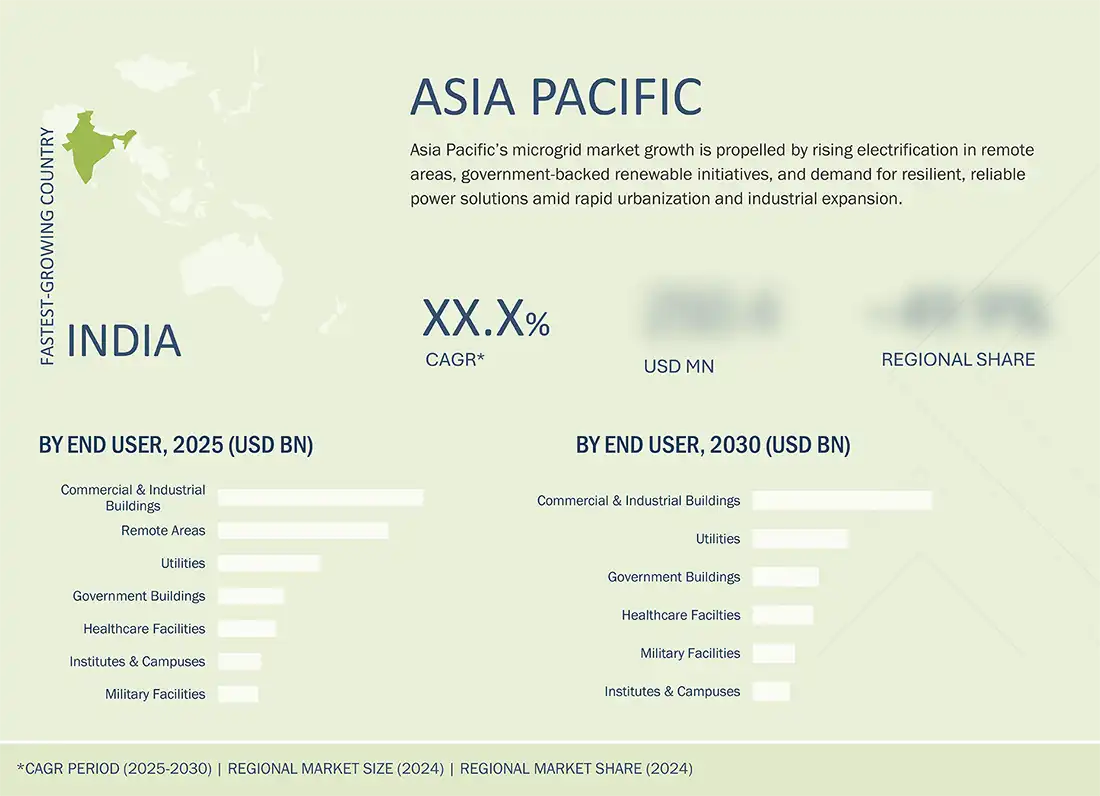
BY END USERthe remote areas segment accounts for the largest share and is expected to register the highest CAGR, driven by rural electrification needs. Commercial and industrial buildings, military facilities, utilities, government buildings, institutes and campuses, and healthcare facilities also contribute significantly.
-
BY REGIONThe microgrid market spans North America, Asia Pacific, Europe, and the Rest of the World (RoW). Asia Pacific is projected to grow at the fastest rate owing to rapid electrification, renewable integration, and supportive government initiatives.
-
COMPETITIVE LANDSCAPELeading players are pursuing organic and inorganic strategies, including partnerships, technology integration, and project expansions. Companies such as Siemens, Schneider Electric, GE Vernove, ABB, and Hitachi Energy are advancing digital platforms, investing in renewable-powered microgrid projects, and entering collaborations to strengthen their presence across emerging markets.
The microgrid market share is set to expand significantly over the next decade, driven by rising demand for resilient and decentralized energy systems. Microgrids enable reliable power supply, integration of renewables, and energy efficiency, making them vital for remote areas, commercial facilities, and critical infrastructure. Supportive policies and sustainability goals further accelerate adoption, positioning microgrids as a cornerstone of future energy ecosystems.
Source: Secondary Research, Interviews with Experts, MarketsandMarkets Analysis
TRENDS & DISRUPTIONS IMPACTING CUSTOMERS' CUSTOMERS
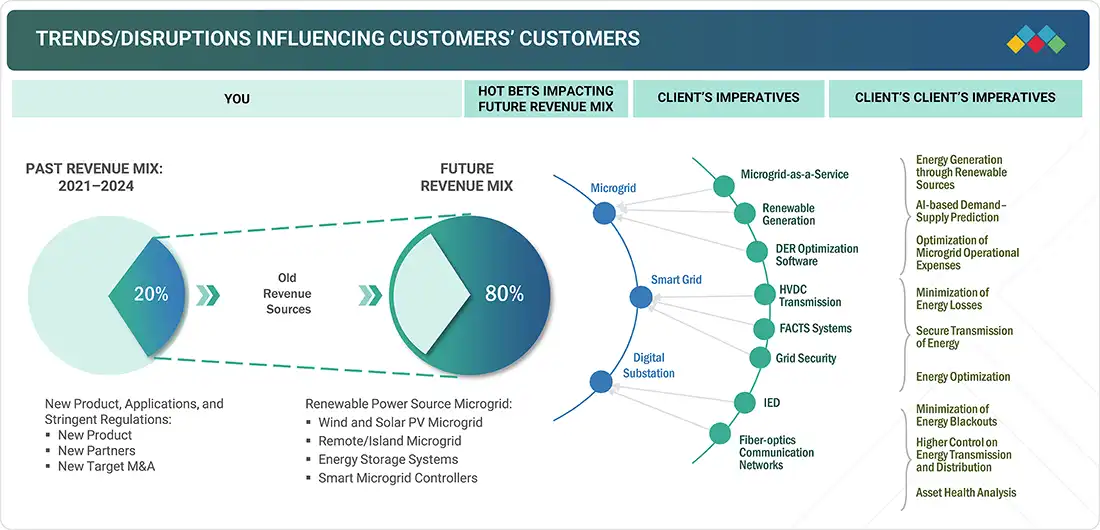
In the microgrid market trends, hot bets impacting future revenue mix include microgrid, smart grid, and digital substation, with target applications spanning renewable generation, DER optimization, HVDC transmission, and grid security. Disruptions such as demand for resilience, renewable integration, and digital grid solutions will shape end-user revenues, which in turn influence hot bets and drive the overall revenue growth of microgrid solution providers.
Source: Secondary Research, Interviews with Experts, MarketsandMarkets Analysis
MICROGRID MARKET DYNAMICS
Level
-
Accelerating global push toward decarbonization and renewable integration

-
Growing focus on resilient power supply amid extreme weather events and grid failures

Level
-
High capital and lifecycle maintenance costs

-
Interconnection complexities and delays in grid synchronization

Level
-
Implementation of government incentives, policy support, and decentralization mandates

-
Advancements in digitalization, smart grid, and AI/Gen AI-powered optimization solutions

Level
-
Absence of unified standards and regulatory frameworks

-
Technical challenges in islanded mode and grid resynchronization

Source: Secondary Research, Interviews with Experts, MarketsandMarkets Analysis
Driver: Expanding microgrid deployment for rural and remote electrification
Microgrids are increasingly deployed in rural and remote regions to provide reliable, decentralized power where grid connectivity is weak or absent. Their ability to integrate renewable energy and ensure resilience makes them highly attractive for islanded communities, mining operations, and developing regions, supporting global electrification and sustainable energy access initiatives.
Restraint: High capital and lifecycle maintenance costs
Despite long-term benefits, microgrids require significant upfront investment in generation, storage, and control infrastructure. Additionally, ongoing lifecycle costs for maintenance and system upgrades remain high, posing financial challenges for small-scale operators and communities. These cost barriers to adoption are particularly significant in emerging markets with limited access to capital and subsidies.
Opportunity: Advancements in digitalization, smart grid, and AI/GenAI-powered optimization solutions
The growing integration of digital technologies is transforming microgrid performance and management. Smart grid platforms, AI- and GenAI-driven predictive analytics, and advanced energy management systems enable load balancing, cost optimization, and predictive maintenance. These advancements open opportunities for scalable, intelligent, and adaptive microgrid solutions tailored to evolving energy needs.
Challenge: Growing cybersecurity threats associated with distributed energy systems
As microgrids increasingly rely on digital control systems and interconnected assets, they become more vulnerable to cyberattacks. Breaches can disrupt operations, compromise grid stability, and cause significant financial losses. Addressing these risks through robust cybersecurity measures, regulatory frameworks, and secure architectures is a major challenge for scaling distributed energy systems globally.
MICROGRID MARKET SIZE, SHARE & GROWTH: COMMERCIAL USE CASES ACROSS INDUSTRIES
| COMPANY | USE CASE DESCRIPTION | BENEFITS |
|---|---|---|
 |
Deployment of modular, renewable-integrated microgrid solutions for commercial & industrial buildings | Improved energy resilience, reduced downtime, and operational cost savings |
 |
Smart microgrid controllers for campuses and urban utilities enabling real-time optimization | Enhanced grid stability, seamless renewable integration, and reduced energy losses |
 |
Hybrid renewable-powered microgrids for remote communities and islanded regions | Reliable power supply, minimized diesel dependency, and lower carbon emissions |
 |
Digital microgrid platforms integrating storage and renewable sources for healthcare facilities | Continuous power for critical operations, improved efficiency, and reduced lifecycle costs |
 |
AI-driven microgrid solutions for government and military facilities | Enhanced energy security, predictive maintenance, and optimized asset utilization |
Logos and trademarks shown above are the property of their respective owners. Their use here is for informational and illustrative purposes only.
MICROGRID MARKET ECOSYSTEM
The microgrid ecosystem comprises input and component suppliers, solution designers and manufacturers, system integrators and service providers, project developers and financing partners, and end users. Component suppliers provide critical hardware and technologies, while designers and integrators build tailored solutions. Project developers and financiers enable deployment, ensuring seamless delivery to end users across industries seeking reliable, efficient, and sustainable energy solutions.
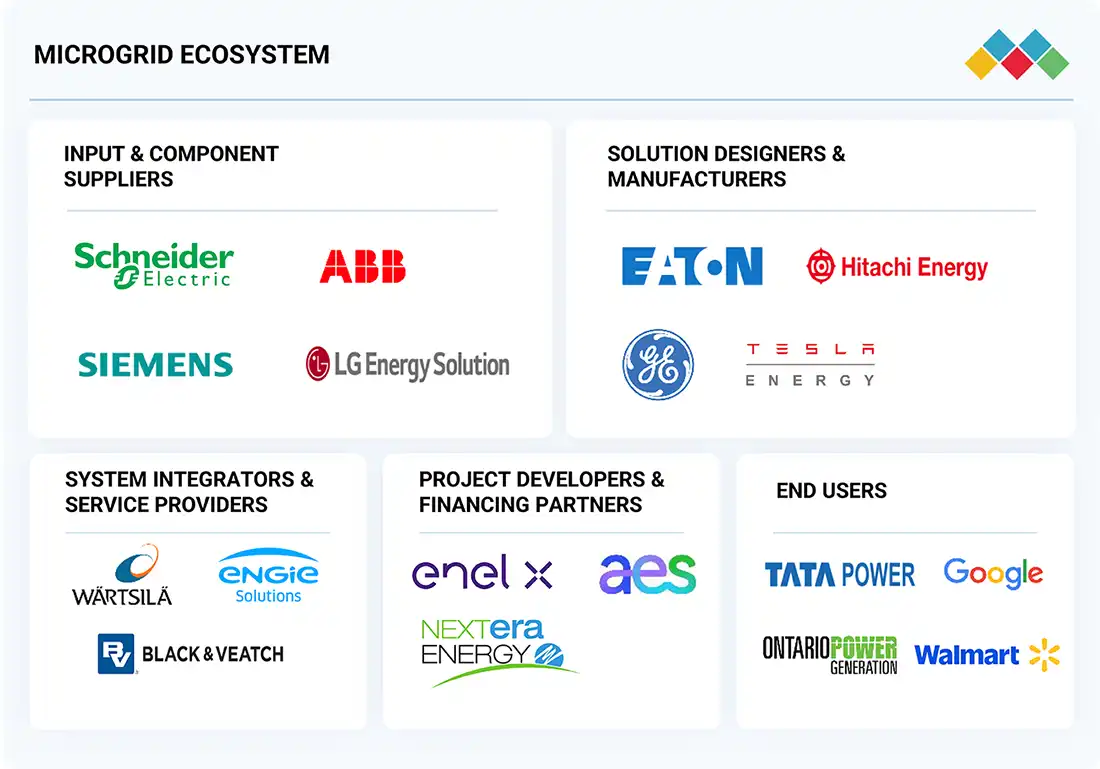
Logos and trademarks shown above are the property of their respective owners. Their use here is for informational and illustrative purposes only.
MICROGRID MARKET SEGMENTS
Source: Secondary Research, Interviews with Experts, MarketsandMarkets Analysis
Microgrid Market, By Power Rating
The 1–5 MW segment accounted for the largest market share in 2024, as it is widely deployed across commercial and industrial facilities due to its balance of cost-efficiency and capacity to meet mid-scale energy needs. Conversely, microgrids above 10 MW are expected to grow at the fastest CAGR, driven by rising adoption in utility-scale applications and large-scale renewable integration projects.
Microgrid Market, By Power Source
The solar PV segment held the largest share in 2024 and is also projected to grow at the highest CAGR. Solar-powered microgrids are increasingly preferred due to their sustainability, declining photovoltaic costs, and suitability for both grid-connected and off-grid applications. Natural gas, CHP, diesel, fuel cells, and hybrid systems also contribute to energy diversification within the microgrid landscape.
Microgrid Market, By Connectivity
Grid-connected microgrids dominated the market in 2024, primarily supported by deployment in urban and industrial regions to enhance energy reliability and reduce peak load pressures. Off-grid microgrids, however, are projected to expand at the highest CAGR during the forecast period, driven by the demand for decentralized, resilient power solutions in remote areas and islanded communities.
Microgrid Market, By Offering
The hardware segment accounted for the largest market share in 2024, led by strong demand for power generators, energy storage systems, and controllers that form the core of microgrid operations. Meanwhile, the software segment is expected to witness the fastest CAGR, propelled by advancements in energy management, optimization, and digital control solutions, enabling smarter and more flexible microgrid operations.
Microgrid Market, By End User
Commercial & industrial buildings held the largest share of the market in 2024, driven by the growing need for reliable and cost-efficient power to support critical operations and reduce dependency on the central grid. By 2030, the remote areas segment is projected to emerge as the largest market and is projected to register the highest CAGR, supported by rural electrification initiatives and renewable-powered off-grid deployments. Other key end users include military facilities, government establishments, utilities, institutes & campuses, and healthcare facilities, where microgrids improve energy resilience, cost savings, and sustainability outcomes.
MICROGRID MARKET REGION
Asia Pacific to be the fastest-growing region in the global microgrid market during the forecast period
The Asia Pacific microgrid industry is expected to register the highest CAGR during the forecast period, driven by rapid urbanization, industrialization, and growing investments in renewable energy and smart infrastructure. Countries such as China, India, Japan, and South Korea are increasingly deploying microgrids in commercial, industrial, and remote areas to ensure a reliable and resilient power supply. Supportive government policies, rural electrification programs, and ongoing R&D initiatives are fostering innovation and expanding microgrid adoption across the region.
The US microgrid market is projected to reach USD 24.82 billion by 2030 from USD 11.33 billion in 2025, at a CAGR of 17.0% from 2025 to 2030. The market is projected to witness strong growth over the forecast period, driven by increasing investments in grid resilience, rising integration of renewable energy sources, and growing demand for reliable and uninterrupted power supply. The market is expanding steadily with increasing deployment across commercial & industrial facilities, data centers, military installations, and remote areas.
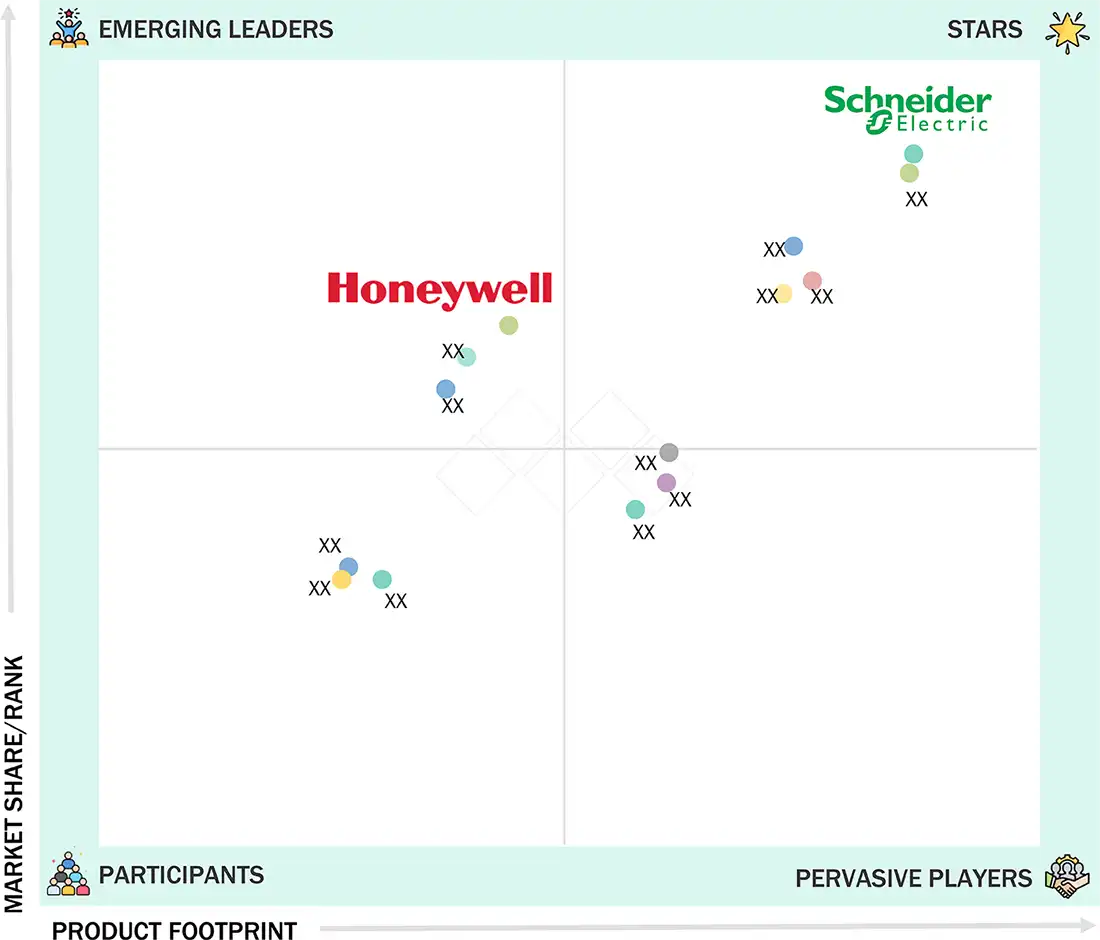
MICROGRID MARKET SIZE, SHARE & GROWTH: COMPANY EVALUATION MATRIX
In the microgrid companies matrix, Schneider Electric (Star) leads with a strong global presence and comprehensive offerings across hardware, software, and services, enabling large-scale deployment of microgrids in commercial, industrial, and utility sectors. Honeywell International Inc. (Emerging Leader) is gaining traction with innovative energy management solutions and digital microgrid platforms for remote and off-grid applications. While Schneider dominates with scale and established projects, Honeywell demonstrates significant growth potential to advance toward the leaders’ quadrant.
Source: Secondary Research, Interviews with Experts, MarketsandMarkets Analysis
MICROGRID MARKET KEY PLAYERS
WHAT IS IN IT FOR YOU: Microgrid Market REPORT CONTENT GUIDE
DELIVERED CUSTOMIZATIONS
We have successfully delivered the following deep-dive customizations:
| CLIENT REQUEST | CUSTOMIZATION DELIVERED | VALUE ADDS |
|---|---|---|
| North American Utility Company | Comparative benchmarking of grid-tied microgrids vs. islanded microgrid solutions in renewable integration | Provided strategic shift toward hybrid microgrid solutions; Identified cost optimization opportunities in distributed energy resources |
| European Energy Storage Manufacturer | Lifecycle cost-benefit analysis of battery energy storage systems for commercial microgrid applications | Helped optimize battery sizing strategies to enhance grid resilience and reliability |
| Renewable Energy Developer | Mapping of renewable resource potential (solar, wind, biomass) for microgrid projects; Integration analysis with energy storage solutions; Regulatory and incentive landscape review | Supported prioritization of high-return microgrid project opportunities; Identified potential for hybrid energy solutions across solar, wind, and biomass; Enhanced competitive positioning through early recognition of policy incentives |
| Asia Pacific Industrial Developer | Evaluation of smart grid integration with renewable generation systems for manufacturing facilities | Provided roadmap for energy independence and improved power quality |
| Global Technology Solutions Provider | Assessment of AI-powered microgrid control systems for remote and critical infrastructure applications | Enabled product differentiation through intelligent energy management; Identified market expansion opportunities in defense and healthcare sectors |
| Global Renewable Energy Developer | Market research study on community microgrid solutions for rural electrification and disaster resilience applications | Identified key technology trends and competitive landscape in emerging markets; Supported strategic planning and investment decisions for microgrid portfolio expansion |
RECENT DEVELOPMENTS
- August 2025 : Caterpillar (US) and Hunt Energy (US) entered into a long-term strategic partnership to deliver highly efficient, independent energy production solutions for data centers, with plans to deploy up to 1 GW of generation capacity. Solutions include natural gas and diesel gensets, gas turbines, control systems, and integration of battery energy storage.
- June 2025 : Tesla (US) closed a USD 440.0 million deal with Clearway Energy in Utah for a 1.4 GWh battery system, improving grid delivery and energy reliability.
- November 2024 : Eaton (Ireland) introduced the xStorage Battery Energy Storage System, a scalable 250–1000 kWh solution with built-in microgrid functionalities. Designed for seamless islanding, renewable integration, and demand management, the system targets commercial users seeking decarbonization and energy independence.
- August 2024 : Tesla Energy (US) expanded its commercial microgrid solutions in Australia, integrating Powerpack battery systems with solar farms and advanced site controllers to support renewable energy backup for agriculture and telecom sectors.
- June 2024 : Hitachi Energy Ltd. (Switzerland) partnered with Japan’s Ministry of Land to develop hydrogen-powered microgrids for disaster-prone zones. The projects combine electrolyzers, fuel cells, and solar PV under a unified energy management system (EMS).
Table of Contents
 Exclusive indicates content/data unique to MarketsandMarkets and not available with any competitors.
Methodology
The research process for this study included systematic gathering, recording, and analysis of data about customers and companies operating in the Microgrid Market. This process involved the extensive use of secondary sources, directories, and databases (Factiva and Oanda) to identify and collect valuable information for the comprehensive, technical, market-oriented, and commercial study of the Microgrid Market. In-depth interviews were conducted with primary respondents, including experts from core and related industries and preferred manufacturers, to obtain and verify critical qualitative and quantitative information and assess growth prospects. Key players in the Microgrid Market were identified through secondary research, and their market rankings were determined through primary and secondary research. This research included studying annual reports of top players and interviewing key industry experts such as CEOs, directors, and marketing executives.
Secondary Research
Various sources were used in the secondary research process to identify and collect information important for this study. These include company annual reports, press releases, investor presentations, white papers, technology journals, certified publications, articles by recognized authors, directories, and databases.
Secondary research was mainly used to obtain key information about the industry’s value chain, the total pool of market players, the market classification according to industry trends to the bottom-most level, regional markets, and key developments from market and technology-oriented perspectives.
Primary Research
Primary research was also conducted to identify the segmentation types, key players, competitive landscape, and key market dynamics, such as drivers, restraints, opportunities, challenges, and industry trends, along with key strategies adopted by players operating in the Microgrid Market. Extensive qualitative and quantitative analyses were performed on the complete market engineering process to list key information and insights throughout the report.
Extensive primary research has been conducted after acquiring knowledge about the Microgrid Market scenarios through secondary research. Several primary interviews have been conducted with experts from the demand (end user and region) and supply side (heating equipment, cooling equipment, ventilation equipment, implementation type, system type, technology) across four major geographic regions: North America, Europe, Asia Pacific, and RoW. Approximately 60% and 40% of the primary interviews were conducted from the supply and demand sides, respectively. These primary data have been collected through questionnaires, emails, and telephonic interviews.

Note: “Others” includes sales, marketing, and product managers
To know about the assumptions considered for the study, download the pdf brochure
Market Size Estimation
In the market engineering process, the top-down and bottom-up approaches and data triangulation methods have been used to estimate and validate the size of the microgrid market and other dependent submarkets. The research methodology used to estimate the market sizes includes the following:
- Identifying stakeholders in the microgrid market, including regulatory bodies and policy authorities (US Department of Energy, Federal Energy Regulatory Commission [FERC], International Electrotechnical Commission [IEC]), certification agencies, industry associations, consulting firms, technology providers, equipment manufacturers, project developers, utilities, EPC contractors, and end users across sectors such as commercial & industrial buildings, remote areas, military facilities, campuses, healthcare facilities, and utilities
- Analyzing major providers of microgrid solutions and services and their key offerings, including control systems, energy management systems (EMS), distributed energy resources (DERs) integration, advanced metering infrastructure, power electronics (inverters, converters), battery energy storage systems, renewable energy generation units (solar PV, wind, biomass), and dispatchable generation (diesel, natural gas)
- Studying trends of microgrid adoption across end users, segmented by connectivity, power source, power rating, offering, end user, and region
- Tracking recent market developments, including regulatory updates, policy incentives, technology advancements (AI- and IoT-integrated microgrid controllers, blockchain-based energy trading, peer-to-peer energy platforms), deployment of advanced storage technologies, integration of electric vehicle (EV) charging infrastructure, and mergers & acquisitions by key players to forecast market size and identify emerging opportunities
- Conducting multiple discussions with key opinion leaders, including microgrid solution providers, EPC contractors, utilities, renewable energy developers, and regulatory consultants to understand real-time deployment trends, technical challenges, and the growing focus on resilience, energy security, decarbonization, and cost optimization
- Validating market estimates through in-depth consultations with industry experts, ranging from CTOs of leading microgrid technology companies to energy planners, project managers, and sustainability officers, and aligning insights with domain specialists at MarketsandMarkets for accurate and reliable market projections
Microgrid Market : Top-Down and Bottom-Up Approach

Data Triangulation
After arriving at the overall market size by the market size estimation process explained in the earlier section, the overall microgrid market has been divided into several segments and subsegments. The data triangulation and market breakdown procedures have been used to complete the overall market engineering process and arrive at the exact statistics for all segments, wherever applicable. The data was triangulated by studying various factors and trends from the perspectives of demand and supply. Along with data triangulation and market breakdown, the market has been validated by top-down and bottom-up approaches.
Market Definition
A microgrid is a localized energy system that integrates distributed energy resources (DERs), such as solar PV, wind turbines, generators, energy storage, and advanced control systems, to supply electricity to a defined group of consumers. Operating as a single controllable entity, it can function in either grid-connected or island (off-grid) mode to enhance reliability, resilience, and efficiency across campuses, hospitals, military facilities, utilities, commercial & industrial sites, and remote communities. The market encompasses microgrid-integrated DERs across a capacity range from less than 1 MW to above 10 MW.
Key Stakeholders
- Raw Material & Component Suppliers
- Microgrid Developers & EPC Contractors
- Distribution Network Service Providers
- Power-Generating Companies & Energy Producers
- Electric Utilities & Retail Energy Providers
- Technology & Equipment Manufacturers
- Government & Regulatory Agencies
- Standardization Bodies, Forums, and Industry Associations
- Consulting & Advisory Firms
- Research & Academic Institutions
- Financial Institutions & Investors
- End Users
Report Objectives
- To define, describe, segment, and forecast the size of the microgrid market, by offering, connectivity, power rating, power source, end user, and region, in terms of value
- To describe the microgrid market based on types, patterns, and architecture types
- To forecast the size of various segments for four regions, namely North America, Asia Pacific, Europe, and the Rest of the World (RoW), in terms of value and volume
- To offer detailed information on drivers, restraints, opportunities, and challenges influencing market growth
- To provide a detailed overview of the microgrid market value chain
- To strategically analyze the micromarkets concerning individual growth trends, prospects, and contributions to the overall market
- To analyze industry trends, pricing data, patents and innovations, technology analysis, ecosystem analysis, relevant case studies, Porter’s five forces analysis, key stakeholders and buying criteria, key conferences, trends/disruptions impacting customers’ businesses, regulatory landscape, and trade data (export and import data), the impact of AI/Gen AI, and the 2025 US tariff on the market under study, along with the macroeconomic outlook for each region
- To analyze opportunities for various stakeholders by identifying the high-growth segments of the market
- To benchmark the key players and analyze their market position in terms of revenue, market share, and core competencies, and detailed competitive landscape for the market leaders
- To analyze competitive developments, such as product launches, contracts, acquisitions, partnerships, and agreements, carried out by players in the microgrid market
Customization Options
With the given market data, MarketsandMarkets offers customizations according to the specific requirements of companies. The following customization options are available for the report:
Country-wise Information:
- Country-wise breakdown for North America, Europe, Asia Pacific, and the Rest of the World
Company Information:
- Detailed analysis and profiling of additional market players (up to five)
Key Questions Addressed by the Report
What is the current size of the Microgrid Market?
The global Microgrid Market is estimated at USD 43.47 billion in 2025 and is projected to reach USD 95.16 billion by 2030.
What is the expected CAGR of the Microgrid Market during 2025–2030?
The market is expected to grow at a CAGR of 17.0% from 2025 to 2030, driven by increasing investments in decentralized energy systems, renewable integration, and grid resilience initiatives.
What are the major growth drivers of the Microgrid Market?
Key growth drivers include the global push toward decarbonization, rising deployment of renewable energy sources, demand for resilient power infrastructure, rural electrification projects, and increasing integration of EV charging infrastructure with microgrids.
Which offering segment holds the largest share of the Microgrid Market?
The Hardware segment holds the largest market share, comprising power generators, energy storage systems, and controllers that form the core infrastructure of microgrid systems.
Which offering segment is expected to grow the fastest?
The Software segment is projected to register the highest CAGR due to increasing demand for energy management systems, predictive analytics, AI-driven optimization, and real-time microgrid monitoring platforms.
Which connectivity type dominates the Microgrid Market?
Grid-connected microgrids currently account for the largest market share because of widespread adoption across commercial, industrial, and urban applications requiring reliable power and grid support.
Which connectivity segment is expected to grow the fastest?
The Off-grid microgrid segment is expected to witness the highest CAGR during the forecast period, driven by increasing deployment in remote communities, islands, mining operations, and rural electrification projects.
Which region is projected to be the fastest-growing Microgrid Market?
Asia Pacific is expected to register the highest CAGR through 2030, supported by rapid urbanization, renewable energy investments, smart grid initiatives, and rural electrification programs in China, India, Japan, and South Korea.
Who are the leading companies operating in the Microgrid Market?
Major market participants include Schneider Electric, Siemens, GE Vernova, ABB, and Hitachi Energy. These companies focus on digital energy management, renewable integration, and advanced microgrid technologies.
What are the key trends shaping the future of the Microgrid Market?
Major trends include AI/ML-powered microgrid controllers, advanced battery energy storage systems, virtual power plants (VPPs), blockchain-enabled energy management, smart grid integration, IoT connectivity, and renewable-powered microgrids.
Need a Tailored Report?
Customize this report to your needs
Get 10% FREE Customization
Customize This ReportPersonalize This Research
- Triangulate with your Own Data
- Get Data as per your Format and Definition
- Gain a Deeper Dive on a Specific Application, Geography, Customer or Competitor
- Any level of Personalization
Let Us Help You
- What are the Known and Unknown Adjacencies Impacting the Microgrid Market
- What will your New Revenue Sources be?
- Who will be your Top Customer; what will make them switch?
- Defend your Market Share or Win Competitors
- Get a Scorecard for Target Partners

Custom Market Research Services
We Will Customise The Research For You, In Case The Report Listed Above Does Not Meet With Your Requirements
Get 10% Free CustomisationTESTIMONIALS

Tetsuya Ohhira
Business Development Manager-Technology Business
Nikon Corporation,
Leading Japanese MNC specializing in optics and imaging productswww.nikon.com
MarketsandMarkets™ response
is quick. Their attitude is flexible and positive. Analyst Insights are globally considered and
significant. Client Services quickly respond to our inquiry and demand. Their wide range of global
surveys help us make our strategic plan.
We hope Knowledge Store will be easier to search
for a report.
VP - Marketing & Business Development
Leading Provider of Process Control Solutions
We engaged with MarketsandMarkets on a study to perform an analysis and recommend a Go-To-Market strategy for metrology and process control in the semiconductor market. The study was tailored to our targets and needs with well-defined milestones. Our overall experience with the MarketsandMarkets team was very good throughout the project in all aspects including the analysis methodologies used, the quality and depth of primary and secondary data sets, the professionalism and flexibility of the team and the ability to meet the target schedule and milestones. We want to thank MarketsandMarkets team for a job well done.
Growth opportunities and latent adjacency in Microgrid Market


Dennis
Apr, 2026
How are emerging technologies like Artificial Intelligence and Blockchain impacting revenue streams and operational efficiency?.
Patrick
Apr, 2026
What is the expected ROI timeline for microgrid investments across different deployment models (grid-connected vs off-grid)?.
Brandon
Apr, 2026
Does the report include cost-benefit analysis or ROI benchmarks for microgrid deployments?.
Edward
Apr, 2022
Looking to get an idea of the market share of MicroGrid controllers in the U.S. including depoyment costs. .
User
Sep, 2019
Decentralization of energy generation is one of the important trends these days, could you share the list of ongoing and upcoming microgrid projects in Asia Pacific and the Middle East regions? Also, could you share specific information about the regulations and policies across the regions for energy saving?.
User
Sep, 2019
I am looking for technological mix and trends - Economies of scale - Major players - Geographies likely to adapt Microgrids -Developers - Policies and regulatory support - Funding and financial viability. Can you provide this information?.
User
Sep, 2019
Can I get an India-only cut of this report? Does it have market size projections by value chain component (e.g., building microgrids, operating and maintaining microgrids), by type (connected to main grid vs. disconnected) and sector? If so, please advise best price ASAP - I am looking to sort this out in the next 2 hours..
User
Nov, 2019
I am interested in commercial aspects in the US and UK only. And, would like to see information by total US and by region within the US. Is that possible? Can just the 2 countries be purchased? and if so at what cost?.
User
Mar, 2019
We are a componment/system supplier in this market and getting this down to a unit level is helpful. I see that there is a $7m figure for a 2MW microgrid system. Should I simply divide by that? It also shows ABB with 30 projects per year. Do you have similar data to that for other companies?.