 Download PDF
 Request Customisation

Neuromorphic Computing Market Size, Share & Growth
Report Code
SE 3744
Published in
Feb, 2025, By MarketsandMarkets™
Neuromorphic Computing Market by Offering (Processor, Sensor, Memory, Software), Deployment (Edge, Cloud), Application (Image & Video Processing, Natural Language Processing (NLP), Sensor Fusion, Reinforcement Learning) - Global Forecast to 2030

USD 1325.2 MN
MARKET SIZE, 2030

CAGR 89.7%
(2024-2030)

259
REPORT PAGES

167
MARKET TABLES
NEUROMORPHIC COMPUTING MARKET OVERVIEW
The neuromorphic computing market is projected to reach USD 1325.2 million by 2030 from USD 28.5 million in 2024, at a CAGR of 89.7% from 2024 to 2030. The growth of the neuromorphic computing market is driven by rising demand for ultra-low-power AI processing, increasing adoption of edge intelligence in robotics and IoT devices, and advancements in brain-inspired architectures enabling real-time learning and perception.
Neuromorphic Computing Market Size & Forecast
• 2025 Market Size: USD 28.5 million
• 2030 Projected Market Size: USD 1325.2 million
• CAGR (2025-2030): 89.7%
• Software Segment: highest CAGR of 94.0%.
• Asia Pacific: fastest-growing region
KEY TAKEAWAYS
-
By RegionThe North America neuromorphic computing market accounted for a 35.6% revenue share in 2023.
-
By OfferingBy offering, the software segment is expected to register the highest CAGR of 94.0%.
-
By DeploymentBy deployment, the cloud segment is projected to grow at the fastest rate from 2024 to 2030.
-
By applicationBy application, the Image & video processing segment is expected to dominate the market.
-
By VertcialBy vertcial, the automotive segment will grow the fastest during the forecast period.
-
Competitive LandscapeCompany Intel Corporation (US), IBM (US), and Qualcomm Technologies, Inc. (US) were identified as some of the star players in the neuromorphic computing market (global), given their strong market share and product footprint.
-
Competitive LandscapeCompanies Natural Intelligence (US), Prophesee.ai (France), and Innatera Nanosystems BV (Netherlands), among others, have distinguished themselves among startups and SMEs by securing strong footholds in specialized niche areas, underscoring their potential as emerging market leaders
The Neuromorphic Computing Industry is witnessing strong growth, driven by rising demand for ultra-low-power, real-time AI processing in edge devices, autonomous systems, and advanced sensors. New deals and developments, including collaborations between chipmakers and research institutes, investments in brain-inspired architectures, and innovations in spiking neural networks and event-based vision technologies, are accelerating commercialization and reshaping the competitive landscape.

Source: Secondary Research, Interviews with Experts, MarketsandMarkets Analysis
TRENDS & DISRUPTIONS IMPACTING CUSTOMERS' CUSTOMERS
Neuromorphic computing is being increasingly adopted in applications such as autonomous vehicles, robotics, medical devices, and advanced driver assistance systems (ADAS). As these areas mature, traditional market growth potential may slow down. However, emerging application areas like edge AI, spiking neural networks, healthcare robotics, IoT, and wearables present new opportunities for revenue generation in the future.

Source: Secondary Research, Interviews with Experts, MarketsandMarkets Analysis
NEUROMORPHIC COMPUTING MARKET DYNAMICS
Drivers
Impact
Level
Level
-
Rising adoption of neuromorphic hardware

-
Need for alternative approaches to enhance computational power

RESTRAINTS
Impact
Level
Level
-
Lack of R&D investments

-
Complexity of algorithms

OPPORTUNITIES
Impact
Level
Level
-
Fault-tolerant nature

-
Increasing adoption in healthcare sector

CHALLENGES
Impact
Level
Level
-
Complications associated with software development

-
Complexities linked with developing computational models

Source: Secondary Research, Interviews with Experts, MarketsandMarkets Analysis
Driver: Rising adoption of neuromorphic hardware
Neuromorphic ICs will become a standard in high-performance computing, driving innovations and efficiency improvements across various industries due to their superior performance and energy efficiency compared to traditional ICs.
Restraint: Lack of R&D investments
Limited funding and slow progress in neuromorphic research will hinder immediate advancements and the development of practical applications, delaying market growth. As awareness and interest grow, increased investment and R&D efforts will mitigate this restraint, gradually accelerating development and real-world applications.
Opportunity: Fault-tolerant nature
Initial implementations will focus on enhancing autonomous vehicle navigation and optimizing space mission operations. Widespread adoption is expected, with significant advancements in autonomous driving and space exploration capabilities due to improved real-time data processing and decision-making.
Challenge: Complications associated with software development
Initial challenges will persist in developing software that can effectively utilize diverse neural hardware platforms, limiting widespread adoption in specialized applications. Standardization efforts and advancements in software tools will mitigate compatibility issues, fostering broader adoption across industries
NEUROMORPHIC COMPUTING MARKET SIZE, SHARE & GROWTH: COMMERCIAL USE CASES ACROSS INDUSTRIES
| COMPANY | USE CASE DESCRIPTION | BENEFITS |
|---|---|---|
 |
Neuromorphic chips used for real-time gesture recognition, autonomous robotics navigation, and sparse sensor data processing. | Ultra-low power processing, millisecond-level inference, improved edge AI performance. |
 |
Deploys neuromorphic systems for pattern recognition and large-scale neural simulations in research labs. | Massive parallelism, reduced computational load, highly energy-efficient training/inference. |
 |
Event-based neuromorphic vision sensors integrated into industrial inspection cameras. | High-speed motion tracking, reduced latency, lower data rates than traditional camera sensors. |
 |
Neuromorphic processors embedded in wearables and AR devices. | Always-on sensing with microwatt-level power consumption and instant response. |
Logos and trademarks shown above are the property of their respective owners. Their use here is for informational and illustrative purposes only.
NEUROMORPHIC COMPUTING MARKET ECOSYSTEM
The neuromorphic computing market ecosystem involves various categories of companies, organizations, and entities that play essential roles in developing, manufacturing, distributing, and utilizing neuromorphic computing.

Logos and trademarks shown above are the property of their respective owners. Their use here is for informational and illustrative purposes only.
NEUROMORPHIC COMPUTING MARKET SEGMENTS

Source: Secondary Research, Interviews with Experts, MarketsandMarkets Analysis
Neuromorphic Computing Market, By Offering
Processor segment will hold high market share during the forecast period. The market growth is credited to their ability to handle tasks like pattern recognition and adaptive learning more efficiently by replicating neural network structures in hardware. Neuromorphic processors are designed to address several limitations of conventional processors, particularly in AI and machine learning.
Neuromorphic Computing Market, By Deployment
Edge segment to hold largest market share in neuromorphic computing market during the forecast period. As businesses continue to prioritize low-latency, energy efficiency and real-time processing, the adoption of edge AI solutions is expected to accelerate, further driving growth in this segment.
Neuromorphic Computing Market, By Application
Natural language processing is one of the promising applications of neuromorphic computing that leverage the brain-inspired design of spiking neural networks (SNNs) to enhance the efficiency and accuracy of language data processing. The rise in demand for real-time and efficient language processing in devices like smartphones to IoT devices, necessitates low-power, high-performance solutions driving NLP demand in neuromorphic computing market
Neuromorphic Computing Market, By Vertical
Consumer electronics segment is projected to hold major share in neuromorphic computing market during the forecast period. Smartphones benefit from the neuromorphic technology's ability to handle power-hungry operations like biometrics more efficiently.There is also growing demand for wearables in personal health and fitness, underscoring the importance of neuromorphic computing.
NEUROMORPHIC COMPUTING MARKET REGION
Asia Pacific to be fastest-growing region in global neuromorphic computing market during forecast period
Asia Pacific will grow at a high rate during the forecasted period. APAC governments are actively investing in AI technology, by dedicating considerable resources in development of AI infrastructure. Since several new market players have shown their interest in neuromorphic computing and have escalated their investments in the developing technologies, the market is expected to see higher growth rate in the near future.

NEUROMORPHIC COMPUTING MARKET SIZE, SHARE & GROWTH: COMPANY EVALUATION MATRIX
In the neuromorphic computing market matrix, Intel Corporation (Star) leads with a strong market share and a broad technology footprint, driven by its Loihi neuromorphic processors and deep ecosystem collaborations across robotics, edge AI, and research institutions. BrainChip (Emerging Leader) is gaining momentum with its Akida platform, offering ultra-low-power, event-based processing that is increasingly recognized in automotive, IoT, and embedded AI applications.

Source: Secondary Research, Interviews with Experts, MarketsandMarkets Analysis
NEUROMORPHIC COMPUTING MARKET KEY PLAYERS
- Intel Corporation (US)
- BrainChip, Inc. (Australia)
- IBM (US)
- SynSense (China)
- MediaTek Inc. (Taiwan)
- NXP Semiconductors (Netherlands)
- Qualcomm Technologies, Inc. (US)
- Advanced Micro Devices, Inc. (US)
- Hewlett Packard Enterprise Development LP (US)
- SAMSUNG (South Korea)
NEUROMORPHIC COMPUTING MARKET SCOPE
| REPORT METRIC | DETAILS |
|---|---|
| Market Size in 2023 (Value) | USD 20.9 Million |
| Market Forecast in 2030 (Value) | USD 1,325.2 Million |
| Growth Rate | CAGR of 89.7% from 2024-2030 |
| Years Considered | 2020-2030 |
| Base Year | 2023 |
| Forecast Period | 2024-2030 |
| Units Considered | Value (USD Million), Volume (Thousand Units) |
| Report Coverage | Revenue forecast, company ranking, competitive landscape, growth factors, and trends |
| Segments Covered |
|
| Regions Covered | North America, Asia Pacific, Europe, RoW |
WHAT IS IN IT FOR YOU: NEUROMORPHIC COMPUTING MARKET SIZE, SHARE & GROWTH REPORT CONTENT GUIDE

DELIVERED CUSTOMIZATIONS
We have successfully delivered the following deep-dive customizations:
| CLIENT REQUEST | CUSTOMIZATION DELIVERED | VALUE ADDS |
|---|---|---|
| Chip Manufacturer | Comprehensive benchmarking of neuromorphic processors vs GPUs/ASICs | Analysis of spiking neural network (SNN) architectures |
| AI Hardware OEM | Workload mapping for neuromorphic suitability in vision, speech, robotics, and anomaly detection | Performance and accuracy comparison with traditional accelerators |
| Cloud & Edge Service Providers | Deployment feasibility for neuromorphic accelerators in edge nodes, micro-data centers, and hybrid architectures | Real-time inference benchmarking under varied workloads |
| Automotive & Robotics Firms | Detailed mapping of neuromorphic computing use cases in perception, sensor fusion, SLAM, real-time decision-making, and motion control | Benchmarking of response time and robustness under dynamic environments |
| Research Labs & Government Agencies | Technology scouting across global neuromorphic R&D hubs | IP and patent landscape mapping |
RECENT DEVELOPMENTS
- May 2024 : BrainChip, Inc. partnered with Frontgrade Gaisler, a leader in RISC-V processor development for space applications, to create a groundbreaking integration. This partnership brings together BrainChip’s Akida neuromorphic processor with Frontgrade Gaisler’s fault-tolerant, radiation-hardened microprocessors.
- April 2024 : Intel Corporation launched Hala Point, the world's largest neuromorphic system, at Sandia National Laboratories. Utilizing Loihi 2 processors supports brain-inspired AI research and improves efficiency and sustainability. The system offers over ten times more neuron capacity and up to 12 times higher performance than previous systems.
- September 2023 : SynSense launched the XyloIMU neuromorphic development kit for IMU-based motion processing applications, including human movement analysis and industrial monitoring. The kit integrates with Rockpool, SynSense’s open-source Python toolchain, allowing developers to train and deploy SNN models and fostering exploration of new use cases and research applications.
Table of Contents
![]() Exclusive indicates content/data unique to MarketsandMarkets and not available with any competitors.
Exclusive indicates content/data unique to MarketsandMarkets and not available with any competitors.
TITLE
PAGE NO
1
INTRODUCTION
23
2
RESEARCH METHODOLOGY
28
3
EXECUTIVE SUMMARY
42
4
PREMIUM INSIGHTS
46
5
MARKET OVERVIEW
Neuromorphic hardware revolutionizes AI with real-time processing, despite R&D and educational hurdles.
50
5.1
INTRODUCTION
5.2
MARKET DYNAMICS
5.2.1
DRIVERS
5.2.1.1
RISING ADOPTION OF NEUROMORPHIC HARDWARE
5.2.1.2
NEED FOR ALTERNATIVE APPROACHES TO ENHANCE COMPUTATIONAL POWER
5.2.1.3
GROWING APPLICATION OF AI AND ML
5.2.1.4
INCREASING DEMAND FOR REAL-TIME DATA PROCESSING AND DECISION-MAKING CAPABILITIES
5.2.2
RESTRAINTS
5.2.2.1
LACK OF R&D INVESTMENTS
5.2.2.2
COMPLEXITY OF ALGORITHMS
5.2.2.3
SHORTAGE OF EDUCATIONAL RESOURCES AND TRAINING OPPORTUNITIES
5.2.3
OPPORTUNITIES
5.2.3.1
ABILITY TO WITHSTAND HARSH CONDITIONS OF SPACE
5.2.3.2
INCREASING ADOPTION IN HEALTHCARE SECTOR
5.2.3.3
ABILITY TO AUTOMATE COMPLEX DECISION-MAKING PROCESSES IN CYBERSECURITY OPERATIONS
5.2.3.4
INTEGRATION OF NEUROPLASTICITY INTO NEUROMORPHIC COMPUTING
5.2.4
CHALLENGES
5.2.4.1
COMPLICATIONS ASSOCIATED WITH SOFTWARE DEVELOPMENT
5.2.4.2
COMPLEXITIES LINKED WITH DEVELOPING COMPUTATIONAL MODELS
5.3
TRENDS/DISRUPTIONS IMPACTING CUSTOMER BUSINESS
5.4
PRICING ANALYSIS
5.4.1
INDICATIVE PRICING OF KEY PLAYERS, BY OFFERING, 2023
5.4.2
AVERAGE SELLING PRICE TREND, BY REGION, 2020–2023
5.5
VALUE CHAIN ANALYSIS
5.6
ECOSYSTEM ANALYSIS
5.7
INVESTMENT AND FUNDING SCENARIO
5.8
TECHNOLOGY ANALYSIS
5.8.1
KEY TECHNOLOGIES
5.8.1.1
CONVOLUTIONAL NEURAL NETWORKS
5.8.1.2
RECURRENT NEURAL NETWORKS
5.8.1.3
SPIKING NEURAL NETWORKS
5.8.1.4
COMPUTE HARDWARE
5.8.1.5
IBM TRUENORTH
5.8.1.6
BRAINCHIP'S AKIDA
5.8.1.7
LOIHI 2
5.8.1.8
SPECK
5.8.1.9
DYNAPCNN
5.8.1.10
GROQ NORTHSTAR
5.8.2
COMPLEMENTARY TECHNOLOGIES
5.8.2.1
COMPUTATIONAL NEUROSCIENCE
5.8.3
ADJACENT TECHNOLOGIES
5.8.3.1
AI AND ML
5.9
PATENT ANALYSIS
5.10
TRADE ANALYSIS
5.10.1
IMPORT DATA (HS CODE 854231)
5.10.2
EXPORT DATA (HS CODE 854231)
5.11
KEY CONFERENCES AND EVENTS, 2025–2026
5.12
CASE STUDY ANALYSIS
5.12.1
INTEL LABS OFFERED LAVA NEUROMORPHIC FRAMEWORK TO CONCORDIA UNIVERSITY THAT OPTIMIZED HYPERPARAMETERS FOR LARGE SCALE PROBLEMS
5.12.2
INTEL LABS AND CORNELL UNIVERSITY COLLABORATED TO TRAIN INTEL'S LOIHI NEUROMORPHIC CHIP TO IDENTIFY HAZARDOUS CHEMICALS BASED ON THEIR SCENTS
5.12.3
TU/E AND NORTHWESTERN UNIVERSITY IMPLEMENTED NEUROMORPHIC BIOSENSORS CAPABLE OF ON-CHIP LEARNING THAT IMPROVED EFFICIENCY AND ACCURACY
5.13
REGULATORY LANDSCAPE
5.13.1
REGULATORY BODIES, GOVERNMENT AGENCIES, AND OTHER ORGANIZATIONS
5.13.2
REGULATORY STANDARDS
5.14
PORTER’S FIVE FORCES ANALYSIS
5.14.1
THREAT OF NEW ENTRANTS
5.14.2
THREAT OF SUBSTITUTES
5.14.3
BARGAINING POWER OF SUPPLIERS
5.14.4
BARGAINING POWER OF BUYERS
5.14.5
INTENSITY OF COMPETITIVE RIVALRY
5.15
KEY STAKEHOLDERS AND BUYING CRITERIA
5.15.1
KEY STAKEHOLDERS IN BUYING PROCESS
5.15.2
BUYING CRITERIA
6
NEUROMORPHIC COMPUTING MARKET, BY OFFERING
Market Size & Growth Rate Forecast Analysis to 2030 in USD Thousand and Units | 20 Data Tables
96
6.1
INTRODUCTION
6.2
PROCESSOR
6.2.1
RISING EMPHASIS ON BOOSTING ADOPTION OF ADAS TECHNOLOGIES TO DRIVE MARKET
6.3
MEMORY
6.3.1
HIGH EFFICIENCY AND LOW POWER CONSUMPTION TO FOSTER MARKET GROWTH
6.4
SENSOR
6.4.1
ABILITY TO DELIVER HIGH TEMPORAL RESOLUTIONS TO ACCELERATE DEMAND
6.5
SOFTWARE
6.5.1
GROWING DEMAND FOR EDGE DEVICES AND IOT SENSORS TO FUEL MARKET GROWTH
7
NEUROMORPHIC COMPUTING MARKET, BY DEPLOYMENT
Market Size & Growth Rate Forecast Analysis to 2030 in USD Thousand | 6 Data Tables
107
7.1
INTRODUCTION
7.2
EDGE
7.2.1
ABILITY TO HANDLE REAL-TIME DATA PROCESSING WITH LOW POWER REQUIREMENTS TO DRIVE MARKET
7.3
CLOUD
7.3.1
INCREASING COMPUTATIONAL NEEDS AND EMERGENCE OF CLOUD-NATIVE SOLUTIONS TO FUEL MARKET GROWTH
8
NEUROMORPHIC COMPUTING MARKET, BY APPLICATION
Market Size & Growth Rate Forecast Analysis to 2030 in USD Thousand | 18 Data Tables
112
8.1
INTRODUCTION
8.2
IMAGE AND VIDEO PROCESSING/COMPUTER VISION
8.2.1
GROWING EMPHASIS ON DEVELOPING SMART CITIES TO BOOST DEMAND
8.3
NATURAL LANGUAGE PROCESSING (NLP)
8.3.1
INCREASING DEMAND FOR REAL-TIME AND EFFICIENT LANGUAGE PROCESSING TO DRIVE MARKET
8.4
SENSOR FUSION
8.4.1
EXPANDING ROBOTICS INDUSTRY TO OFFER LUCRATIVE GROWTH OPPORTUNITIES
8.5
OTHER APPLICATIONS
9
NEUROMORPHIC COMPUTING MARKET, BY VERTICAL
Market Size & Growth Rate Forecast Analysis to 2030 in USD Thousand | 24 Data Tables
122
9.1
INTRODUCTION
9.2
CONSUMER ELECTRONICS
9.2.1
GROWING APPLICATION IN SMART HOMES AND SMARTPHONES TO DRIVE MARKET
9.3
AEROSPACE & DEFENSE
9.3.1
ABILITY TO ENHANCE SITUATIONAL AWARENESS AND TACTICAL DECISION-MAKING CAPABILITY TO FOSTER MARKET GROWTH
9.4
AUTOMOTIVE
9.4.1
INCREASING NEED TO PREVENT VEHICLE ACCIDENTS TO DRIVE MARKET
9.5
INDUSTRIAL
9.5.1
GROWING TREND OF INDUSTRY 4.0 TO ACCELERATE DEMAND
9.6
MEDICAL
9.6.1
RISING NEED FOR EXTENDED BATTERY LIFE IN IMPLANTABLE DEVICES TO BOOST DEMAND
9.7
IT & TELECOMMUNICATION
9.7.1
ROLLOUT OF 5G AND UPCOMING 6G NETWORK TO OFFER LUCRATIVE GROWTH OPPORTUNITIES
9.8
OTHER VERTICALS
10
END USES OF NEUROMORPHIC COMPUTING
137
10.1
INTRODUCTION
10.2
DRONES AND ROBOTICS
10.3
ADAS AND AUTONOMOUS VEHICLE
10.4
IOT
10.5
BRAIN-COMPUTER INTERFACE
10.6
OTHER END USES
11
NEUROMORPHIC COMPUTING MARKET, BY REGION
Comprehensive coverage of 9 Regions with country-level deep-dive of 12 Countries | 20 Data Tables.
141
11.1
INTRODUCTION
11.2
NORTH AMERICA
11.2.1
MACROECONOMIC OUTLOOK FOR NORTH AMERICA
11.2.2
US
11.2.2.1
GOVERNMENT-LED INITIATIVES TO BOOST NEUROMORPHIC ARCHITECTURE TO DRIVE MARKET
11.2.3
CANADA
11.2.3.1
RISING EMPHASIS ON AI RESEARCH TO FUEL MARKET GROWTH
11.2.4
MEXICO
11.2.4.1
SURGING FDIS TO OFFER LUCRATIVE GROWTH OPPORTUNITIES
11.3
EUROPE
11.3.1
MACROECONOMIC OUTLOOK FOR EUROPE
11.3.2
UK
11.3.2.1
RISING EMPHASIS ON DEVELOPING AND DEPLOYING AI-DRIVEN SOLUTIONS TO BOOST DEMAND
11.3.3
GERMANY
11.3.3.1
INCREASING EMPHASIS ON DIGITAL INNOVATION TO DRIVE MARKET
11.3.4
FRANCE
11.3.4.1
GROWING DEMAND AMONG HIGH-TECH INDUSTRIES TO FUEL MARKET GROWTH
11.3.5
ITALY
11.3.5.1
GROWING EMPHASIS ON INNOVATING ADVANCED SEMICONDUCTOR TECHNOLOGIES TO ACCELERATE DEMAND
11.3.6
SPAIN
11.3.6.1
PRESENCE OF STRONG RESEARCH INSTITUTIONS AND INNOVATION HUBS TO DRIVE DEMAND
11.3.7
REST OF EUROPE
11.4
ASIA PACIFIC
11.4.1
MACROECONOMIC OUTLOOK FOR ASIA PACIFIC
11.4.2
CHINA
11.4.2.1
INCREASING FOCUS ON ADVANCING AI AND NEXT-GENERATION COMPUTING TECHNOLOGIES TO FOSTER MARKET GROWTH
11.4.3
JAPAN
11.4.3.1
INCREASED ADOPTION IN ROBOTICS AND AUTOMATION SYSTEMS TO SPUR DEMAND
11.4.4
SOUTH KOREA
11.4.4.1
INCREASING FOCUS ON DEVELOPING CUTTING-EDGE BRAIN-INSPIRED SEMICONDUCTOR TECHNOLOGIES TO OFFER LUCRATIVE GROWTH OPPORTUNITIES
11.4.5
INDIA
11.4.5.1
INCREASING INITIATIVES TO BOOST SEMICONDUCTOR SECTOR TO DRIVE MARKET
11.4.6
REST OF ASIA PACIFIC
11.5
ROW
11.5.1
MACROECONOMIC OUTLOOK FOR ROW
11.5.2
MIDDLE EAST
11.5.2.1
DEVELOPMENT OF SMART CITIES TO DRIVE MARKET
11.5.2.2
GCC COUNTRIES
11.5.2.3
REST OF MIDDLE EAST
11.5.3
AFRICA
11.5.3.1
EXPANDING DATA CENTER INFRASTRUCTURE TO BOOST DEMAND
11.5.4
SOUTH AMERICA
11.5.4.1
INCREASING DEMAND FOR SMART AND MINIATURIZED TECHNOLOGY SOLUTIONS TO FUEL MARKET GROWTH
12
COMPETITIVE LANDSCAPE
Uncover strategic insights from key players' market dominance and emerging leaders' growth tactics.
170
12.1
OVERVIEW
12.2
KEY PLAYER STRATEGIES/RIGHT TO WIN, 2020–2024
12.3
REVENUE ANALYSIS, 2021–2023
12.4
MARKET SHARE ANALYSIS, 2023
12.5
COMPANY VALUATION AND FINANCIAL METRICS, 2024
12.6
BRAND/PRODUCT COMPARISON
12.7
COMPANY EVALUATION MATRIX: KEY PLAYERS, 2023
12.7.1
STARS
12.7.2
EMERGING LEADERS
12.7.3
PERVASIVE PLAYERS
12.7.4
PARTICIPANTS
12.7.5
COMPANY FOOTPRINT: KEY PLAYERS, 2023
12.7.5.1
COMPANY FOOTPRINT
12.7.5.2
REGION FOOTPRINT
12.7.5.3
OFFERING FOOTPRINT
12.7.5.4
DEPLOYMENT FOOTPRINT
12.7.5.5
APPLICATION FOOTPRINT
12.7.5.6
VERTICAL FOOTPRINT
12.8
COMPANY EVALUATION MATRIX: STARTUPS/SMES, 2023
12.8.1
PROGRESSIVE COMPANIES
12.8.2
RESPONSIVE COMPANIES
12.8.3
DYNAMIC COMPANIES
12.8.4
STARTING BLOCKS
12.8.5
COMPETITIVE BENCHMARKING: STARTUPS/SMES, 2023
12.8.5.1
DETAILED LIST OF KEY STARTUPS/SMES
12.8.5.2
COMPETITIVE BENCHMARKING OF KEY STARTUPS/SMES
12.9
COMPETITIVE SCENARIO
12.9.1
PRODUCT LAUNCHES
12.9.2
DEALS
12.9.3
OTHER DEVELOPMENTS
13
COMPANY PROFILES
In-depth Company Profiles of Leading Market Players with detailed Business Overview, Product and Service Portfolio, Recent Developments, and Unique Analyst Perspective (MnM View)
195
13.1
KEY PLAYERS
13.1.1
INTEL CORPORATION
13.1.1.1
BUSINESS OVERVIEW
13.1.1.2
PRODUCTS/SOLUTIONS/SERVICES OFFERED
13.1.1.3
RECENT DEVELOPMENTS
13.1.1.3.1
PRODUCT LAUNCHES
13.1.1.3.2
DEALS
13.1.1.4
MNM VIEW
13.1.1.4.1
KEY STRENGTHS/RIGHT TO WIN
13.1.1.4.2
STRATEGIC CHOICES
13.1.1.4.3
WEAKNESSES/COMPETITIVE THREATS
13.1.2
IBM
13.1.3
QUALCOMM TECHNOLOGIES, INC.
13.1.4
SAMSUNG ELECTRONICS CO., LTD.
13.1.5
SONY CORPORATION
13.1.6
BRAINCHIP, INC.
13.1.7
SYNSENSE
13.1.8
MEDIATEK INC.
13.1.9
NXP SEMICONDUCTORS
13.1.10
ADVANCED MICRO DEVICES, INC.
13.1.11
HEWLETT PACKARD ENTERPRISE DEVELOPMENT LP
13.1.12
OMNIVISION
13.2
OTHER PLAYERS
13.2.1
INNATERA NANOSYSTEMS BV
13.2.2
GENERAL VISION INC.
13.2.3
APPLIED BRAIN RESEARCH, INC.
13.2.4
NUMENTA
13.2.5
ASPINITY
13.2.6
NATURAL INTELLIGENCE
13.2.7
GRAI MATTER LABS
13.2.8
PROPHESEE.AI
13.2.9
MICROCHIP TECHNOLOGY INC.
13.2.10
MEMCOMPUTING, INC.
13.2.11
COGNIXION
13.2.12
NEUROPIXELS
13.2.13
SPINNCLOUD SYSTEMS
13.2.14
POLYN TECHNOLOGY
14
APPENDIX
251
14.1
DISCUSSION GUIDE
14.2
KNOWLEDGESTORE: MARKETSANDMARKETS’ SUBSCRIPTION PORTAL
14.3
CUSTOMIZATION OPTIONS
14.4
RELATED REPORTS
14.5
AUTHOR DETAILS
LIST OF TABLES
TABLE 1
NEUROMORPHIC COMPUTING MARKET: RISK ASSESSMENT
TABLE 2
INDICATIVE PRICING OF NEUROMORPHIC COMPUTING PRODUCTS OFFERED BY KEY PLAYERS, 2023 (USD)
TABLE 3
INDICATIVE PRICING OF NEUROMORPHIC COMPUTING PRODUCTS, 2023 (USD)
TABLE 4
AVERAGE SELLING PRICE TREND OF NEUROMORPHIC PROCESSORS, BY REGION, 2020–2023 (USD)
TABLE 5
AVERAGE SELLING PRICE TREND OF NEUROMORPHIC SENSORS, BY REGION, 2020–2023 (USD)
TABLE 6
AVERAGE SELLING PRICE TREND OF NEUROMORPHIC MEMORY, BY REGION, 2020–2023 (USD)
TABLE 7
ROLE OF KEY PLAYERS IN NEUROMORPHIC COMPUTING ECOSYSTEM
TABLE 8
PATENT REGISTRATIONS, 2024
TABLE 9
IMPORT DATA FOR HS CODE 847180-COMPLIANT PRODUCTS, BY COUNTRY, 2019–2023 (USD MILLION)
TABLE 10
EXPORT DATA FOR HS CODE 847180-COMPLIANT PRODUCTS, BY COUNTRY, 2019–2023 (USD MILLION)
TABLE 11
NEUROMORPHIC COMPUTING MARKET: KEY CONFERENCES AND EVENTS, 2025–2026
TABLE 12
NORTH AMERICA: REGULATORY BODIES, GOVERNMENT AGENCIES, AND OTHER ORGANIZATIONS
TABLE 13
EUROPE: REGULATORY BODIES, GOVERNMENT AGENCIES, AND OTHER ORGANIZATIONS
TABLE 14
ASIA PACIFIC: REGULATORY BODIES, GOVERNMENT AGENCIES, AND OTHER ORGANIZATIONS
TABLE 15
ROW: REGULATORY BODIES, GOVERNMENT AGENCIES, AND OTHER ORGANIZATIONS
TABLE 16
SAFETY STANDARDS FOR NEUROMORPHIC COMPUTING IN NORTH AMERICA
TABLE 17
SAFETY STANDARDS FOR NEUROMORPHIC COMPUTING IN EUROPE
TABLE 18
SAFETY STANDARDS FOR NEUROMORPHIC COMPUTING IN ASIA PACIFIC
TABLE 19
SAFETY STANDARDS FOR NEUROMORPHIC COMPUTING IN ROW
TABLE 20
NEUROMORPHIC COMPUTING MARKET: DEGREE OF COMPETITION
TABLE 21
INFLUENCE OF STAKEHOLDERS ON BUYING PROCESS FOR TOP THREE VERTICALS (%)
TABLE 22
KEY BUYING CRITERIA FOR TOP THREE VERTICALS
TABLE 23
NEUROMORPHIC COMPUTING MARKET, BY OFFERING, 2020–2023 (USD MILLION)
TABLE 24
NEUROMORPHIC COMPUTING MARKET, BY OFFERING, 2024–2030 (USD MILLION)
TABLE 25
OFFERING: NEUROMORPHIC COMPUTING MARKET, 2020–2023 (THOUSAND UNITS)
TABLE 26
OFFERING: NEUROMORPHIC COMPUTING MARKET, 2024–2030 (THOUSAND UNITS)
TABLE 27
PROCESSOR: NEUROMORPHIC COMPUTING MARKET, BY DEPLOYMENT, 2020–2023 (USD THOUSAND)
TABLE 28
PROCESSOR: NEUROMORPHIC COMPUTING MARKET, BY DEPLOYMENT, 2024–2030 (USD THOUSAND)
TABLE 29
PROCESSOR: NEUROMORPHIC COMPUTING MARKET, BY APPLICATION, 2020–2023 (USD THOUSAND)
TABLE 30
PROCESSOR: NEUROMORPHIC COMPUTING MARKET, BY APPLICATION, 2024–2030 (USD THOUSAND)
TABLE 31
MEMORY: NEUROMORPHIC COMPUTING MARKET, BY DEPLOYMENT, 2020–2023 (USD THOUSAND)
TABLE 32
MEMORY: NEUROMORPHIC COMPUTING MARKET, BY DEPLOYMENT, 2024–2030 (USD THOUSAND)
TABLE 33
MEMORY: NEUROMORPHIC COMPUTING MARKET, BY APPLICATION, 2020–2023 (USD THOUSAND)
TABLE 34
MEMORY: NEUROMORPHIC COMPUTING MARKET, BY APPLICATION, 2024–2030 (USD THOUSAND)
TABLE 35
SENSOR: NEUROMORPHIC COMPUTING MARKET, BY DEPLOYMENT, 2020–2023 (USD THOUSAND)
TABLE 36
SENSOR: NEUROMORPHIC COMPUTING MARKET, BY DEPLOYMENT, 2024–2030 (USD THOUSAND)
TABLE 37
SENSOR: NEUROMORPHIC COMPUTING MARKET, BY APPLICATION, 2020–2023 (USD THOUSAND)
TABLE 38
SENSOR: NEUROMORPHIC COMPUTING MARKET, BY APPLICATION, 2024–2030 (USD THOUSAND)
TABLE 39
SOFTWARE: NEUROMORPHIC COMPUTING MARKET, BY DEPLOYMENT, 2020–2023 (USD THOUSAND)
TABLE 40
SOFTWARE: NEUROMORPHIC COMPUTING MARKET, BY DEPLOYMENT, 2024–2030 (USD THOUSAND)
TABLE 41
SOFTWARE: NEUROMORPHIC COMPUTING MARKET, BY APPLICATION, 2020–2023 (USD THOUSAND)
TABLE 42
SOFTWARE: NEUROMORPHIC COMPUTING MARKET, BY APPLICATION, 2024–2030 (USD THOUSAND)
TABLE 43
NEUROMORPHIC COMPUTING MARKET, BY DEPLOYMENT, 2020–2023 (USD MILLION)
TABLE 44
NEUROMORPHIC COMPUTING MARKET, BY DEPLOYMENT, 2024–2030 (USD MILLION)
TABLE 45
EDGE: NEUROMORPHIC COMPUTING MARKET, BY OFFERING, 2020–2023 (USD THOUSAND)
TABLE 46
EDGE: NEUROMORPHIC COMPUTING MARKET, BY OFFERING, 2024–2030 (USD THOUSAND)
TABLE 47
CLOUD: NEUROMORPHIC COMPUTING MARKET, BY OFFERING, 2020–2023 (USD THOUSAND)
TABLE 48
CLOUD: NEUROMORPHIC COMPUTING MARKET, BY OFFERING, 2024–2030 (USD THOUSAND)
TABLE 49
NEUROMORPHIC COMPUTING MARKET, BY APPLICATION, 2020–2023 (USD THOUSAND)
TABLE 50
NEUROMORPHIC COMPUTING MARKET, BY APPLICATION, 2024–2030 (USD THOUSAND)
TABLE 51
IMAGE AND VIDEO PROCESSING/COMPUTER VISION: NEUROMORPHIC COMPUTING MARKET, BY OFFERING, 2020–2023 (USD THOUSAND)
TABLE 52
IMAGE AND VIDEO PROCESSING/COMPUTER VISION: NEUROMORPHIC COMPUTING MARKET, BY OFFERING, 2024–2030 (USD THOUSAND)
TABLE 53
IMAGE AND VIDEO PROCESSING/COMPUTER VISION: NEUROMORPHIC COMPUTING MARKET, BY VERTICAL, 2020–2023 (USD THOUSAND)
TABLE 54
IMAGE AND VIDEO PROCESSING/COMPUTER VISION: NEUROMORPHIC COMPUTING MARKET, BY VERTICAL, 2024–2030 (USD THOUSAND)
TABLE 55
NLP: NEUROMORPHIC COMPUTING MARKET, BY OFFERING, 2020–2023 (USD THOUSAND)
TABLE 56
NLP: NEUROMORPHIC COMPUTING MARKET, BY OFFERING, 2024–2030 (USD THOUSAND)
TABLE 57
NLP: NEUROMORPHIC COMPUTING MARKET, BY VERTICAL, 2020–2023 (USD THOUSAND)
TABLE 58
NLP: NEUROMORPHIC COMPUTING MARKET, BY VERTICAL, 2024–2030 (USD THOUSAND)
TABLE 59
SENSOR FUSION: NEUROMORPHIC COMPUTING MARKET, BY OFFERING, 2020–2023 (USD THOUSAND)
TABLE 60
SENSOR FUSION: NEUROMORPHIC COMPUTING MARKET, BY OFFERING, 2024–2030 (USD THOUSAND)
TABLE 61
SENSOR FUSION: NEUROMORPHIC COMPUTING MARKET, BY VERTICAL, 2020–2023 (USD THOUSAND)
TABLE 62
SENSOR FUSION: NEUROMORPHIC COMPUTING MARKET, BY VERTICAL, 2024–2030 (USD THOUSAND)
TABLE 63
OTHER APPLICATIONS: NEUROMORPHIC COMPUTING MARKET, BY OFFERING, 2020–2023 (USD THOUSAND)
TABLE 64
OTHER APPLICATIONS: NEUROMORPHIC COMPUTING MARKET, BY OFFERING, 2024–2030 (USD THOUSAND)
TABLE 65
OTHER VERTICALS: NEUROMORPHIC COMPUTING MARKET, 2020–2023 (USD THOUSAND)
TABLE 66
OTHER VERTICALS: NEUROMORPHIC COMPUTING MARKET, 2024–2030 (USD THOUSAND)
TABLE 67
NEUROMORPHIC COMPUTING MARKET, BY VERTICAL, 2020–2023 (USD MILLION)
TABLE 68
NEUROMORPHIC COMPUTING MARKET, BY VERTICAL, 2024–2030 (USD MILLION)
TABLE 69
CONSUMER ELECTRONICS: NEUROMORPHIC COMPUTING MARKET, BY APPLICATION, 2020–2023 (USD THOUSAND)
TABLE 70
CONSUMER ELECTRONICS: NEUROMORPHIC COMPUTING MARKET, BY APPLICATION, 2024–2030 (USD THOUSAND)
TABLE 71
CONSUMER ELECTRONICS: NEUROMORPHIC COMPUTING MARKET, BY REGION, 2020–2023 (USD THOUSAND)
TABLE 72
CONSUMER ELECTRONICS: NEUROMORPHIC COMPUTING MARKET, BY REGION, 2024–2030 (USD THOUSAND)
TABLE 73
AEROSPACE & DEFENSE: NEUROMORPHIC COMPUTING MARKET, BY APPLICATION, 2020–2023 (USD THOUSAND)
TABLE 74
AEROSPACE & DEFENSE: NEUROMORPHIC COMPUTING MARKET, BY APPLICATION, 2024–2030 (USD THOUSAND)
TABLE 75
AEROSPACE & DEFENSE: NEUROMORPHIC COMPUTING MARKET, BY REGION, 2020–2023 (USD THOUSAND)
TABLE 76
AEROSPACE & DEFENSE: NEUROMORPHIC COMPUTING MARKET, BY REGION, 2024–2030 (USD THOUSAND)
TABLE 77
AUTOMOTIVE: NEUROMORPHIC COMPUTING MARKET, BY APPLICATION, 2024–2030 (USD THOUSAND)
TABLE 78
AUTOMOTIVE: NEUROMORPHIC COMPUTING MARKET, BY REGION, 2024–2030 (USD THOUSAND)
TABLE 79
INDUSTRIAL: NEUROMORPHIC COMPUTING MARKET, BY APPLICATION, 2020–2023 (USD THOUSAND)
TABLE 80
INDUSTRIAL: NEUROMORPHIC COMPUTING MARKET, BY APPLICATION, 2024–2030 (USD THOUSAND)
TABLE 81
INDUSTRIAL: NEUROMORPHIC COMPUTING MARKET, BY REGION, 2020–2023 (USD THOUSAND)
TABLE 82
INDUSTRIAL: NEUROMORPHIC COMPUTING MARKET, BY REGION, 2024–2030 (USD THOUSAND)
TABLE 83
MEDICAL: NEUROMORPHIC COMPUTING MARKET, BY APPLICATION, 2024–2030 (USD THOUSAND)
TABLE 84
MEDICAL: NEUROMORPHIC COMPUTING MARKET, BY REGION, 2024–2030 (USD THOUSAND)
TABLE 85
IT & TELECOMMUNICATION: NEUROMORPHIC COMPUTING MARKET, BY APPLICATION, 2024–2030 (USD THOUSAND)
TABLE 86
IT & TELECOMMUNICATION: NEUROMORPHIC COMPUTING MARKET, BY REGION, 2024–2030 (USD THOUSAND)
TABLE 87
OTHER VERTICALS: NEUROMORPHIC COMPUTING MARKET, BY APPLICATION, 2020–2023 (USD THOUSAND)
TABLE 88
OTHER VERTICALS: NEUROMORPHIC COMPUTING MARKET, BY APPLICATION, BY COUNTRY, 2024–2030 (USD THOUSAND)
TABLE 89
OTHER VERTICALS: NEUROMORPHIC COMPUTING MARKET, BY REGION, 2020–2023 (USD THOUSAND)
TABLE 90
OTHER VERTICALS: NEUROMORPHIC COMPUTING MARKET, BY REGION, 2024–2030 (USD THOUSAND)
TABLE 91
NEUROMORPHIC COMPUTING MARKET, BY REGION, 2020–2023 (USD MILLION)
TABLE 92
NEUROMORPHIC COMPUTING MARKET, BY REGION, 2024–2030 (USD MILLION)
TABLE 93
NORTH AMERICA: NEUROMORPHIC COMPUTING MARKET, BY COUNTRY, 2020–2023 (USD THOUSAND)
TABLE 94
NORTH AMERICA: NEUROMORPHIC COMPUTING MARKET, BY COUNTRY, 2024–2030 (USD THOUSAND)
TABLE 95
NORTH AMERICA: NEUROMORPHIC COMPUTING MARKET, BY VERTICAL, 2020–2023 (USD THOUSAND)
TABLE 96
NORTH AMERICA: NEUROMORPHIC COMPUTING MARKET, BY VERTICAL, 2024–2030 (USD THOUSAND)
TABLE 97
EUROPE: NEUROMORPHIC COMPUTING MARKET, BY COUNTRY, 2020–2023 (USD THOUSAND)
TABLE 98
EUROPE: NEUROMORPHIC COMPUTING MARKET, BY COUNTRY, 2024–2030 (USD THOUSAND)
TABLE 99
EUROPE: NEUROMORPHIC COMPUTING MARKET, BY VERTICAL, 2020–2023 (USD THOUSAND)
TABLE 100
EUROPE: NEUROMORPHIC COMPUTING MARKET, BY VERTICAL, 2024–2030 (USD THOUSAND)
TABLE 101
ASIA PACIFIC: NEUROMORPHIC COMPUTING MARKET, BY COUNTRY, 2020–2023 (USD MILLION)
TABLE 102
ASIA PACIFIC: NEUROMORPHIC COMPUTING MARKET, BY COUNTRY, 2024–2030 (USD MILLION)
TABLE 103
ASIA PACIFIC: NEUROMORPHIC COMPUTING MARKET, BY VERTICAL, 2020–2023 (USD THOUSAND)
TABLE 104
ASIA PACIFIC: NEUROMORPHIC COMPUTING MARKET, BY VERTICAL, 2024–2030 (USD THOUSAND)
TABLE 105
ROW: NEUROMORPHIC COMPUTING MARKET, BY REGION, 2020–2023 (USD THOUSAND)
TABLE 106
ROW: NEUROMORPHIC COMPUTING MARKET, BY REGION, 2024–2030 (USD THOUSAND)
TABLE 107
ROW: NEUROMORPHIC COMPUTING MARKET, BY VERTICAL, 2020–2023 (USD THOUSAND)
TABLE 108
ROW: NEUROMORPHIC COMPUTING MARKET, BY VERTICAL, 2024–2030 (USD THOUSAND)
TABLE 109
MIDDLE EAST: NEUROMORPHIC COMPUTING MARKET, BY COUNTRY, 2020–2023 (USD THOUSAND)
TABLE 110
MIDDLE EAST: NEUROMORPHIC COMPUTING MARKET, BY COUNTRY, 2024–2030 (USD THOUSAND)
TABLE 111
NEUROMORPHIC COMPUTING MARKET: OVERVIEW OF STRATEGIES ADOPTED BY KEY PLAYERS, 2020–2024
TABLE 112
NEUROMORPHIC COMPUTING MARKET: DEGREE OF COMPETITION, 2023
TABLE 113
NEUROMORPHIC COMPUTING MARKET: REGION FOOTPRINT
TABLE 114
NEUROMORPHIC COMPUTING MARKET: OFFERING FOOTPRINT
TABLE 115
NEUROMORPHIC COMPUTING MARKET: DEPLOYMENT FOOTPRINT
TABLE 116
NEUROMORPHIC COMPUTING MARKET: APPLICATION FOOTPRINT
TABLE 117
NEUROMORPHIC COMPUTING MARKET: VERTICAL FOOTPRINT
TABLE 118
NEUROMORPHIC COMPUTING MARKET: LIST OF KEY STARTUPS/SMES
TABLE 119
NEUROMORPHIC COMPUTING MARKET: COMPETITIVE BENCHMARKING OF KEY STARTUPS/SMES
TABLE 120
NEUROMORPHIC COMPUTING MARKET: PRODUCT LAUNCHES, JANUARY 2020–JANUARY 2025
TABLE 121
NEUROMORPHIC COMPUTING MARKET: DEALS, JANUARY 2020–JANUARY 2025
TABLE 122
NEUROMORPHIC COMPUTING MARKET: OTHER DEVELOPMENTS, JANUARY 2020–JANUARY 2025
TABLE 123
INTEL CORPORATION: COMPANY OVERVIEW
TABLE 124
INTEL CORPORATION: PRODUCTS/SOLUTIONS/SERVICES OFFERED
TABLE 125
INTEL CORPORATION: PRODUCT LAUNCHES
TABLE 126
INTEL CORPORATION: DEALS
TABLE 127
IBM: COMPANY OVERVIEW
TABLE 128
IBM: PRODUCTS/SOLUTIONS/SERVICES OFFERED
TABLE 129
IBM: PRODUCT LAUNCHES
TABLE 130
IBM: DEALS
TABLE 131
QUALCOMM TECHNOLOGIES, INC.: COMPANY OVERVIEW
TABLE 132
QUALCOMM TECHNOLOGIES, INC.: PRODUCTS/SOLUTIONS/SERVICES OFFERED
TABLE 133
QUALCOMM TECHNOLOGIES, INC.: DEALS
TABLE 134
QUALCOMM TECHNOLOGIES, INC.: OTHER DEVELOPMENTS
TABLE 135
SAMSUNG ELECTRONICS CO., LTD.: COMPANY OVERVIEW
TABLE 136
SAMSUNG ELECTRONICS CO., LTD.: PRODUCTS/SOLUTIONS/SERVICES OFFERED
TABLE 137
SAMSUNG ELECTRONICS CO., LTD.: PRODUCT LAUNCHES
TABLE 138
SAMSUNG ELECTRONICS CO., LTD.: DEALS
TABLE 139
SONY CORPORATION: COMPANY OVERVIEW
TABLE 140
SONY CORPORATION: PRODUCTS/SOLUTIONS/SERVICES OFFERED
TABLE 141
BRAINCHIP, INC.: COMPANY OVERVIEW
TABLE 142
BRAINCHIP, INC.: PRODUCTS/SOLUTIONS/SERVICES OFFERED
TABLE 143
BRAINCHIP, INC.: PRODUCT LAUNCHES
TABLE 144
BRAINCHIP, INC.: DEALS
TABLE 145
BRAINCHIP, INC.: OTHER DEVELOPMENTS
TABLE 146
SYNSENSE: COMPANY OVERVIEW
TABLE 147
SYNSENSE: PRODUCTS/SOLUTIONS/SERVICES OFFERED
TABLE 148
SYNSENSE: PRODUCT LAUNCHES
TABLE 149
SYNSENSE: DEALS
TABLE 150
MEDIATEK INC.: COMPANY OVERVIEW
TABLE 151
MEDIATEK INC.: PRODUCTS/SOLUTIONS/SERVICES OFFERED
TABLE 152
NXP SEMICONDUCTORS: COMPANY OVERVIEW
TABLE 153
NXP SEMICONDUCTORS: PRODUCTS/SOLUTIONS/SERVICES OFFERED
TABLE 154
NXP SEMICONDUCTORS: PRODUCT LAUNCHES
TABLE 155
NXP SEMICONDUCTORS: DEALS
TABLE 156
ADVANCED MICRO DEVICES, INC.: COMPANY OVERVIEW
TABLE 157
ADVANCED MICRO DEVICES, INC.: PRODUCTS/SOLUTIONS/SERVICES OFFERED
TABLE 158
ADVANCED MICRO DEVICES, INC.: PRODUCT LAUNCHES
TABLE 159
ADVANCED MICRO DEVICES, INC.: DEALS
TABLE 160
HEWLETT PACKARD ENTERPRISE DEVELOPMENT LP: COMPANY OVERVIEW
TABLE 161
HEWLETT PACKARD ENTERPRISE DEVELOPMENT LP: PRODUCTS/SOLUTIONS/SERVICES OFFERED
TABLE 162
HEWLETT PACKARD ENTERPRISE DEVELOPMENT LP: PRODUCT LAUNCHES
TABLE 163
HEWLETT PACKARD ENTERPRISE DEVELOPMENT LP: DEALS
TABLE 164
OMNIVISION: COMPANY OVERVIEW
TABLE 165
OMNIVISION: PRODUCTS/SOLUTIONS/SERVICES OFFERED
TABLE 166
OMNIVISION: PRODUCT LAUNCHES
TABLE 167
OMNIVISION: DEALS
LIST OF FIGURES
FIGURE 1
NEUROMORPHIC COMPUTING MARKET SEGMENTATION AND REGIONAL SCOPE
FIGURE 2
NEUROMORPHIC COMPUTING MARKET: RESEARCH DESIGN
FIGURE 3
NEUROMORPHIC COMPUTING MARKET: RESEARCH FLOW OF MARKET SIZE ESTIMATION
FIGURE 4
NEUROMORPHIC COMPUTING MARKET: SUPPLY-SIDE ANALYSIS
FIGURE 5
NEUROMORPHIC COMPUTING MARKET: BOTTOM-UP APPROACH
FIGURE 6
NEUROMORPHIC COMPUTING MARKET: TOP-DOWN APPROACH
FIGURE 7
NEUROMORPHIC COMPUTING MARKET: DATA TRIANGULATION
FIGURE 8
PROCESSOR SEGMENT TO ACCOUNT FOR LARGEST MARKET SHARE IN 2030
FIGURE 9
EDGE SEGMENT TO DOMINATE MARKET IN 2030
FIGURE 10
IMAGE AND VIDEO PROCESSING/COMPUTER VISION SEGMENT TO ACCOUNT FOR LARGEST MARKET SHARE IN 2030
FIGURE 11
CONSUMER ELECTRONICS SEGMENT TO DOMINATE MARKET IN 2024
FIGURE 12
NORTH AMERICA HELD LARGEST MARKET SHARE IN 2023
FIGURE 13
RISING DEMAND FOR NEUROMORPHIC COMPUTING IN AUTOMOTIVE INDUSTRY TO DRIVE MARKET
FIGURE 14
SOFTWARE SEGMENT TO EXHIBIT HIGHEST CAGR DURING FORECAST PERIOD
FIGURE 15
CLOUD SEGMENT TO RECORD HIGHER CAGR DURING FORECAST PERIOD
FIGURE 16
IMAGE AND VIDEO PROCESSING/COMPUTER VISION SEGMENT TO DOMINATE MARKET IN 2030
FIGURE 17
CONSUMER ELECTRONICS TO ACCOUNT FOR LARGEST MARKET SHARE IN 2030
FIGURE 18
CHINA TO EXHIBIT HIGHEST CAGR IN GLOBAL NEUROMORPHIC COMPUTING MARKET DURING FORECAST PERIOD
FIGURE 19
ASIA PACIFIC TO RECORD HIGHEST CAGR IN NEUROMORPHIC COMPUTING MARKET DURING FORECAST PERIOD
FIGURE 20
NEUROMORPHIC COMPUTING MARKET: DRIVERS, RESTRAINTS, OPPORTUNITIES, AND CHALLENGES
FIGURE 21
NEUROMORPHIC COMPUTING MARKET: IMPACT ANALYSIS OF DRIVERS
FIGURE 22
NEUROMORPHIC COMPUTING MARKET: IMPACT ANALYSIS OF RESTRAINTS
FIGURE 23
NEUROMORPHIC COMPUTING MARKET: IMPACT ANALYSIS OF OPPORTUNITIES
FIGURE 24
NEUROMORPHIC COMPUTING MARKET: IMPACT ANALYSIS OF CHALLENGES
FIGURE 25
TRENDS/DISRUPTIONS IMPACTING CUSTOMER BUSINESS
FIGURE 26
INDICATIVE PRICING OF OFFERINGS OF KEY PLAYERS, 2023
FIGURE 27
AVERAGE SELLING PRICE TREND OF NEUROMORPHIC PROCESSORS, BY REGION, 2020–2023
FIGURE 28
AVERAGE SELLING PRICE TREND OF NEUROMORPHIC SENSORS, BY REGION, 2020–2023
FIGURE 29
AVERAGE SELLING PRICE TREND OF NEUROMORPHIC MEMORY, BY REGION, 2020–2023
FIGURE 30
NEUROMORPHIC COMPUTING MARKET: VALUE CHAIN ANALYSIS
FIGURE 31
NEUROMORPHIC COMPUTING ECOSYSTEM
FIGURE 32
FUNDS AUTHORIZED FOR NEUROMORPHIC COMPUTING STARTUPS
FIGURE 33
PATENTS APPLIED AND GRANTED, 2014–2024
FIGURE 34
IMPORT DATA OF HS CODE 854231-COMPLIANT PRODUCTS, BY COUNTRY, 2019–2023 (USD MILLION)
FIGURE 35
EXPORT DATA OF HS CODE 854231-COMPLIANT PRODUCTS, BY COUNTRY, 2019–2023 (USD MILLION)
FIGURE 36
NEUROMORPHIC COMPUTING MARKET: PORTER’S FIVE FORCES ANALYSIS
FIGURE 37
INFLUENCE OF STAKEHOLDERS ON BUYING PROCESS FOR TOP THREE VERTICALS
FIGURE 38
KEY BUYING CRITERIA FOR TOP THREE VERTICALS
FIGURE 39
SOFTWARE SEGMENT TO EXHIBIT HIGHEST CAGR DURING FORECAST PERIOD
FIGURE 40
CLOUD SEGMENT TO RECORD HIGHEST CAGR DURING FORECAST PERIOD
FIGURE 41
IMAGE AND VIDEO PROCESSING/COMPUTER VISION SEGMENT TO REGISTER HIGHEST CAGR DURING FORECAST PERIOD
FIGURE 42
CONSUMER ELECTRONICS SEGMENT TO ACCOUNT FOR LARGEST MARKET SHARE IN 2024
FIGURE 43
ASIA PACIFIC TO RECORD HIGHEST CAGR DURING FORECAST PERIOD
FIGURE 44
NORTH AMERICA: NEUROMORPHIC COMPUTING MARKET SNAPSHOT
FIGURE 45
CANADA TO GROW AT HIGHEST CAGR DURING FORECAST PERIOD
FIGURE 46
EUROPE: NEUROMORPHIC COMPUTING MARKET SNAPSHOT
FIGURE 47
ITALY TO REGISTER HIGHEST CAGR DURING FORECAST PERIOD
FIGURE 48
ASIA PACIFIC: NEUROMORPHIC COMPUTING MARKET SNAPSHOT
FIGURE 49
CHINA TO RECORD HIGHEST CAGR DURING FORECAST PERIOD
FIGURE 50
ROW: NEUROMORPHIC COMPUTING MARKET SNAPSHOT
FIGURE 51
MIDDLE EAST TO RECORD HIGHEST CAGR DURING FORECAST PERIOD
FIGURE 52
NEUROMORPHIC COMPUTING MARKET: REVENUE ANALYSIS OF FIVE KEY PLAYERS, 2021–2023
FIGURE 53
NEUROMORPHIC COMPUTING MARKET: SHARE OF KEY PLAYERS, 2023
FIGURE 54
NEUROMORPHIC COMPUTATION MARKET: COMPANY VALUATION
FIGURE 55
NEUROMORPHIC COMPUTATION MARKET: FINANCIAL METRICS
FIGURE 56
BRAND/PRODUCT COMPARISON OF MAJOR COMPANIES
FIGURE 57
NEUROMORPHIC COMPUTING MARKET: COMPANY EVALUATION MATRIX (KEY PLAYERS), 2023
FIGURE 58
NEUROMORPHIC COMPUTING MARKET: COMPANY FOOTPRINT
FIGURE 59
NEUROMORPHIC COMPUTING MARKET: COMPANY EVALUATION MATRIX (STARTUPS/SMES), 2023
FIGURE 60
INTEL CORPORATION: COMPANY SNAPSHOT
FIGURE 61
IBM: COMPANY SNAPSHOT
FIGURE 62
QUALCOMM TECHNOLOGIES, INC.: COMPANY SNAPSHOT
FIGURE 63
SAMSUNG ELECTRONICS CO., LTD.: COMPANY SNAPSHOT
FIGURE 64
SONY CORPORATION: COMPANY SNAPSHOT
FIGURE 65
BRAINCHIP, INC.: COMPANY SNAPSHOT
FIGURE 66
MEDIATEK INC.: COMPANY SNAPSHOT
FIGURE 67
NXP SEMICONDUCTORS: COMPANY SNAPSHOT
FIGURE 68
ADVANCED MICRO DEVICES, INC.: COMPANY SNAPSHOT
FIGURE 69
HEWLETT PACKARD ENTERPRISE DEVELOPMENT LP: COMPANY SNAPSHOT
Methodology
The research process for this technical, market-oriented, and commercial study of the neuromorphic computing market included the systematic gathering, recording, and analysis of data about companies operating in the market. It involved the extensive use of secondary sources, directories, and databases (Factiva, Oanda, and OneSource) to identify and collect relevant information. In-depth interviews were conducted with various primary respondents, including experts from core and related industries and preferred manufacturers, to obtain and verify critical qualitative and quantitative information as well as to assess the growth prospects of the market. Key players in the neuromorphic computing market were identified through secondary research, and their market rankings were determined through primary and secondary research. This included studying annual reports of top players and interviewing key industry experts, such as CEOs, directors, and marketing executives.
Secondary Research
In the secondary research process, various secondary sources were used to identify and collect information for this study. These include annual reports, press releases, and investor presentations of companies, whitepapers, certified publications, and articles from recognized associations and government publishing sources. Research reports from a few consortiums and councils were also consulted to structure qualitative content. Secondary sources included corporate filings (such as annual reports, investor presentations, and financial statements); trade, business, and professional associations; white papers; Journals and certified publications; articles by recognized authors; gold-standard and silver-standard websites; directories; and databases. Data was also collected from secondary sources, such as the International Trade Centre (ITC) (Switzerland), and the International Monetary Fund (IMF).
List of key secondary sources
|
Source |
Web Link |
|
IEEE |
|
|
U.S. Department of Energy |
|
|
Open Neuromorphic |
|
|
IOPscience |
|
|
NIST |
|
|
Data Science Association |
|
|
Sandia National Laboratories |
|
|
National Library of Medicine |
|
|
Los Alamos National Laboratory |
Primary Research
Extensive primary research was accomplished after understanding and analyzing the neuromorphic computing market scenario through secondary research. Several primary interviews were conducted with key opinion leaders from both demand- and supply-side vendors across four major regions—North America, Europe, Asia Pacific, and RoW. Approximately 30% of the primary interviews were conducted with the demand side, and 70% with the supply side. Primary data was collected through questionnaires, emails, and telephonic interviews. Various departments within organizations, such as sales, operations, and administration, were contacted to provide a holistic viewpoint in the report.
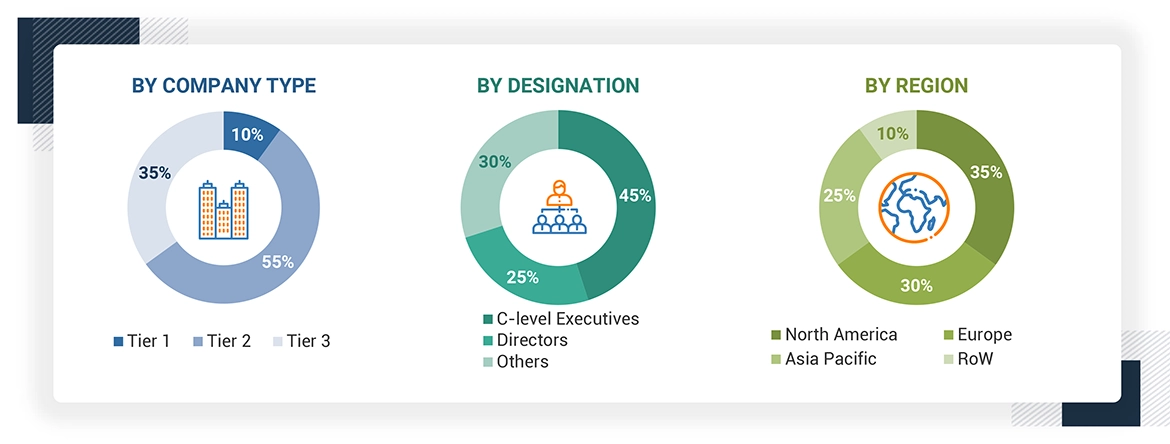
Note: Other designations include technology heads, media analysts, sales managers, marketing managers, and product managers.
The three tiers of the companies are based on their total revenues as of 2023 ? Tier 1: >USD 1 billion, Tier 2: USD 500 million–1 billion, and Tier 3: USD 500 million.
About the assumptions considered for the study, To know download the pdf brochure
Market Size Estimation
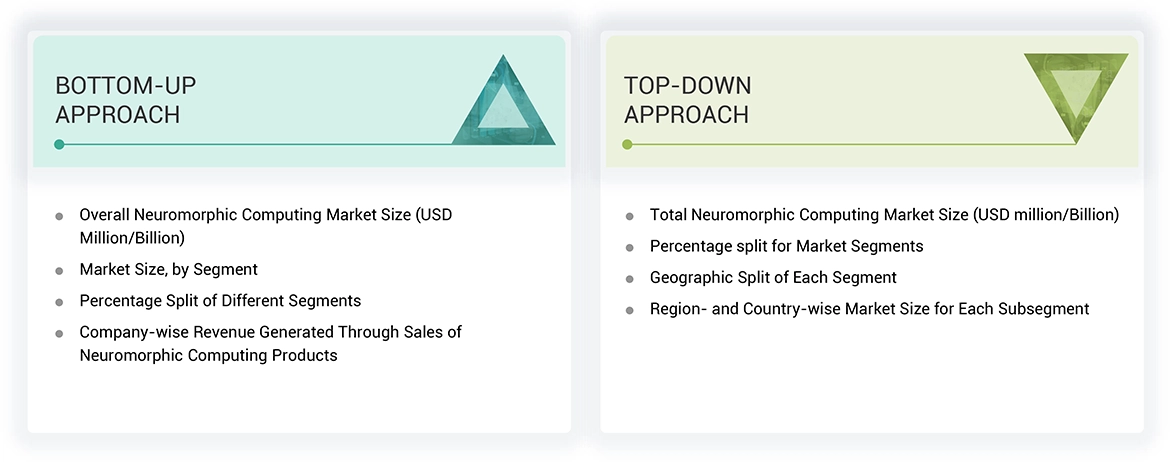
In the complete market engineering process, both top-down and bottom-up approaches were used, along with several data triangulation methods, to estimate and forecast the size of the market and its segments and subsegments listed in the report. Extensive qualitative and quantitative analyses were carried out on the complete market engineering process to list the key information/insights pertaining to neuromorphic computing market.
The key players in the market were identified through secondary research, and their rankings in the respective regions determined through primary and secondary research. This entire procedure involved the study of the annual and financial reports of top players, and interviews with industry experts such as chief executive officers, vice presidents, directors, and marketing executives for quantitative and qualitative key insights. All percentage shares, splits, and breakdowns were determined using secondary sources and verified through primary sources. All parameters that affect the markets covered in this research study were accounted for, viewed in extensive detail, verified through primary research, and analyzed to obtain the final quantitative and qualitative data. This data was consolidated, supplemented with detailed inputs and analysis from MarketsandMarkets, and presented in this report.
Bottom-Up Approach
- Identifying various verticals of neuromorphic computing
- Analyzing the penetration of each type of neuromorphic computing technology through secondary and primary research
- Analyzing the penetration of neuromorphic computing for different applications and verticals through secondary and primary research
- Conducting multiple discussion sessions with key opinion leaders to understand the detailed working of neuromorphic computing and their implementation in multiple applications; this helped analyze the break-up of the scope of work carried out by each major company
- Verifying and cross-checking the estimates at every level with key opinion leaders, including CEOs, directors, operation managers, and finally with MarketsandMarkets domain experts
- Studying various paid and unpaid sources of information, such as annual reports, press releases, white papers, and databases
Top-Down Approach
- Focusing initially on the top-line investments and expenditures being made in the ecosystem of the neuromorphic computing market; further, splitting the key market areas based on offering, deployment, application, vertical, and region, and listing the key developments
- Identifying all leading players and applications in the neuromorphic computing market based on region through secondary research and thoroughly verifying them through a brief discussion with industry experts
- Analyzing revenues, product mix, geographic presence, and key applications served by all identified players to estimate and arrive at percentage splits for all key segments
- Discussing splits with the industry experts to validate the information and identify key growth pockets across all key segments
- Breaking down the total market based on verified splits and key growth pockets across all segments
Neuromorphic Computing Market : Top-Down and Bottom-Up Approach
Data Triangulation
After arriving at the overall market size from the market size estimation process explained above, the total market was split into several segments and subsegments. Data triangulation and market breakdown procedures were employed, wherever applicable, to complete the overall market engineering process and arrive at the exact statistics for all segments and subsegments. The data was triangulated by studying various factors and trends from both demand and supply sides. Along with this, the market size was validated using both top-down and bottom-up approaches.
Market Definition
Neuromorphic computing is a cutting-edge approach to designing computing systems that mimic the structure and functioning of the human brain's neural networks. It involves the development of hardware and software that replicate the way neurons communicate and process information, using specialized architectures like spiking neural networks (SNNs). Neuromorphic systems are highly energy-efficient, capable of real-time learning, and can process complex sensory data, such as images and sounds, with minimal power consumption. This technology is used in applications ranging from AI and robotics to healthcare, autonomous vehicles, and edge computing. These are used across various industries like consumer electronics, aerospace & defense, automotive, industrial, medical, IT & telecommunication, others.
Key Stakeholders
- Neuromorphic computing device manufacturers
- Research organizations and universities
- Original equipment manufacturers (OEMs)
- Technology standard organizations, forums, alliances, and associations
- Analysts and strategic business planners
- Government bodies, venture capitalists, and private equity firms
- Existing and prospective end users
- Venture capitalists, private equity firms, and startup companies
- Distributors and traders
Report Objectives
- To define, describe, segment, and forecast the neuromorphic computing market size, in terms of value, based on offering, deployment, application, vertical, and region
- To forecast the market size, in terms of value, across North America, Europe, Asia Pacific, and the Rest of the World (RoW)
- To present detailed information regarding the major factors influencing the growth of the market (drivers, restraints, opportunities, and challenges)
- To provide an ecosystem analysis, case study analysis, patent analysis, technology analysis, ASP analysis, Porter’s Five Forces analysis, investment and funding scenario, and regulations pertaining to the market.
- To offer a comprehensive overview of the value chain of the neuromorphic computing market ecosystem
- To critically analyze micromarkets1 with respect to individual growth trends, prospects, and contributions to the total market
- To strategically profile the key players and comprehensively analyze their market shares and core competencies
- To assess the opportunities in the market for stakeholders and describe the competitive landscape of the market
- To analyze competitive developments in the market, such as collaborations, agreements, partnerships, product developments, and research and development (R&D)
Available Customizations
With the given market data, MarketsandMarkets offers customizations according to the company’s specific needs. The following customization options are available for the report:
Company Information
- Detailed analysis and profiling of additional market players (up to 7)
Key Questions Addressed by the Report
What is the neuromorphic computing market's major driving factors and opportunities?
The major driving factors for neuromorphic computing market include its energy efficiency, real-time processing, and growing demand in AI, edge computing, and healthcare. Key opportunities lie in autonomous vehicles, IoT devices, medical diagnostics, and brain-computer interfaces.
Which region is expected to hold the highest market share?
Asia Pacific commands a larger share of the neuromorphic computing market. The expanding industrial sector and different industries demand is driving the adoption of neuromorphic computing in the Asia Pacific market.
Who are the leading players in the global neuromorphic computing market?
Leading players operating in the neuromorphic computing market are Intel Corporation (US), IBM (US), Qualcomm Technologies, Inc. (US), Samsung Electronics Co., Ltd. (South Korea), Sony Corporation (Japan), and many more.
What are some of the technological advancements in the market?
Computational neuroscience, neuromorphic engineering, and integration of AI and ML are major technological advancements. Edge computing is another advancement which is expected to drive neuromorphic computing market growth.
What is the size of the global neuromorphic computing market?
The global neuromorphic computing market is expected to be valued at USD 28.5 million in 2024 and is projected to reach USD 1325.2 million by 2030, growing at a CAGR of 89.7% from 2024-2030.
Which companies are pioneering hardware solutions in neuromorphic computing that enable fast and adaptive learning systems for complex applications?
IBM neuromorphic chips and Intel neuromorphic processors are designed to handle complex learning tasks for applications in AI, robotics, and autonomous systems.
Need a Tailored Report?
Customize this report to your needs
Get 10% FREE Customization
Customize This Report
Fact checked
Personalize This Research
- Triangulate with your Own Data
- Get Data as per your Format and Definition
- Gain a Deeper Dive on a Specific Application, Geography, Customer or Competitor
- Any level of Personalization
Let Us Help You
- What are the Known and Unknown Adjacencies Impacting the Neuromorphic Computing Market
- What will your New Revenue Sources be?
- Who will be your Top Customer; what will make them switch?
- Defend your Market Share or Win Competitors
- Get a Scorecard for Target Partners

Custom Market Research Services
We Will Customise The Research For You, In Case The Report Listed Above Does Not Meet With Your Requirements
Get 10% Free CustomisationTESTIMONIALS

Tetsuya Ohhira
Business Development Manager-Technology Business
Nikon Corporation,
Leading Japanese MNC specializing in optics and imaging productswww.nikon.com
MarketsandMarkets™ response
is quick. Their attitude is flexible and positive. Analyst Insights are globally considered and
significant. Client Services quickly respond to our inquiry and demand. Their wide range of global
surveys help us make our strategic plan.
We hope Knowledge Store will be easier to search
for a report.
VP - Marketing & Business Development
Leading Provider of Process Control Solutions
We engaged with MarketsandMarkets on a study to perform an analysis and recommend a Go-To-Market strategy for metrology and process control in the semiconductor market. The study was tailored to our targets and needs with well-defined milestones. Our overall experience with the MarketsandMarkets team was very good throughout the project in all aspects including the analysis methodologies used, the quality and depth of primary and secondary data sets, the professionalism and flexibility of the team and the ability to meet the target schedule and milestones. We want to thank MarketsandMarkets team for a job well done.


Growth opportunities and latent adjacency in Neuromorphic Computing Market