[267 Pages Report] The global cancer biomarkers market is accounted for USD 10.31 billion in 2016 and is expected to grow at a CAGR of 12.2% to USD 20.48 billion by 2022 during the forecast period. Cancer biomarkers are substances or processes that are indicative of the presence of cancers in the human body. Biomarkers may be produced by the cancer tissue itself or by other cells in the body in response to cancer. They can be found in the blood, stool, urine, tumor tissue, or other tissues or bodily fluids. They enhance cancer detection and facilitate high-speed noninvasive diagnosis using Genomics and proteomics.
The genetic biomarker segment is projected to register the highest during the forecast period. The growth of this market segment is driven by advancement of technologies for mutation detection. Next-generation sequencing (NGS), gene expression profiling (microarray), and polymerase chain reaction (PCR) are the major technologies used for genetic biomarker discovery and diagnosis. Advancements in high-throughput technologies are the major factors driving the genetic biomarkers market. Over the years, key players in the market have launched several technologically-advanced products, which have enhanced the speed and accuracy of genetic biomarker discovery and diagnosis.
Lung cancer segment is projected to register a higher CAGR during the forecast period. The growth of the automated blood collection segment can be attributed to the increase in the number of new lung cancer cases. Increasing company focus on research on lung cancer biomarkers is another key driver for this market. Increased understanding of the morphology of lung carcinogenesis, development of high-throughput techniques for biomarker discovery, and increased focus on early detection of cancer are also propelling the growth of this market
Bioinformatics helps in the identification of more powerful and biomedically meaningful biomarkers. Data mining also offers tools for the interpretation and evaluation of the resulting models and predictions as well as the methods for supporting the implementation of prediction explanation mechanisms. This is resulting in growth of this segment. Further, technological advancements, increase in demand for the development of new drugs and clinical diagnostic tests, and the growing information technology industry in emerging countries, such as India and China are the driving the bioinformatics applications in biomarker discovery and development.
Biomarker-enabled drug discovery facilitates a better understanding of diseases during target discovery. It plays a significant role in guiding decisions in every phase of drug developmentfrom drug discovery and preclinical evaluations to clinical trialsand has therefore become an important tool in developing effective drugs. The use of biomarkers helps confirm the efficacy and safety of drug candidates, understand their mechanisms of action, and determine an efficacious dose regime. This is resulting in growth of this segment.
Growth in the developed markets of North America and Europe is primarily driven by the high adoption of advanced technologies like NGS, increasing number of research studies for the discovery and development of novel biomarkers, presence of a large number of pharmaceutical companies, rising funding and investments from public and private organizations, and increasing use of biomarkers in patient stratification and drug development process.
Over the last few years, fields, such as diagnostic imaging, immunoassays, omics technologies, and bioinformatics have witnessed significant technological advancements. Moreover, several companies operating in the diagnostic imaging market are focusing on developing technologically-advanced equipment that are more economical, provide better patient safety, and are easy to use.
Advancements in omics technologies enable faster acquisition of genomic, proteomic, and metabolomic data, and its integration with clinical trial data using advanced bioinformatics software. The omics revolution in the last decade has increased the applications of biomarkers in biomedical research. Also, developments in high-throughput genomic technologies are facilitating the identification and analysis of mutations and polymorphisms in key genes, thus expanding the spectrum of available genomic biomarkers. For instance, researchers at the Mayo Clinic have identified the role of mutations in the SPOP gene on the development of resistance to BET. With these advancements, the number of available genomic biomarkers for the detection of cancer is expected to increase..
Many epidemiology studies use biomarkers to investigate different stages of diseases in humans. This requires careful handling and storage of precious biological samples for obtaining a large amount of information from limited samples and minimizing future research costs through the use of banked samples. Sample collection is thus one of the key issues for service providers, followed by the access to these samples. A stringent quality control of these samples is required and they need to be stored under the right conditions to avoid any loss. Also, different samples are required for risk detection, screening, diagnosis, and monitoring processes.
The validity of results from biomarkers studies using archived specimens depends on the integrity of specimens and the manner in which they are collected, processed, and stored. Apart from the maintenance of samples, specimen banks have to be structured so that all elements of patient rights, privacy, and confidentiality are addressed with an informed consent that is thorough and addresses the potential use of samples. Furthermore, detailed tracking, specimen storage, and retrieval software are required for proper sample handling and management. These issues are expected to hinder the growth of the overall cancer biomarkers market.
Over the years, the popularity of personalized medicine has increased, due to limitations of standard diagnosis and treatment. Different fields of medicine, from cancer to psychiatry, are heading towards tailored treatments for each patient on the basis of his/her biological and clinical characteristics. The use of biomarkers has played a very important role in certain aspects of personalized medicine. Also, the importance of biomarkers is increasing in the field of personalized medicine, with applications in diagnosis, prognosis, and selection of targeted therapies. In terms of calculating disease risk and response to therapy, the continuous development and identification of biomarkers specific to a disease and individual patients is vital for personalized medicine. Thus, the field of personalized medicine is expected to offer potential growth opportunities for players operating in the cancer biomarkers market.
Despite the advances in biomarkers in the last few years, the lack of clarity regarding several basic elements is restricting their full potential in human medicine. Limited acceptance of robust clinical biomarker tests is one of the major challenges in this regard. Human diseases are mostly complex in nature; several biomarkers are required to describe the imbalance in the metabolic equilibrium responsible for the disease and the effect of treatment. The biomarker validation process includes the evaluation of the assay or measurement of performance characteristics, such as sensitivity, specificity, and reproducibility
Report Metric |
Details |
Market size available for years |
20162021 |
Base year considered |
2016 |
Forecast period |
20172021 |
Forecast units |
Million (USD) |
Segments covered |
Global Cancer Biomarker Market, By Type
Global Cancer Biomarker Market, By Cancer Type
Global Cancer Biomarker Market, By Profiling Technology
Global Cancer Biomarker Market, By Application
|
Geographies covered |
|
Companies covered |
12.1 Thermo Fisher Scientific |
Year |
Segment |
Product |
2016 |
Assays |
Oncomine Immune Response Research Assay |
2016 |
Assays |
Clariom Pico Assays |
2016 |
Assays |
Axiom Precision Medicine Research Array |
2016 |
Assays |
Oncomine Lung Cell-Free DNA (cfDNA) Assay |
2017 |
Assays |
Bio-Plex Pro Human Apolipoprotein Panel |
2017 |
Biomarker |
anti-p504s (SP116) Rabbit Monoclonal Primary Antibody |
2017 |
Assays |
Received FDA approval for VENTANA PD-L1 (SP263) Assay |
2016 |
Biomarker test |
Received FDA approval cobas EGFR Mutation Test v2 |
2017 |
Kit |
ipsogen JAK2 RGQ PCR Kit |
2017 |
Biomarker Test |
AR-V7 Test |
To speak to our analyst for a discussion on the above findings, click Speak to Analyst
Table of Contents
1 Introduction (Page No. - 23)
1.1 Objectives of the Study
1.2 Market Definition
1.2.1 Markets Covered
1.2.2 Years Considered for the Study
1.3 Currency
1.4 Limitations
1.5 Stakeholders
2 Research Methodology (Page No. - 26)
2.1 Market Size Estimation
2.2 Market Breakdown and Data Triangulation
2.2.1 Secondary Sources
2.2.1.1 Key Industry Insights
2.3 Assumptions for the Study
3 Executive Summary (Page No. - 34)
4 Premium Insights (Page No. - 38)
4.1 Cancer Biomarkers: Market Snapshot
4.2 APAC Cancer Biomarkers Market, By Profiling Technology and Application
4.3 Cancer Biomarkers Market Share, By Cancer Type, 2017 vs 2022
4.4 Cancer Biomarkers Market Share, By Biomarker Type, 2015 to 2022
4.5 Cancer Biomarkers Market, By Region
5 Market Overview (Page No. - 42)
5.1 Introduction
5.1.1 Drivers
5.1.1.1 Technological Advancements
5.1.1.2 Rising Incidence of Cancer
5.1.1.3 Increasing Use of Cancer Biomarkers in Drug Discovery and Development
5.1.1.4 Increasing Research on Cancer Biomarkers
5.1.2 Restraints
5.1.2.1 Unfavorable Regulatory and Reimbursement Scenario
5.1.2.2 High Amount of Capital Investments and Low Benefit-Cost Ratio
5.1.2.3 Technical Issues Related to Sample Collection and Storage
5.1.3 Opportunities
5.1.3.1 Personalized Medicine
5.1.3.2 Companion Diagnostics
5.1.3.3 Emerging Economies
5.1.4 Challenges
5.1.4.1 Proving Clinical Validity and Utility of Biomarker-Based Tests
6 Cancer Biomarkers Market, By Biomarker Type (Page No. - 48)
6.1 Introduction
6.2 Protein Biomarkers
6.3 Genetic Biomarkers
6.3.1 Lung Cancer
6.3.2 Colorectal Cancer (CRC)
6.3.3 Breast Cancer
6.3.4 Prostate Cancer
6.3.5 Leukemia
6.4 Other Cancer Biomarkers
7 Cancer Biomarkers Market, By Cancer Type (Page No. - 62)
7.1 Introduction
7.2 Breast Cancer
7.3 Lung Cancer
7.4 CRC
7.5 Prostate Cancer
7.6 Non-Hodgkins Lymphoma (NHL)
7.7 Melanoma
7.8 Leukemia
7.9 Thyroid Cancer
7.10 Bladder Cancer
7.11 Kidney Cancer
7.12 Other Cancer Types
8 Cancer Biomarkers Market, By Profiling Technology (Page No. - 84)
8.1 Introduction
8.1.1 OMICS Technologies
8.1.2 Proteomics
8.1.3 Genomics
8.1.3.1 NGS
8.1.3.2 PCR
8.1.4 Other OMICS Technologies
8.2 Imaging Technologies
8.2.1 Ultrasound
8.2.2 CT
8.2.3 MRI
8.2.4 PET
8.2.5 Mammography
8.3 Immunoassays
8.4 Cytogenetics
8.4.1 ISH
8.4.2 Other Cytogenetics-Based Tests
8.5 Bioinformatics
9 Cancer Biomarkers Market, By Application (Page No. - 122)
9.1 Introduction
9.2 Diagnostics
9.3 R&D
9.4 Prognostics
9.5 Risk Assessment
9.6 Other Applications
10 Introduction (Page No. - 133)
10.1 Introduction
10.2 North America
10.2.1 US
10.2.2 Canada
10.3 Europe
10.3.1 Germany
10.3.2 UK
10.3.3 France
10.3.4 Italy
10.3.5 Spain
10.3.6 RoE
10.4 APAC
10.4.1 Japan
10.4.2 RoAPAC
10.5 RoW
10.5.1 Latin America
10.5.2 Middle East & Africa
11 Cancer Biomarkers Market Share, By Cancer Type, 2017 vs 2022 (Page No. - 189)
11.1 Market Ranking Analysis, 2016
12 Cancer Biomarkers Market, By Region (Page No. - 190)
12.1 Thermo Fisher Scientific
12.1.1 Overview
12.1.2 Product and Services
12.1.3 Financials
12.1.4 Strategy & Development
12.1.5 MnM View
12.2 Bio-Rad Laboratories
12.2.1 Overview
12.2.2 Product and Services
12.2.3 Financials
12.2.4 Strategy & Development
12.2.5 MnM View
12.3 Roche Diagnostics
12.3.1 Overview
12.3.2 Product and Services
12.3.3 Financials
12.3.4 Strategy & Development
12.3.5 MnM View
12.4 Qiagen N.V.
12.4.1 Overview
12.4.2 Product and Services
12.4.3 Financials
12.4.4 Strategy & Development
12.4.5 MnM View
12.5 Illumina
12.5.1 Overview
12.5.2 Product and Services
12.5.3 Financials
12.5.4 Strategy & Development
12.6 GE Healthcare
12.6.1 Overview
12.6.2 Product and Services
12.6.3 Financials
12.6.4 Strategy & Development
12.7 Agilent Technologies
12.7.1 Overview
12.7.2 Product and Services
12.7.3 Financials
12.7.4 Strategy & Development
12.8 Biomιrieux Sa
12.8.1 Overview
12.8.2 Product and Services
12.8.3 Financials
12.8.4 Strategy & Development
12.9 Merck & Co.
12.9.1 Overview
12.9.2 Product and Services
12.9.3 Financials
12.9.4 Strategy & Development
12.10 Abbott Laboratories
12.10.1 Overview
12.10.2 Product and Services
12.10.3 Financials
12.10.4 Strategy & Development
12.11 Becton, Dickinson and Company
12.11.1 Overview
12.11.2 Product and Services
12.11.3 Financials
12.11.4 Strategy & Development
12.12 Danaher Corporation
12.12.1 Overview
12.12.2 Product and Services
12.12.3 Financials
12.12.4 Strategy & Development
12.13 Myriad Genetics
12.13.1 Overview
12.13.2 Product and Services
12.13.3 Financials
12.13.4 Strategy & Development
12.14 Sysmex Corporation
12.14.1 Overview
12.14.2 Product and Services
12.14.3 Financials
12.14.4 Strategy & Development
12.15 Hologic
12.15.1 Overview
12.15.2 Product and Services
12.15.3 Financials
12.15.4 Strategy & Development
12.16 Quest Diagnostics
12.16.1 Overview
12.16.2 Product and Services
12.16.3 Financials
12.16.4 Strategy & Development
13 Competitive Landscape (Page No. - 239)
13.1 Insights of Industry Experts
13.2 Discussion Guide
13.3 Knowledge Store: Marketsandmarkets Subscription Portal
13.4 Introducing RT: Real-Time Market Intelligence
13.5 Available Customizations
13.6 Related Reports
13.7 Author Details
List of Tables (268 Tables)
Table 1 Cancer Biomarkers Market, By Biomarker Type, 20152022 (USD Million)
Table 2 Global Protein Cancer Biomarkers Market, By Region, 20152022 (USD Million)
Table 3 North America: Protein Cancer Biomarkers Market, By Country, 20152022 (USD Million)
Table 4 Europe: Protein Cancer Biomarkers Market, By Country, 20152022 (USD Million)
Table 5 APAC: Protein Cancer Biomarkers Market, By Country, 20152022 (USD Million)
Table 6 Global Genetic Cancer Biomarkers Market, By Region, 20152022 (USD Million)
Table 7 North America: Genetic Cancer Biomarkers Market, By Country, 20152022 (USD Million)
Table 8 Europe: Genetic Cancer Biomarkers Market, By Country, 20152022 (USD Million)
Table 9 APAC: Genetic Cancer Biomarkers Market, By Country, 20152022 (USD Million)
Table 10 Global Other Cancer Biomarkers Market, By Region, 20152022 (USD Million)
Table 11 North America: Other Cancer Biomarkers Market, By Country, 20152022 (USD Million)
Table 12 Europe: Other Cancer Biomarkers Market, By Country, 20152022 (USD Million)
Table 13 APAC: Other Cancer Biomarkers Market, By Country, 20152022 (USD Million)
Table 14 Global Cancer Biomarkers Market, By Cancer Type, 20152022 (USD Million)
Table 15 Global Breast Cancer Biomarkers Market, By Region, 20152022 (USD Million)
Table 16 North America: Breast Cancer Biomarkers Market, By Country, 20152022 (USD Million)
Table 17 Europe: Breast Cancer Biomarkers Market, By Country, 20152022 (USD Million)
Table 18 APAC: Breast Cancer Biomarkers Market, By Country, 20152022 (USD Million)
Table 19 Global Lung Cancer Biomarkers Market, By Region, 20152022 (USD Million)
Table 20 North America: Lung Cancer Biomarkers Market, By Country, 20152022 (USD Million)
Table 21 Europe: Lung Cancer Biomarkers Market, By Country, 20152022 (USD Million)
Table 22 APAC: Lung Cancer Biomarkers Market, By Country, 20152022 (USD Million)
Table 23 Global CRC Biomarkers Market, By Region, 20152022 (USD Million)
Table 24 North America: CRC Biomarkers Market, By Country, 20152022 (USD Million)
Table 25 Europe: CRC Biomarkers Market, By Country, 20152022 (USD Million)
Table 26 APAC: CRC Biomarkers Market, By Country, 20152022 (USD Million)
Table 27 Global Prostate Cancer Biomarkers Market, By Region, 20152022 (USD Million)
Table 28 North America: Prostate Cancer Biomarkers Market, By Country, 20152022 (USD Million)
Table 29 Europe: Prostate Cancer Biomarkers Market, By Country, 20152022 (USD Million)
Table 30 APAC: Prostate Cancer Biomarkers Market, By Country, 20152022 (USD Million)
Table 31 Global NHL Biomarkers Market, By Region, 20152022 (USD Million)
Table 32 North America: NHL Biomarkers Market, By Country, 20152022 (USD Million)
Table 33 Europe: NHL Biomarkers Market, By Country, 20152022 (USD Million)
Table 34 APAC: NHL Biomarkers Market, By Country, 20152022 (USD Million)
Table 35 Global Melanoma Biomarkers Market, By Region, 20152022 (USD Million)
Table 36 North America: Melanoma Biomarkers Market, By Country, 20152022 (USD Million)
Table 37 Europe: Melanoma Biomarkers Market, By Country, 20152022 (USD Million)
Table 38 APAC: Melanoma Biomarkers Market, By Country, 20152022 (USD Million)
Table 39 Global Leukemia Biomarkers Market, By Region, 20152022 (USD Million)
Table 40 North America: Leukemia Biomarkers Market, By Country, 20152022 (USD Million)
Table 41 Europe: Leukemia Biomarkers Market, By Country, 20152022 (USD Million)
Table 42 APAC: Leukemia Biomarkers Market, By Country, 20152022 (USD Million)
Table 43 Global Thyroid Cancer Biomarkers Market, By Region, 20152022 (USD Million)
Table 44 North America: Thyroid Cancer Biomarkers Market, By Country, 20152022 (USD Million)
Table 45 Europe: Thyroid Cancer Biomarkers Market, By Country, 20152022 (USD Million)
Table 46 APAC: Thyroid Cancer Biomarkers Market, By Country, 20152022 (USD Million)
Table 47 Global Bladder Cancer Biomarkers Market, By Region, 20152022 (USD Million)
Table 48 North America: Bladder Cancer Biomarkers Market, By Country, 20152022 (USD Million)
Table 49 Europe: Bladder Cancer Biomarkers Market, By Country, 20152022 (USD Million)
Table 50 APAC: Bladder Cancer Biomarkers Market, By Country, 20152022 (USD Million)
Table 51 Global Kidney Cancer Biomarkers Market, By Region, 20152022 (USD Million)
Table 52 North America: Kidney Cancer Biomarkers Market, By Country, 20152022 (USD Million)
Table 53 Europe: Kidney Cancer Biomarkers Market, By Country, 20152022 (USD Million)
Table 54 APAC: Kidney Cancer Biomarkers Market, By Country, 20152022 (USD Million)
Table 55 Global Other Cancer Biomarkers Market, By Region, 20152022 (USD Million)
Table 56 North America: Other Cancer Biomarkers Market, By Country, 20152022 (USD Million)
Table 57 Europe: Other Cancer Biomarkers Market, By Country, 20152022 (USD Million)
Table 58 APAC: Other Cancer Biomarkers Market, By Country, 20152022 (USD Million)
Table 59 Global Cancer Biomarkers Market, By Profiling Technology, 20152022 (USD Million)
Table 60 Cancer Biomarkers Market for OMICS Technologies, By Type, 20152022 (USD Million)
Table 61 Cancer Biomarkers Market for OMICS Technologies, By Region, 20152022 (USD Million)
Table 62 North America: Cancer Biomarkers Market for OMICS Technologies, By Country, 20152022 (USD Million)
Table 63 Europe: Cancer Biomarkers Market for OMICS Technologies, By Country, 20152022 (USD Million)
Table 64 APAC: Cancer Biomarkers Market for OMICS Technologies, By Country, 20152022 (USD Million)
Table 65 Cancer Biomarkers Market for Proteomics, By Region, 20152022 (USD Million)
Table 66 North America: Cancer Biomarkers Market for Proteomics, By Country, 20152022 (USD Million)
Table 67 Europe: Cancer Biomarkers Market for Proteomics, By Country, 20152022 (USD Million)
Table 68 APAC: Cancer Biomarkers Market for Proteomics, By Country, 20152022 (USD Million)
Table 69 Cancer Biomarkers Market for Genomics, By Type, 20152022 (USD Million)
Table 70 Cancer Biomarkers Market for Genomics, By Region, 20152022 (USD Million)
Table 71 North America: Cancer Biomarkers Market for Genomics, By Country, 20152022 (USD Million)
Table 72 Europe: Cancer Biomarkers Market for Genomics, By Country, 20152022 (USD Million)
Table 73 APAC: Cancer Biomarkers Market for Genomics, By Country, 20152022 (USD Million)
Table 74 Cancer Biomarkers Market for NGS, By Region, 20152022 (USD Million)
Table 75 North America: Cancer Biomarkers Market for NGS, By Country, 20152022 (USD Million)
Table 76 Europe: Cancer Biomarkers Market for NGS, By Country, 20152022 (USD Million)
Table 77 APAC: Cancer Biomarkers Market for NGS, By Country, 20152022 (USD Million)
Table 78 Cancer Biomarkers Market for PCR, By Region, 20152022 (USD Million)
Table 79 North America: Cancer Biomarkers Market for PCR, By Country, 20152022 (USD Million)
Table 80 Europe: Cancer Biomarkers Market for PCR, By Country, 20152022 (USD Million)
Table 81 APAC: Cancer Biomarkers Market for PCR, By Country, 20152022 (USD Million)
Table 82 Cancer Biomarkers Market for Other OMICS Technologies, By Region, 20152022 (USD Million)
Table 83 North America: Cancer Biomarkers Market for Other OMICS Technologies, By Country, 20152022 (USD Million)
Table 84 Europe: Cancer Biomarkers Market for Other OMICS Technologies, By Country, 20152022 (USD Million)
Table 85 APAC: Cancer Biomarkers Market for Other OMICS Technologies, By Country, 20152022 (USD Million)
Table 86 Cancer Biomarkers Market for Imaging Technologies, By Type, 20152022 (USD Million)
Table 87 Cancer Biomarkers Market for Imaging Technologies, By Region, 20152022 (USD Million)
Table 88 North America: Cancer Biomarkers Market for Imaging Technologies, By Country, 20152022 (USD Million)
Table 89 Europe: Cancer Biomarkers Market for Imaging Technologies, By Country, 20152022 (USD Million)
Table 90 APAC: Cancer Biomarkers Market for Imaging Technologies, By Country, 20152022 (USD Million)
Table 91 Cancer Biomarkers Market for Ultrasound, By Region, 20152022 (USD Million)
Table 92 North America: Cancer Biomarkers Market for Ultrasound, By Country, 20152022 (USD Million)
Table 93 Europe: Cancer Biomarkers Market for Ultrasound, By Country, 20152022 (USD Million)
Table 94 APAC: Cancer Biomarkers Market for Ultrasound, By Country, 20152022 (USD Million)
Table 95 Cancer Biomarkers Market for CT, By Region, 20152022 (USD Million)
Table 96 North America: Cancer Biomarkers Market for CT, By Country, 20152022 (USD Million)
Table 97 Europe: Cancer Biomarkers Market for CT, By Country, 20152022 (USD Million) 104
Table 98 APAC: Cancer Biomarkers Market for CT, By Country, 20152022 (USD Million) 105
Table 99 Cancer Biomarkers Market for MRI, By Region, 20152022 (USD Million) 106
Table 100 North America: Cancer Biomarkers Market for MRI, By Country, 20152022 (USD Million) 106
Table 101 Europe: Cancer Biomarkers Market for MRI, By Country, 20152022 (USD Million) 106
Table 102 APAC: Cancer Biomarkers Market for MRI, By Country, 20152022 (USD Million) 107
Table 103 Cancer Biomarkers Market for Pet, By Region, 20152022 (USD Million) 107
Table 104 North America: Cancer Biomarkers Market for Pet, By Country, 20152022 (USD Million)
Table 105 Europe: Cancer Biomarkers Market for Pet, By Country, 20152022 (USD Million)
Table 106 APAC: Cancer Biomarkers Market for Pet, By Country, 20152022 (USD Million)
Table 107 Cancer Biomarkers Market for Mammography, By Region, 20152022 (USD Million)
Table 108 North America: Cancer Biomarkers Market for Mammography, By Country, 20152022 (USD Million)
Table 109 Europe: Cancer Biomarkers Market for Mammography, By Country, 20152022 (USD Million)
Table 110 APAC: Cancer Biomarkers Market for Mammography, By Country, 20152022 (USD Million)
Table 111 Cancer Biomarkers Market for Immunoassays, By Region, 20152022 (USD Million)
Table 112 North America: Cancer Biomarkers Market for Immunoassays, By Country, 20152022 (USD Million)
Table 113 Europe: Cancer Biomarkers Market for Immunoassays, By Country, 20152022 (USD Million)
Table 114 APAC: Cancer Biomarkers Market for Immunoassays, By Country, 20152022 (USD Million)
Table 115 Cancer Biomarkers Market for Cytogenetics, By Region, 20152022 (USD Million)
Table 116 North America: Cancer Biomarkers Market for Cytogenetics, By Country, 20152022 (USD Million)
Table 117 Europe: Cancer Biomarkers Market for Cytogenetics, By Country, 20152022 (USD Million)
Table 118 APAC: Cancer Biomarkers Market for Cytogenetics, By Country, 20152022 (USD Million)
Table 119 Cancer Biomarkers Market for ISH, By Region, 20152022 (USD Million)
Table 120 North America: Cancer Biomarkers Market for ISH, By Country, 20152022 (USD Million)
Table 121 Europe: Cancer Biomarkers Market for ISH, By Country, 20152022 (USD Million)
Table 122 APAC: Cancer Biomarkers Market for ISH, By Country, 20152022 (USD Million)
Table 123 Cancer Biomarkers Market for Other Cytogenetics-Based Tests, By Region, 20152022 (USD Million)
Table 124 North America: Cancer Biomarkers Market for Other Cytogenetics-Based Tests, By Country, 20152022 (USD Million)
Table 125 Europe: Cancer Biomarkers Market for Other Cytogenetics-Based Tests, By Country, 20152022 (USD Million)
Table 126 APAC: Cancer Biomarkers Market for Other Cytogenetics-Based Tests, By Country, 20152022 (USD Million)
Table 127 Global Cancer Biomarkers Market for Bioinformatics, By Region, 20152022 (USD Million)
Table 128 North America: Cancer Biomarkers Market for Bioinformatics, By Country, 20152022 (USD Million)
Table 129 Europe: Cancer Biomarkers Market for Bioinformatics, By Country, 20152022 (USD Million)
Table 130 APAC: Cancer Biomarkers Market for Bioinformatics, By Country, 20152022 (USD Million)
Table 131 Global Cancer Biomarkers Market, By Application, 20152022 (USD Million)
Table 132 Global Cancer Biomarkers Market for Diagnostics, By Region, 20152022 (USD Million)
Table 133 North America: Cancer Biomarkers Market for Diagnostics, By Country, 20152022 (USD Million)
Table 134 Europe: Cancer Biomarkers Market for Diagnostics, By Country, 20152022 (USD Million)
Table 135 APAC: Cancer Biomarkers Market for Diagnostics, By Country, 20152022 (USD Million)
Table 136 Global Cancer Biomarkers Market for R&D, By Region, 20152022 (USD Million)
Table 137 North America: Cancer Biomarkers Market for R&D, By Country, 20152022 (USD Million)
Table 138 Europe: Cancer Biomarkers Market for R&D, By Country, 20152022 (USD Million)
Table 139 APAC: Cancer Biomarkers Market for R&D, By Country, 20152022 (USD Million)
Table 140 Global Cancer Biomarkers Market for Prognostics, By Region, 20152022 (USD Million)
Table 141 North America: Cancer Biomarkers Market for Prognostics, By Country, 20152022 (USD Million)
Table 142 Europe: Cancer Biomarkers Market for Prognostics, By Country, 20152022 (USD Million)
Table 143 APAC: Cancer Biomarkers Market for Prognostics, By Country, 20152022 (USD Million)
Table 144 Global Cancer Biomarkers Market for Risk Assessment, By Region, 20152022 (USD Million)
Table 145 North America: Cancer Biomarkers Market for Risk Assessment, By Country, 20152022 (USD Million)
Table 146 Europe: Cancer Biomarkers Market for Risk Assessment, By Country, 20152022 (USD Million)
Table 147 APAC: Cancer Biomarkers Market for Risk Assessment, By Country, 20152022 (USD Million)
Table 148 Global Cancer Biomarkers Market for Other Applications, By Region, 20152022 (USD Million)
Table 149 North America: Cancer Biomarkers Market for Other Applications, By Country, 20152022 (USD Million)
Table 150 Europe: Cancer Biomarkers Market for Other Applications, By Country, 20152022 (USD Million)
Table 151 APAC: Cancer Biomarkers Market for Other Applications, By Country, 20152022 (USD Million)
Table 152 Global Cancer Biomarkers Market, By Region, 20152022 (USD Million)
Table 153 North America: Cancer Biomarkers Market, By Country, 20152022 (USD Million)
Table 154 North America: Cancer Biomarkers Market, By Cancer Type, 20152022 (USD Million)
Table 155 North America: Cancer Biomarkers Market, By Biomarker Type, 20152022 (USD Million)
Table 156 North America: Cancer Biomarkers Market, By Profiling Technology, 20152022 (USD Million)
Table 157 North America: OMICS Technologies Market, By Type, 20152022 (USD Million)
Table 158 North America: Genomics Technologies Market, By Type, 20152022 (USD Million)
Table 159 North America: Imaging Technologies Market, By Type, 20152022 (USD Million)
Table 160 North America: Cytogenetics Market, By Type, 20152022 (USD Million)
Table 161 North America: Cancer Biomarkers Market, By Application, 20152022 (USD Million)
Table 162 US: Cancer Biomarkers Market, By Cancer Type, 20152022 (USD Million)
Table 163 US: Cancer Biomarkers Market, By Biomarker Type, 20152022 (USD Million)
Table 164 US: Cancer Biomarkers Market, By Profiling Technology, 20152022 (USD Million)
Table 165 US: OMICS Technologies Market, By Type, 20152022 (USD Million)
Table 166 US: Genomics Technologies Market, By Type, 20152022 (USD Million)
Table 167 US: Imaging Technologies Market, By Type, 20152022 (USD Million)
Table 168 US: Cytogenetics Market, By Type, 20152022 (USD Million)
Table 169 US: Cancer Biomarkers Market, By Application, 20152022 (USD Million)
Table 170 Canada: Cancer Biomarkers Market, By Cancer Type, 20152022 (USD Million)
Table 171 Canada: Cancer Biomarkers Market, By Biomarker Type, 20152022 (USD Million)
Table 172 Canada: Cancer Biomarkers Market, By Profiling Technology, 20152022 (USD Million)
Table 173 Canada: OMICS Technologies Market, By Type, 20152022 (USD Million)
Table 174 Canada: Genomics Technologies Market, By Type, 20152022 (USD Million)
Table 175 Canada: Imaging Technologies Market, By Type, 20152022 (USD Million)
Table 176 Canada: Cytogenetics Market, By Type, 20152022 (USD Million)
Table 177 Canada: Cancer Biomarkers Market, By Application, 20152022 (USD Million)
Table 178 Europe: Cancer Biomarkers Market, By Country, 20152022 (USD Million)
Table 179 Europe: Cancer Biomarkers Market, By Cancer Type, 20152022 (USD Million)
Table 180 Europe: Cancer Biomarkers Market, By Biomarker Type, 20152022 (USD Million)
Table 181 Europe: Cancer Biomarkers Market, By Profiling Technology,20152022 (USD Million)
Table 182 Europe: OMICS Technologies Market, By Type, 20152022 (USD Million)
Table 183 Europe: Genomics Technologies Market, By Type, 20152022 (USD Million)
Table 184 Europe: Imaging Technologies Market, By Type, 20152022 (USD Million)
Table 185 Europe: Cytogenetics Market, By Type, 20152022 (USD Million)
Table 186 Europe: Cancer Biomarkers Market, By Application, 20152022 (USD Million)
Table 187 Germany: Cancer Biomarkers Market, By Cancer Type, 20152022 (USD Million)
Table 188 Germany: Cancer Biomarkers Market, By Biomarker Type, 20152022 (USD Million)
Table 189 Germany: Cancer Biomarkers Market, By Profiling Technology, 20152022 (USD Million)
Table 190 Germany: OMICS Technologies Market, By Type, 20152022 (USD Million)
Table 191 Germany: Genomics Technologies Market, By Type, 20152022 (USD Million)
Table 192 Germany: Imaging Technologies Market, By Type, 20152022 (USD Million)
Table 193 Germany: Cytogenetics Market, By Type, 20152022 (USD Million)
Table 194 Germany: Cancer Biomarkers Market, By Application, 20152022 (USD Million)
Table 195 UK: Cancer Biomarkers Market, By Cancer Type, 20152022 (USD Million)
Table 196 UK: Cancer Biomarkers Market, By Biomarker Type, 20152022 (USD Million)
Table 197 UK: Cancer Biomarkers Market, By Profiling Technology, 20152022 (USD Million)
Table 198 UK: OMICS Technologies Market, By Type, 20152022 (USD Million)
Table 199 UK: Genomics Technologies Market, By Type, 20152022 (USD Million)
Table 200 UK: Imaging Technologies Market, By Type, 20152022 (USD Million)
Table 201 UK: Cytogenetics Market, By Type, 20152022 (USD Million)
Table 202 UK: Cancer Biomarkers Market, By Application, 20152022 (USD Million)
Table 203 France: Cancer Biomarkers Market, By Cancer Type, 20152022 (USD Million)
Table 204 France: Cancer Biomarkers Market, By Biomarker Type, 20152022 (USD Million)
Table 205 France: Cancer Biomarkers Market, By Profiling Technology, 20152022 (USD Million)
Table 206 France: OMICS Technologies Market, By Type, 20152022 (USD Million)
Table 207 France: Genomics Technologies Market, By Type, 20152022 (USD Million)
Table 208 France: Imaging Technologies Market, By Type, 20152022 (USD Million)
Table 209 France: Cytogenetics Market, By Type, 20152022 (USD Million)
Table 210 France: Cancer Biomarkers Market, By Application, 20152022 (USD Million)
Table 211 Italy: Cancer Biomarkers Market, By Cancer Type, 20152022 (USD Million)
Table 212 Italy: Cancer Biomarkers Market, By Biomarker Type, 20152022 (USD Million)
Table 213 Italy: Cancer Biomarkers Market, By Profiling Technology, 20152022 (USD Million)
Table 214 Italy: OMICS Technologies Market, By Type, 20152022 (USD Million)
Table 215 Italy: Genomics Technologies Market, By Type, 20152022 (USD Million)
Table 216 Italy: Imaging Technologies Market, By Type, 20152022 (USD Million)
Table 217 Italy: Cytogenetics Market, By Type, 20152022 (USD Million)
Table 218 Italy: Cancer Biomarkers Market, By Application, 20152022 (USD Million)
Table 219 Spain: Cancer Biomarkers Market, By Cancer Type, 20152022 (USD Million)
Table 220 Spain: Cancer Biomarkers Market, By Biomarker Type, 20152022 (USD Million)
Table 221 Spain: Cancer Biomarkers Market, By Profiling Technology, 20152022 (USD Million)
Table 222 Spain: OMICS Technologies Market, By Type, 20152022 (USD Million)
Table 223 Spain: Genomics Technologies Market, By Type, 20152022 (USD Million)
Table 224 Spain: Imaging Technologies Market, By Type, 20152022 (USD Million)
Table 225 Spain: Cytogenetics Market, By Type, 20152022 (USD Million)
Table 226 Spain: Cancer Biomarkers Market, By Application, 20152022 (USD Million)
Table 227 RoE: Cancer Biomarkers Market, By Cancer Type, 20152022 (USD Million)
Table 228 RoE: Cancer Biomarkers Market, By Type, 20152022 (USD Million)
Table 229 RoE: Cancer Biomarkers Market, By Profiling Technology, 20152022 (USD Million)
Table 230 RoE: OMICS Technologies Market, By Type, 20152022 (USD Million)
Table 231 RoE: Genomics Technologies Market, By Type, 20152022 (USD Million)
Table 232 RoE: Imaging Technologies Market, 20152022 (USD Million)
Table 233 RoE: Cytogenetics Market, By Type, 20152022 (USD Million)
Table 234 RoE: Cancer Biomarkers Market, By Application, 20152022 (USD Million)
Table 235 APAC: Cancer Biomarkers Market, By Country, 20152022 (USD Million)
Table 236 APAC: Cancer Biomarkers Market, By Cancer Type, 20152022 (USD Million)
Table 237 APAC: Cancer Biomarkers Market, By Biomarker Type, 20152022 (USD Million)
Table 238 APAC: Cancer Biomarkers Market, By Profiling Technology, 20152022 (USD Million)
Table 239 APAC: OMICS Technologies Market, By Type, 20152022 (USD Million)
Table 240 APAC: Genomics Technologies Market, By Type, 20152022 (USD Million)
Table 241 APAC: Imaging Technologies Market, By Type, 20152022 (USD Million)
Table 242 APAC: Cytogenetics Market, By Type, 20152022 (USD Million)
Table 243 APAC: Cancer Biomarkers Market, By Application, 20152022 (USD Million)
Table 244 Japan: Cancer Biomarkers Market, By Cancer Type, 20152022 (USD Million)
Table 245 Japan: Cancer Biomarkers Market, By Type, 20152022 (USD Million)
Table 246 Japan: Cancer Biomarkers Market, By Profiling Technology, 20152022 (USD Million)
Table 247 Japan: OMICS Technologies Market, By Type, 20152022 (USD Million)
Table 248 Japan: Genomics Technologies Market, By Type, 20152022 (USD Million)
Table 249 Japan: Imaging Technologies Market, By Type, 20152022 (USD Million)
Table 250 Japan: Cytogenetics Market, By Type, 20152022 (USD Million)
Table 251 Japan: Cancer Biomarkers Market, By Application, 20152022 (USD Million)
Table 252 RoAPAC: Cancer Biomarkers Market, By Cancer Type, 20152022 (USD Million)
Table 253 RoAPAC: Cancer Biomarkers Market, By Biomarker Type, 20152020 (USD Million)
Table 254 RoAPAC: Cancer Biomarkers Market, By Profiling Technology, 20152022 (USD Million)
Table 255 RoAPAC: OMICS Technologies Market, By Type, 20152022 (USD Million)
Table 256 RoAPAC: Genomics Technologies Market, By Type, 20152022 (USD Million)
Table 257 RoAPAC: Imaging Technologies Market, By Type, 20152022 (USD Million)
Table 258 RoAPAC: Cytogenetics Market, By Type, 20152022 (USD Million)
Table 259 RoAPAC: Cancer Biomarkers Market, By Application, 20152022 (USD Million)
Table 260 RoW: Cancer Biomarkers Market, By Cancer Type, 20152022 (USD Million)
Table 261 RoW: Cancer Biomarkers Market, By Biomarker Type, 20152022 (USD Million)
Table 262 RoW: Cancer Biomarkers Market, By Profiling Technology, 20152022 (USD Million)
Table 263 RoW: OMICS Technologies Market, By Type, 20152022 (USD Million)
Table 264 RoW: Genomics Technologies Market, By Type, 20152022 (USD Million)
Table 265 RoW: Imaging Technologies Market, By Type, 20152022 (USD Million)
Table 266 RoW: Cytogenetics Market, By Type, 20152022 (USD Million)
Table 267 RoW: Cancer Biomarkers Market, By Application, 20152022 (USD Million)
Table 268 Rank of Companies in the Global Cancer Biomarkers Market, 2016
List of Figures (37 Figures)
Figure 1 Research Design
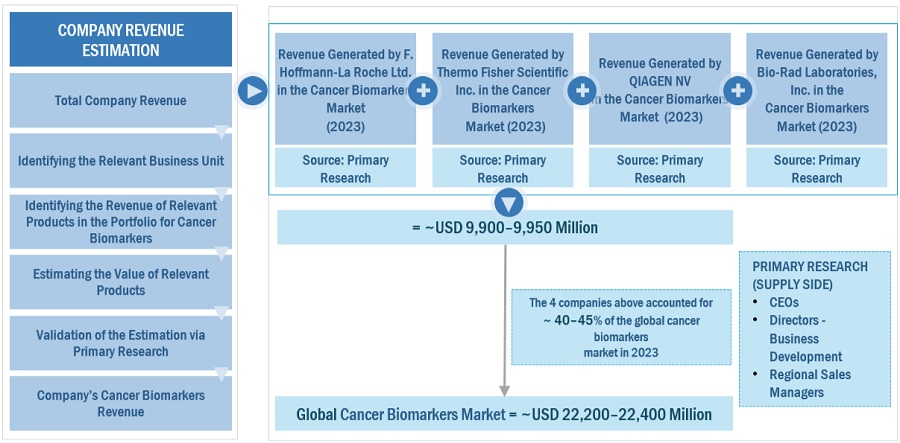
Figure 2 Bottom-Up Approach
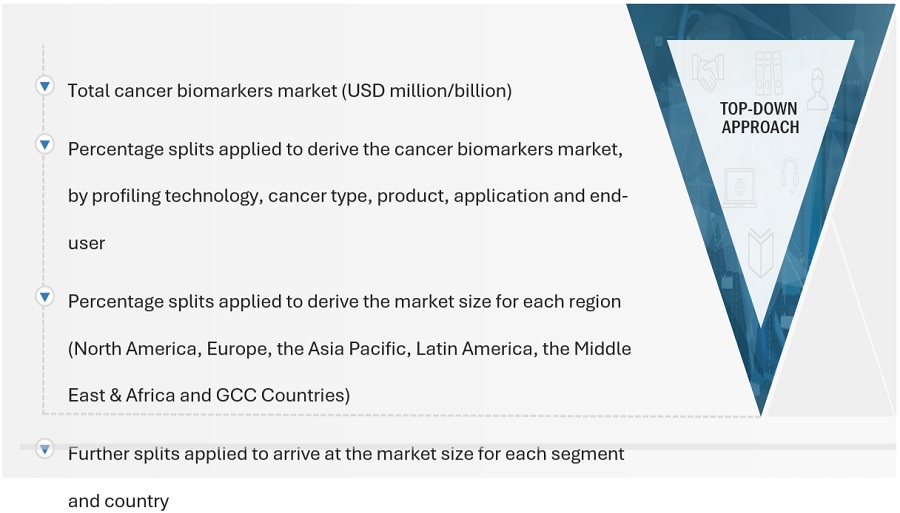
Figure 3 Top-Down Approach
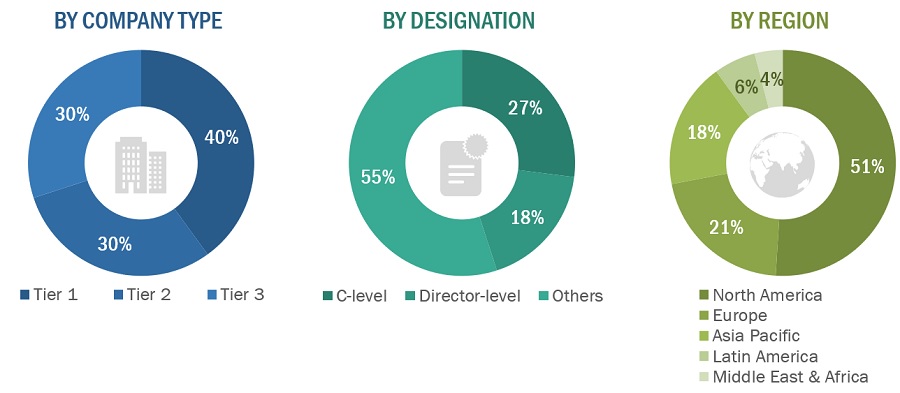
Figure 4 Breakdown of Primary Interviews: By Company Type, Designation, and Region
Figure 5 Data Triangulation
Figure 6 Cancer Biomarkers Market, By Cancer Type, 2017 vs 2022 (USD Million)
Figure 7 Cancer Biomarkers Market, By Biomarker Type, 2017 vs 2022 (USD Million)
Figure 8 Cancer Biomarkers Market, By Application, 2017 vs 2022 (USD Million)
Figure 9 Cancer Biomarkers Market, By Profiling Technology, 2017 vs 2022 (USD Million)
Figure 10 Geographical Snapshot of the Cancer Biomarkers Market
Figure 11 Technological Advancements A Major Driver for Cancer Biomarkers Market in 2017
Figure 12 Cancer Biomarkers Market: Drivers, Restraints, Opportunities, and Challenges
Figure 13 Genetic Biomarkers to Register Highest CAGR, 2017-2022 (USD Million)
Figure 14 Mutation Rate of Cell Surface Receptor Biomarkers in Breast Tumor
Figure 15 Global Cancer Biomarkers Market, By Cancer Type, 2017-2022 (USD Million)
Figure 16 OMICS Technologies Segment to Lead Global Cancer Biomarkers Market, 2017-2022 (USD Million)
Figure 17 Diagnostics Application Segment to Lead Cancer Biomarkers Market, 2017-2022 (USD Million)
Figure 18 Cancer Biomarkers Market: Geographic Snapshot (20172022)
Figure 19 North America Market Snapshot
Figure 20 Europe Market Snapshot
Figure 21 APAC Market Snapshot
Figure 22 Thermo Fisher Scientific: Company Snapshot (2016)
Figure 23 Bio-Rad Laboratories: Company Snapshot (2016)
Figure 24 Roche Diagnostics: Company Snapshot (2016)
Figure 25 Qiagen N.V.: Company Snapshot (2016)
Figure 26 Illumina: Company Snapshot (2016)
Figure 27 GE Healthcare: Company Snapshot (2016)
Figure 28 Agilent Technologies: Company Snapshot (2016)
Figure 29 Biomιrieux SA: Company Snapshot (2016)
Figure 30 Merck & Co.Inc.: Company Snapshot (2016)
Figure 31 Abbott Laboratories: Company Snapshot (2016)
Figure 32 Becton, Dickinson and Company: Company Snapshot (2016)
Figure 33 Danaher Corporation: Company Snapshot (2016)
Figure 34 Myriad Genetics Inc.: Company Snapshot (2016)
Figure 35 Sysmex Corporation: Company Snapshot (2016)
Figure 36 Hologic: Company Snapshot (2016)
Figure 37 Quest Diagnostics: Company Snapshot (2016)
Benchmarking the rapid strategy shifts of the Top 100 companies in the Cancer Biomarkers Market
Request For Special Pricing
Growth opportunities and latent adjacency in Cancer Biomarkers Market