lon Exchange Resins Market by Type (Cationic Resins, Anionic Resins), Application (Water, Non-Water), End-Use Industry (Power, Chemicals & Petrochemicals, Pharmaceuticals, Food & Beverage, Electrical & Electronics), and Region - Global Forecast to 2031

icon1
USD 2.97 BN
MARKET SIZE, 2031
icon2
CAGR 4.8%
(2026-2031)
icon3
236
REPORT PAGES
icon4
218
MARKET TABLES

OVERVIEW

ion-exchange-resins-market Overview

Source: Secondary Research, Interviews with Experts, MarketsandMarkets Analysis

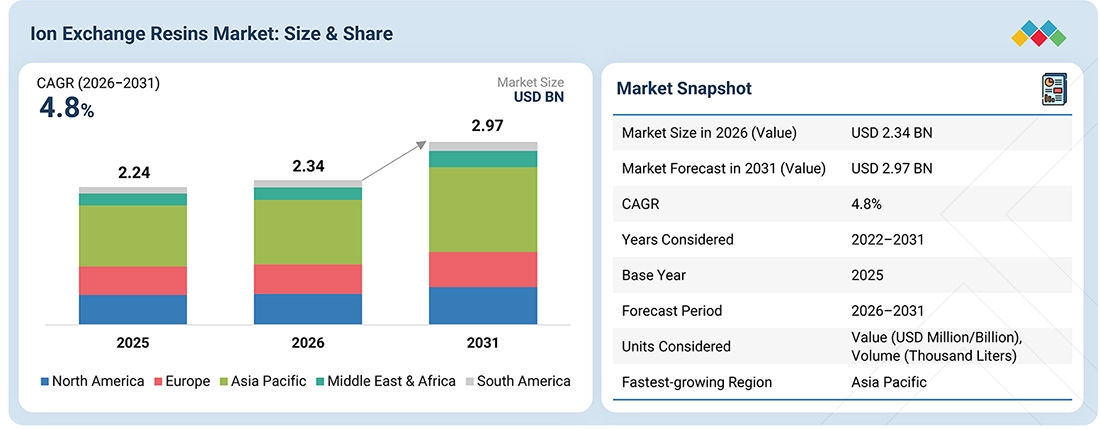
The ion exchange resins market is projected to reach USD 2.97 billion by 2031, up from USD 2.34 billion in 2026, at a CAGR of 4.8%. Market growth is driven by rising demand for water treatment and purification across municipal and industrial applications. Rapid urbanization and industrialization are increasing the need for treated water and effective wastewater management. Demand for high-purity water is growing in the power generation, pharmaceuticals, chemicals, food & beverage, and electrical & electronics industries, supporting the adoption of ion exchange resins. Stringent water treatment regulations are also prompting industries to improve water quality and comply with discharge standards. Furthermore, the growing emphasis on water recycling and reuse is increasing the use of ion exchange resins in treatment processes.

KEY TAKEAWAYS

  • By Region
    Asia Pacific accounted for a 44.3% share of the ion exchange resins market in 2025.
  • By Type
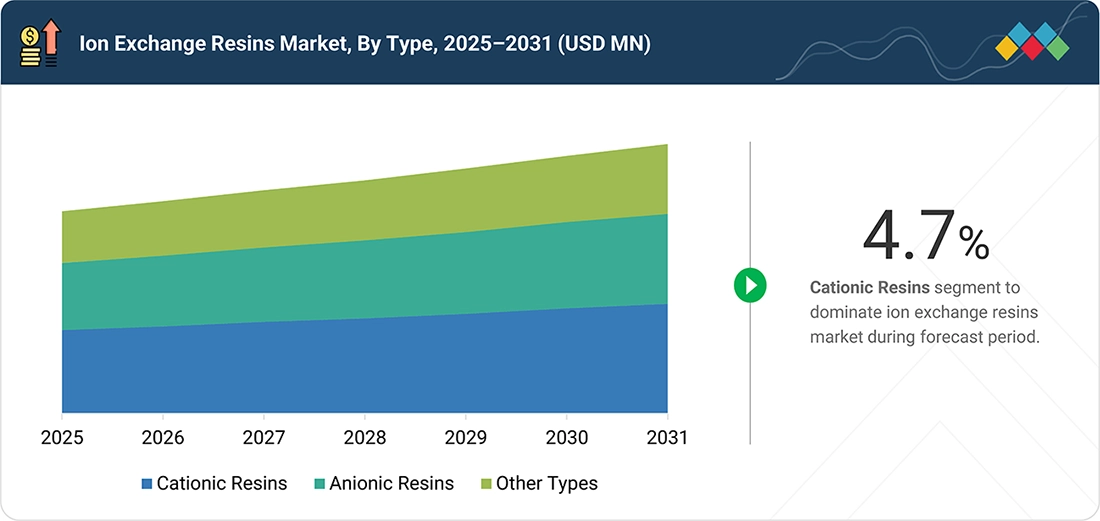
    Cationic resins held the largest share of 41.1% of the ion exchange resins market, by type, in 2025.
  • By Application
    Water is the fastest-growing application in the ion exchange resins market, with a CAGR of 5.0% between 2026 and 2031.
  • By End-use Industry
    The power industry is projected to account for the largest share of the ion exchange resins market, by end-use industry, during the forecast period.
  • Competitive Landscape - Key Players
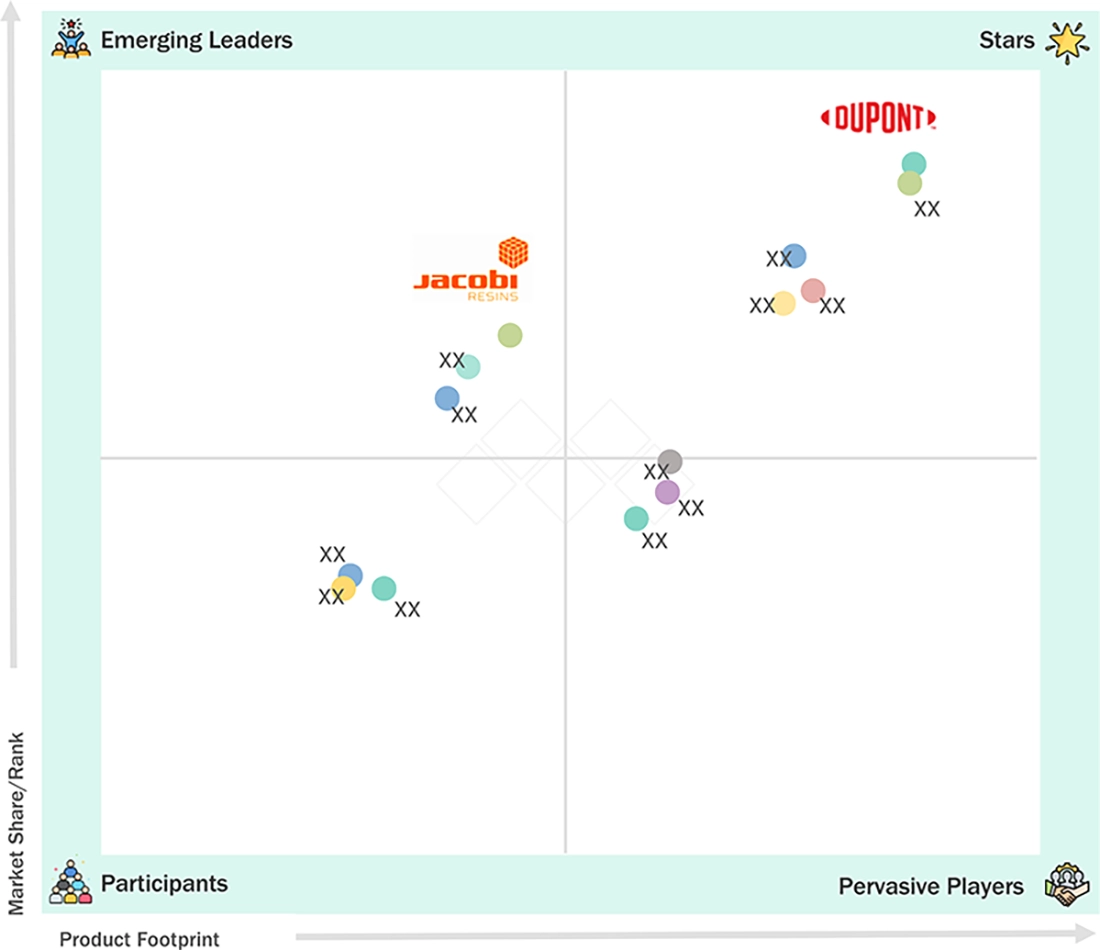
    DuPont, LANXESS, and Mitsubishi Chemical Group Corporation were identified as some of the star players in the global ion exchange resins market, given their strong market share and product footprint.
  • Competitive Landscape - Startups
    ResinTech, Inc., GFS Chemicals, and Suqing Group have distinguished themselves among startups and SMEs by securing strong footholds in specialized niche areas.

The ion exchange resins market is growing due to rising demand for water treatment and purification across municipal and industrial sectors. Rapid urbanization and industrial expansion continue to increase the need for clean water and effective wastewater management. Industries such as power generation, pharmaceuticals, chemicals, food & beverage, and electrical & electronics require high-purity water, which is driving the adoption of ion exchange resins. Governments are also tightening water treatment regulations, prompting companies to invest in meeting quality and discharge standards. In addition, the growing focus on water recycling and reuse is accelerating the adoption of advanced treatment methods that use ion exchange resins. Together, these factors are driving demand for ion exchange resins.

TRENDS & DISRUPTIONS IMPACTING CUSTOMERS' CUSTOMERS

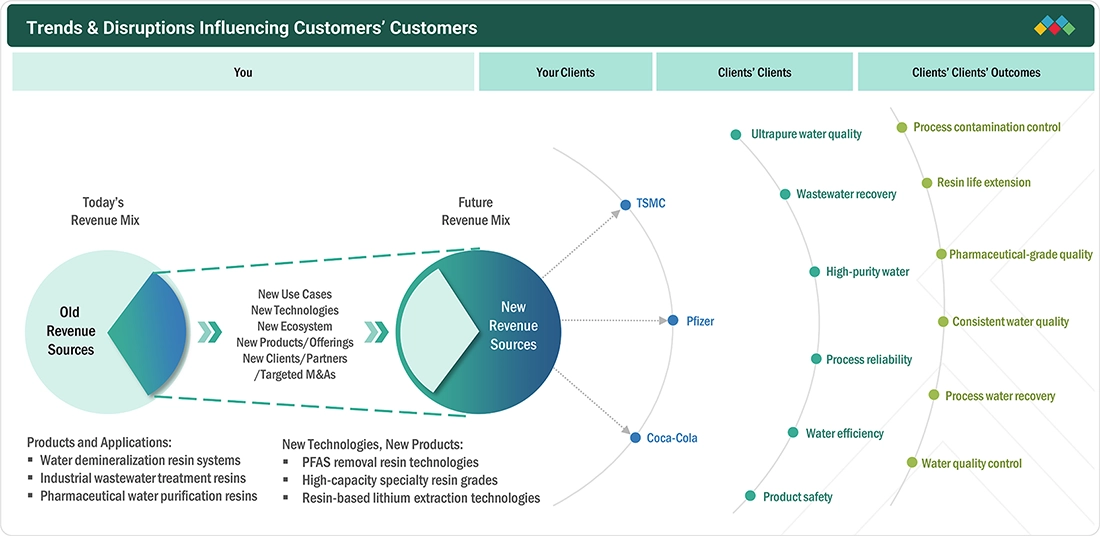
Trends and disruptions are having a growing impact on clients' businesses in the ion exchange resins market as companies prioritize water efficiency, high-purity water, wastewater recovery, and resource conservation. TSMC is enhancing its ion exchange resin systems to extend resin life and reduce wastewater from semiconductor operations. Pfizer is focusing on water conservation, responsible discharge management, and water reuse across its manufacturing operations. The Coca-Cola Company is investing in water-efficiency technologies, recycling, and water replenishment, as water availability increasingly affects manufacturing operations. These trends are increasing demand for longer-lasting, higher-capacity, application-specific ion exchange resins.

ion-exchange-resins-market Disruptions

Source: Secondary Research, Interviews with Experts, MarketsandMarkets Analysis

MARKET DYNAMICS

Drivers
Impact
Level
  • Increasing demand for nuclear power in emerging economies
  • Stringent water treatment regulations
RESTRAINTS
Impact
Level
  • Volatility in raw material prices
  • Increasing competition from reverse osmosis membrane technology
OPPORTUNITIES
Impact
Level
  • Growing industrialization in emerging economies
  • Increasing importance of water recycling and reuse
CHALLENGES
Impact
Level
  • Finding new applications for ion exchange resins
  • Complex wastewater compositions

Source: Secondary Research, Interviews with Experts, MarketsandMarkets Analysis

Driver: Increasing demand for nuclear power in emerging economies

Growing demand for nuclear power in emerging economies is driving the ion exchange resins market. Nuclear power plants require high-purity water for reactor systems, steam generation, cooling circuits, and wastewater treatment. To operate safely and efficiently, these facilities must comply with strict safety standards, which makes them reliant on water purification systems. Ion exchange resins play a key role in this process by removing dissolved ions, radioactive materials, and other impurities, helping control water chemistry within the plant. As more countries build new reactors and expand their existing nuclear power infrastructure, demand for specialized ion exchange resins continues to rise. The critical need for high-purity water in nuclear operations is expected to sustain strong market demand.

Restraint: Volatility in raw material prices

Volatility in raw material prices restrains the growth of the ion exchange resins market by raising production costs and creating uncertainty for manufacturers. Ion exchange resins are made from styrene, divinylbenzene, acrylic compounds, and other chemical reagents. The prices of these materials fluctuate with changes in crude oil prices, energy costs, supply conditions, and transportation costs. Higher input costs increase the price of ion exchange resins and influence purchasing decisions among price-sensitive customers. Manufacturers also find it difficult to maintain profit margins when raw material prices change rapidly. These price swings complicate production planning, pricing, and the securing of long-term supply agreements.

Opportunity: Growing industrialization in emerging economies

Growing industrialization in emerging economies presents a significant opportunity for the ion exchange resins market, as increased production raises the need for clean water and wastewater treatment. The chemicals, pharmaceuticals, power generation, food & beverage, electronics, and metals industries all depend on water to operate their facilities and equipment. As industrial activity expands, wastewater volumes increase, creating greater demand for technologies that remove dissolved ions and other contaminants before water is discharged or reused. Investments in manufacturing facilities and water infrastructure across Asia Pacific, Latin America, and the Middle East are further supporting market growth. With rising industrial water consumption, ion exchange resins are expected to see wider use in process water treatment and wastewater management.

Challenge: Finding new applications for ion exchange resins

Identifying new applications is a key challenge for the ion exchange resins market, as conventional applications in water treatment, power generation, chemical processing, pharmaceuticals, and food & beverage are already well established. Companies seek applications that can generate additional revenue without requiring major changes to existing resin technologies or systems. Developing resins for new applications may require extensive testing to demonstrate performance, durability, selectivity, and cost-effectiveness under varying operating conditions. Competing separation and purification technologies can further limit opportunities for these resins. As a result, resin manufacturers must continue to invest in product development and application research to address emerging needs and expand beyond traditional markets.

ION EXCHANGE RESINS MARKET: COMMERCIAL USE CASES ACROSS INDUSTRIES

COMPANY USE CASE DESCRIPTION BENEFITS
company logo
Ion exchange resins purify industrial, nuclear, drinking, and electrolyzer process water High-purity water, contaminant removal, and improved process efficiency
company logo
Lewatit resins treat water and liquids across power, pharmaceutical, chemical, mining, and semiconductor applications Selective ion removal, purification, and resource recovery
company logo
DIAION resins support water purification, wastewater treatment, pharmaceutical, food, and semiconductor applications Efficient purification, selective separation, and high-purity water
company logo
TRILITE resins enable water treatment and separation across pharmaceutical, semiconductor, and catalyst applications Ultrapure water, contaminant removal, and efficient purification

Logos and trademarks shown above are the property of their respective owners. Their use here is for informational and illustrative purposes only.

MARKET ECOSYSTEM

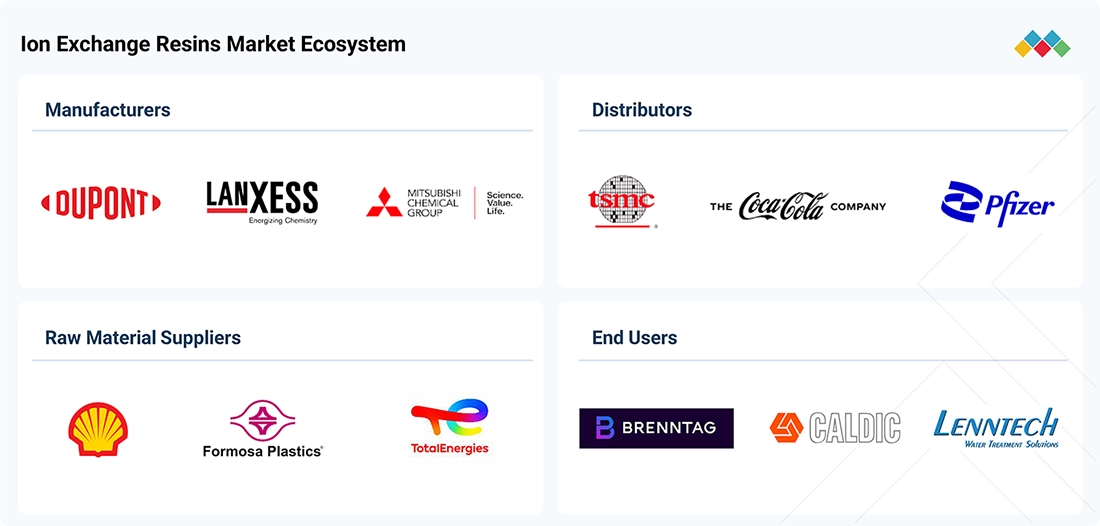
The ion exchange resins ecosystem comprises raw material suppliers, manufacturers, distributors, and end users. Key ion exchange resin manufacturers include DuPont, LANXESS, and Mitsubishi Chemical Group Corporation; key raw material suppliers include Shell plc, TotalEnergies SE, and Formosa Plastics Corporation; key distributors include Brenntag, Lenntech, and Caldic B.V.; and key end users include TSMC, Pfizer, and The Coca-Cola Company. Raw material suppliers provide chemicals to manufacturers; manufacturers research and develop final products for use across various industries; and intermediaries and distributors link manufacturers with end users by supplying the final products. Together, these stakeholders deliver final products to end users across different industries. The value chain spans raw material procurement, the manufacturing of end products, and distribution to end users across various end-use industries.

ion-exchange-resins-market Ecosystem

Logos and trademarks shown above are the property of their respective owners. Their use here is for informational and illustrative purposes only.

MARKET SEGMENTS

ion-exchange-resins-market Segments

Source: Secondary Research, Interviews with Experts, MarketsandMarkets Analysis

Ion Exchange Resins Market, by Type

Cationic resins are extensively used in water softening and purification applications, and as acid catalysts, in both domestic and industrial sectors. The water treatment process depends on the total dissolved solids present in the water or solution, whether ion exchange or another treatment method is used. Cationic resins are further categorized into strong acid cationic resins and weak acid cationic resins. Strong acid cationic resins dissociate readily, making exchangeable sodium and hydrogen ions available across a broad pH range. This unique property allows strong acid cationic resins to operate independently of the solution's pH, enabling their use in a wide range of applications. These resins are used in the hydrogen form for decationization and in the sodium form for water softening.

Ion Exchange Resins Market, by Application

Water is the fastest-growing application in the ion exchange resins market. Demand for water purification, water softening, and wastewater treatment is rising across the municipal and industrial sectors. Rapid urbanization and industrialization are increasing water consumption and wastewater generation, boosting demand for treatment technologies. Ion exchange resins are highly effective at removing dissolved ions, hardness minerals, and other contaminants from water, helping produce high-purity water. The growing adoption of water recycling and reuse further increases resin demand as industries aim to reduce freshwater consumption and wastewater discharge. Stricter water quality standards and increasing investments in water treatment infrastructure are also supporting the growth of the water segment.

Ion Exchange Resins Market, by End-use Industry

The power industry holds a significant share of the ion exchange resins market, driven by several factors. Ion exchange resins are essential to the water treatment and purification processes that ensure reliable plant operations. In practice, ion exchange resins do the heavy lifting by removing impurities from water that flows through cooling systems, boilers, and steam generation units, which helps prevent scaling and corrosion of equipment. Ion exchange resins are especially critical in power plants, where circulating water must be maintained at very high purity levels to optimize efficiency and extend system lifespan. By employing both cation and anion exchange resins, power plants effectively treat water to meet stringent water quality standards. Thus, ion exchange resins play an important role in maintaining the integrity and performance of water systems in the power industry.

REGION

Asia Pacific to be the fastest-growing region in the global ion exchange resins market during the forecast period

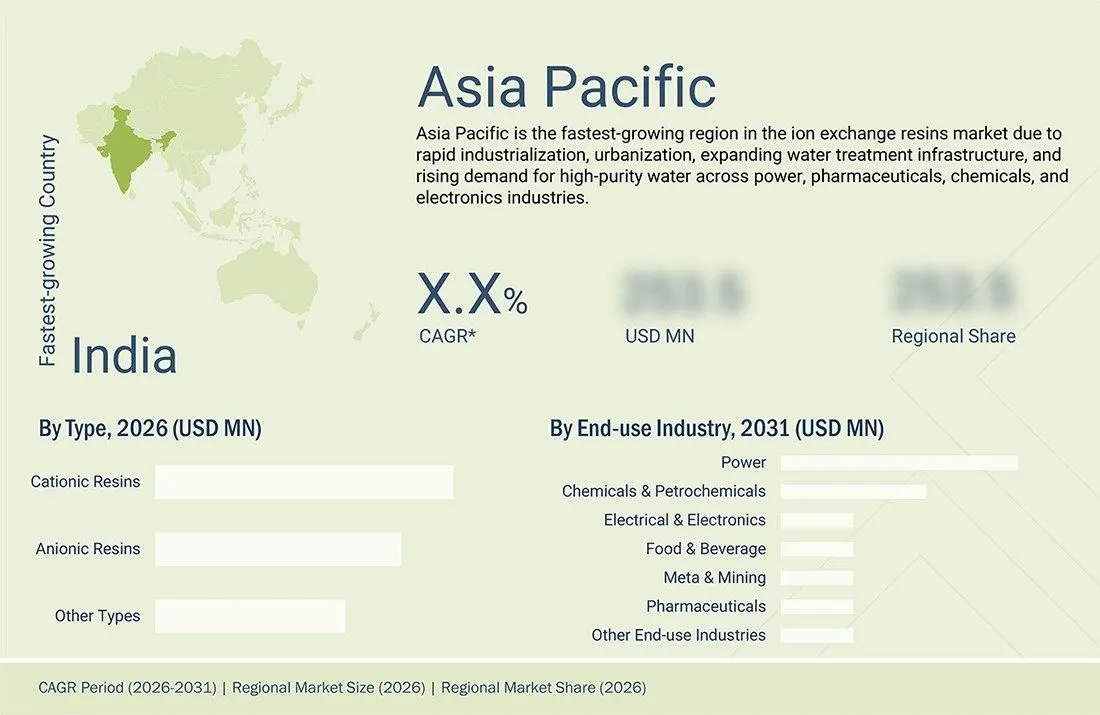
Asia Pacific is the fastest-growing region in the ion exchange resins market. The Asia Pacific market is driven by economic growth in countries such as India, China, Japan, South Korea, Thailand, Indonesia, and Taiwan. The presence of highly populated countries such as China and India, coupled with increasing demand from various end-use industries, is driving demand for ion exchange resins in the region. As some of the world's most populous countries, China, India, Indonesia, and South Korea consistently generate demand for ion exchange resins in water treatment applications. Moreover, these countries are major manufacturers and exporters of chemicals & petrochemicals, pharmaceuticals, food & beverage, and electronic products, contributing significantly to the growth of the ion exchange resins market in the region. The region has become an attractive destination for investors to set up manufacturing facilities, owing to the easy availability of raw materials and low labor costs. It has also witnessed significant growth in manufacturing activities due to low manufacturing costs and favorable government policies. In addition, increasing investments in R&D activities are further driving the market in Asia Pacific.

ion-exchange-resins-market Region

ION EXCHANGE RESINS MARKET: COMPANY EVALUATION MATRIX

DuPont (US) is a star player in the ion exchange resins market, offering a broad portfolio of AmberLite ion exchange resins for water treatment, power, pharmaceutical, food & beverage, and industrial applications. Its manufacturing facilities, deep application expertise, and global customer base keep DuPont in a strong market position. JACOBI RESINS (Sweden) is an emerging leader that is expanding its ion exchange resin portfolio, with a focus on water treatment, industrial purification, and specialty separation applications. The company invests in resin technology, new applications, and global distribution to meet the growing demand for water purification and resource recovery.

ion-exchange-resins-market Evaluation Metrics

Source: Secondary Research, Interviews with Experts, MarketsandMarkets Analysis

KEY MARKET PLAYERS

MARKET SCOPE

REPORT METRIC DETAILS
Market Size in 2025 (Value) USD 2.24 Billion
Market Size in 2026 (Value) USD 2.34 Billion
Market Forecast in 2031 (Value) USD 2.97 Billion
Growth Rate CAGR of 4.8% from 2026 to 2031
Years Considered 2022–2031
Base Year 2025
Forecast Period 2026–2031
Units Considered Value (USD Million/Billion), Volume (Thousand Liters)
Report Coverage Revenue Forecast, Company Ranking, Competitive Landscape, Growth Factors, and Trends
Segments Covered
  • Type:
    • Cationic Resins
    • Anionic Resins
    • Other Types
  • Application:
    • Water
    • Non-water
  • End-use Industry:
    • Power
    • Chemicals & Petrochemicals
    • Food & Beverage
    • Pharmaceuticals
    • Electrical & Electronics
    • Metal & Mining
    • Other End-use Industries
Regions Covered North America, Asia Pacific, Europe, South America, and Middle East & Africa

WHAT IS IN IT FOR YOU: ION EXCHANGE RESINS MARKET REPORT CONTENT GUIDE

ion-exchange-resins-market Content Guide

DELIVERED CUSTOMIZATIONS

We have successfully delivered the following deep-dive customizations:

CLIENT REQUEST CUSTOMIZATION DELIVERED VALUE ADDS
Ion Exchange Resin Manufacturers Competitive benchmarking of resin grades, production capacities, product portfolios, technologies, pricing trends, and regional demand across applications Optimize product portfolios, identify growth opportunities, strengthen competitive positioning, and support strategic planning
Distributors & Channel Partners Regional demand analysis, supplier comparison, inventory planning, and end-user purchasing trends by resin type, application, and geography Optimize product sourcing, improve inventory management, expand customer reach, and increase sales opportunities
Raw Material Suppliers Assessment of raw material demand by resin type, customer requirements, manufacturing trends, and regional consumption patterns Identify growth segments, strengthen partnerships, and optimize production
Water Treatment Companies Resin selection analysis based on water quality, treatment requirements, operating conditions, and application specifications Improve treatment efficiency, optimize resin selection, reduce operating costs, and enhance water quality
Power, Pharmaceutical, Chemical, and Food & Beverage Companies Comparison of ion exchange resin solutions based on performance, selectivity, regeneration, operating costs, and lifecycle requirements Improve purification performance, reduce maintenance costs, and enhance operational efficiency

RECENT DEVELOPMENTS

  • September 2026 : Ecolab opened a resin manufacturing facility in Quzhou, China, expanding its production capacity for purification resins. The new plant strengthens Ecolab's capabilities in resin-based separation and purification applications across the environmental and infrastructure sectors. The plant began shipping to customers in July 2026 and includes a co-located research, development, and engineering center. This investment enhances Ecolab's capacity to supply ion exchange resins and related purification solutions while improving production efficiency, supporting innovation, and shortening customer lead times.
  • July 2026 : DuPont launched a Direct Lithium Extraction portfolio comprising more than 20 products, including DuPont AmberLite ion exchange resins. The portfolio combines ion exchange resins with sorbents, nanofiltration, reverse osmosis, and ultrafiltration to help extract, purify, and concentrate lithium from brine. The launch expands the use of ion exchange resins in Direct Lithium Extraction and offers customized separation solutions for a wide range of brine types, helping meet the growing demand for lithium recovery technologies.
  • January 2026 : DuPont launched AmberLite FPA57, a weak base anion exchange resin designed for organic acid purification. The resin offers enhanced total exchange capacity, greater fouling resistance, and improved physical stability, delivering 5–10% longer cycle times and more consistent deashing performance. AmberLite FPA57 is designed to purify lactic and citric acids by removing weak acids, color bodies, and mineral impurities. The launch expanded DuPont's ion exchange resin portfolio and strengthened its offerings for food, beverage, and other organic acid processing applications.


Table of Contents

checkmarkExclusive indicates content/data unique to MarketsandMarkets and not available with any competitors.

TITLE
PAGE NO
1
INTRODUCTION


26
2
EXECUTIVE SUMMARY


31
3
PREMIUM INSIGHTS


36
4
MARKET OVERVIEW
Emerging economies drive nuclear power demand amidst regulatory shifts and rising urbanization challenges.


39
 
4.1
INTRODUCTION


4.2
MARKET DYNAMICS


4.2.1
DRIVERS


4.2.1.1
GROWING URBAN POPULATION IN ASIA PACIFIC


4.2.1.2
INCREASING DEMAND FOR NUCLEAR POWER IN EMERGING ECONOMIES


4.2.1.3
STRINGENT WATER TREATMENT REGULATIONS IN US AND EUROPE


4.2.2
RESTRAINTS


4.2.2.1
VOLATILITY IN RAW MATERIAL PRICES


4.2.2.2
INCREASING COMPETITION FROM REVERSE OSMOSIS MEMBRANE AND OTHER EMERGING TECHNOLOGIES


4.2.3
OPPORTUNITIES


4.2.3.1
EXPANSION OF PFAS-SELECTIVE RESIN APPLICATIONS


4.2.3.2
INCREASING ADOPTION OF WATER RECYCLING AND RE-USE


4.2.4
CHALLENGES


4.2.4.1
RESIN FOULING AND PERFORMANCE DEGRADATION


4.2.4.2
COMPLEX MIXED-CONTAMINANT STREAMS


4.3
PORTER'S FIVE FORCES ANALYSIS


4.3.1
THREAT OF SUBSTITUTES


4.3.2
BARGAINING POWER OF SUPPLIERS


4.3.3
THREAT OF NEW ENTRANTS


4.3.4
BARGAINING POWER OF BUYERS


4.3.5
INTENSITY OF COMPETITIVE RIVALRY


4.4
KEY STAKEHOLDERS AND BUYING CRITERIA


4.4.1
KEY STAKEHOLDERS IN BUYING PROCESS


4.4.2
BUYING CRITERIA


4.5
VALUE CHAIN ANALYSIS


4.5.1
RAW MATERIAL


4.5.2
MANUFACTURER


4.5.3
DISTRIBUTION


4.5.4
END USER


4.6
MACROECONOMIC OUTLOOK


4.6.1
GLOBAL GDP TRENDS


4.6.2
POWER GENERATION STATISTICS


4.7
ECOSYSTEM ANALYSIS


4.8
CASE STUDY ANALYSIS


4.8.1
HELLENIC PETROLEUM SA'S USE OF DUPONT AMBERLITE RESINS


4.8.2
CHLOR-ALKALI BRINE PURIFICATION AT COOGEE CHEMICALS IN LYTTON, AUSTRALIA


4.8.3
REDUCING COSTS AND TREATING HARDNESS IN DRINKING WATER WITH PUROLITE'S ION EXCHANGE RESINS


4.9
REGULATORY LANDSCAPE


4.9.1
REGULATORY BODIES, GOVERNMENT AGENCIES, AND OTHER ORGANIZATIONS


4.10
TECHNOLOGY ANALYSIS


4.10.1
KEY TECHNOLOGIES


4.10.1.1
MIXED BED RESIN


4.10.1.2
CHELATING ION EXCHANGE RESIN


4.10.1.3
MONODISPERSE RESIN


4.10.2
COMPLEMENTARY TECHNOLOGIES


4.10.2.1
MACRORETICULAR TECHNOLOGY


4.10.2.2
INTEGRATION OF ION EXCHANGE RESIN WITH SOLVENT EXTRACTION TECHNOLOGY


4.10.3
ADJACENT TECHNOLOGIES


4.10.3.1
SUSTAINABLE REGENERATION PROCESS


4.10.3.2
RESIN-IN-PULP


4.10.3.3
ADSORPTION TECHNOLOGIES


4.11
TRENDS/DISRUPTIONS IMPACTING CUSTOMER BUSINESS


4.12
TRADE ANALYSIS


4.12.1
IMPORT SCENARIO (HS CODE 391400)


4.12.2
EXPORT SCENARIO (HS CODE 391400)


4.13
KEY CONFERENCES AND EVENTS, 2026–2027


4.14
PRICING ANALYSIS


4.14.1
AVERAGE SELLING PRICE TREND, BY REGION


4.14.2
AVERAGE SELLING PRICE TREND, BY TYPE


4.15
INVESTMENT AND FUNDING SCENARIO


4.16
PATENT ANALYSIS


4.16.1
LEGAL STATUS OF PATENTS


4.16.2
JURISDICTION ANALYSIS


4.17
IMPACT OF AI/GENERATIVE AI


4.17.1
INTRODUCTION


4.17.2
OVERVIEW OF IMPACT


4.17.2.1
ROLE OF GENAI IN TRANSFORMING CHEMICALS INDUSTRY


4.17.2.2
ROLE OF AI IN OPTIMIZING DRUG DISCOVERY AND ION EXCHANGE RESINS


4.17.2.3
IMPACT OF AI ON ION EXCHANGE RESIN MANAGEMENT IN WATER TREATMENT


5
ION EXCHANGE RESINS MARKET, BY TYPE
Market Size & Growth Rate Forecast Analysis to 2031 in USD Million and Liters | 4 Data Tables


70
 
5.1
INTRODUCTION


5.2
CATIONIC RESINS


5.2.1
EXTENSIVE UTILIZATION OF CATIONIC RESINS IN WATER TREATMENT APPLICATIONS TO DRIVE GROWTH


5.3
ANIONIC RESINS


5.3.1
EFFECTIVENESS IN REMOVING NEGATIVELY CHARGED IONS FROM SOLUTIONS TO DRIVE GROWTH


5.4
OTHER TYPES


6
ION EXCHANGE RESINS MARKET, BY APPLICATION
Market Size & Growth Rate Forecast Analysis to 2031 in USD Million and Liters | 4 Data Tables


75
 
6.1
INTRODUCTION


6.2
WATER


6.2.1
GROWTH IN VARIOUS END-USE INDUSTRIES TO DRIVE MARKET


6.2.2
MUNICIPAL


6.2.3
INDUSTRIAL


6.2.4
OTHERS


6.3
NON-WATER


6.3.1
PHARMACEUTICALS AND CHEMICALS & PETROCHEMICALS INDUSTRIES TO DRIVE GROWTH


7
ION EXCHANGE RESINS MARKET, BY END-USE INDUSTRY
Market Size & Growth Rate Forecast Analysis to 2031 in USD Million and Liters | 4 Data Tables


80
 
7.1
INTRODUCTION


7.2
POWER


7.2.1
WATER TREATMENT & PURIFICATION APPLICATION TO DRIVE GROWTH


7.3
CHEMICALS & PETROCHEMICALS


7.3.1
WIDE USE IN WATER TREATMENT, PURIFICATION, AND SEPARATION TO DRIVE GROWTH


7.4
FOOD & BEVERAGE


7.4.1
HIGH-QUALITY WATER REQUIREMENT TO DRIVE GROWTH


7.5
ELECTRICAL & ELECTRONICS


7.5.1
DEMAND FOR HIGH-PERFORMANCE ELECTRONIC COMPONENTS TO DRIVE GROWTH


7.6
PHARMACEUTICALS


7.6.1
ABILITY OF ION EXCHANGE RESINS TO FORM DRUG-RESIN COMPLEXES TO DRIVE GROWTH


7.7
METAL & MINING


7.7.1
NEED FOR WASTEWATER TREATMENT TO DRIVE GROWTH


7.8
OTHER END-USE INDUSTRIES


7.8.1
WATER TREATMENT


7.8.2
AGRICULTURE


7.8.3
TEXTILES


7.8.4
PAPER


7.8.5
OIL & GAS


8
ION EXCHANGE RESINS MARKET, BY REGION
Comprehensive coverage of 8 Regions with country-level deep-dive of 21 Countries | 196 Data Tables.


87
 
8.1
INTRODUCTION


8.2
NORTH AMERICA


8.2.1
US


8.2.1.1
PFAS REMEDIATION AND HIGH-PURITY WATER REQUIREMENTS TO DRIVE THE MARKET


8.2.2
CANADA


8.2.2.1
MUNICIPAL WATER INFRASTRUCTURE UPGRADES TO DRIVE THE MARKET


8.2.3
MEXICO


8.2.3.1
DESALINATION AND INDUSTRIAL WATER TREATMENT TO DRIVE THE MARKET


8.3
EUROPE


8.3.1
GERMANY


8.3.1.1
CHEMICAL INDUSTRY, ULTRAPURE WATER, INDUSTRIAL DEMINERALIZATION TO DRIVE MARKET


8.3.2
FRANCE


8.3.2.1
NUCLEAR POWER WATER TREATMENT AND RADIOACTIVE RESIN MANAGEMENT TO DRIVE MARKET


8.3.3
ITALY


8.3.3.1
SPENT NUCLEAR RESIN TREATMENT AND INDUSTRIAL WATER PURIFICATION TO DRIVE MARKET


8.3.4
UK


8.3.4.1
NUCLEAR WASTEWATER TREATMENT AND PFAS REMOVAL REQUIREMENTS TO DRIVE MARKET


8.3.5
SPAIN


8.3.5.1
SURGE IN DEMAND FOR DESALINATED WATER TO DRIVE GROWTH


8.3.6
RUSSIA


8.3.6.1
PRESENCE OF LARGE POWER INDUSTRY TO DRIVE GROWTH


8.3.7
NETHERLANDS


8.3.7.1
INCREASING DEMAND FOR PURE WATER ACROSS VARIOUS END-USE INDUSTRIES TO DRIVE GROWTH


8.3.8
REST OF EUROPE


8.4
ASIA PACIFIC


8.4.1
CHINA


8.4.1.1
RISING DEMAND FOR NUCLEAR ENERGY TO DRIVE GROWTH


8.4.2
INDIA


8.4.2.1
CONSISTENTLY INCREASING MANUFACTURING OUTPUT TO DRIVE GROWTH


8.4.3
JAPAN


8.4.3.1
ULTRA-HIGH-PURITY WATER REQUIREMENTS IN SEMICONDUCTOR MANUFACTURING TO DRIVE MARKET


8.4.4
SOUTH KOREA


8.4.4.1
INCREASE IN DOMESTIC WASTEWATER AND INDUSTRIAL WASTEWATER TO DRIVE GROWTH


8.4.5
THAILAND


8.4.5.1
INDUSTRIAL PROCESS-WATER PURIFICATION AND BOILER-WATER TREATMENT TO DRIVE THE MARKET


8.4.6
INDONESIA


8.4.6.1
LARGE INFRASTRUCTURE BUDGET TO DRIVE GROWTH


8.4.7
TAIWAN


8.4.7.1
GROWTH OF SEMICONDUCTORS INDUSTRY TO DRIVE GROWTH


8.4.8
REST OF ASIA PACIFIC


8.5
MIDDLE EAST & AFRICA


8.5.1
GCC


8.5.1.1
SAUDI ARABIA


8.5.1.1.1
INCREASING ENERGY CONSUMPTION TO DRIVE GROWTH


8.5.1.2
UAE


8.5.1.2.1
INCREASING DESALINATION OF SEAWATER TO DRIVE GROWTH


8.5.1.3
REST OF GCC


8.5.2
TÜRKIYE


8.5.2.1
GROWING ELECTRICITY DEMAND TO DRIVE GROWTH


8.5.3
SOUTH AFRICA


8.5.3.1
ABUNDANT NATURAL RESOURCES, R&D CAPABILITIES, AND ESTABLISHED MANUFACTURING BASE TO DRIVE GROWTH


8.5.4
REST OF MIDDLE EAST & AFRICA


8.6
SOUTH AMERICA


8.6.1
BRAZIL


8.6.1.1
SUGAR-ETHANOL PURIFICATION AND RESOURCE RECOVERY TO DRIVE GROWTH


8.6.2
ARGENTINA


8.6.2.1
SUSTAINABLE ECONOMIC DEVELOPMENT TO DRIVE MARKET


8.6.3
REST OF SOUTH AMERICA


9
COMPETITIVE LANDSCAPE
Uncover strategic moves and market dominance of top industry players and emerging competitors.


172
 
9.1
INTRODUCTION


9.2
KEY PLAYER COMPETITIVE STRATEGIES/RIGHT TO WIN, 2023–2026


9.3
REVENUE ANALYSIS, 2023–2025


9.4
MARKET SHARE ANALYSIS, 2025


9.4.1
DUPONT


9.4.2
LANXESS


9.4.3
ECOLAB


9.4.4
MITSUBISHI CHEMICAL GROUP CORPORATION


9.4.5
SAMYANG CORPORATION


9.5
COMPANY VALUATION AND FINANCIAL METRICS


9.6
BRAND/PRODUCT COMPARISON


9.7
COMPANY EVALUATION MATRIX: KEY PLAYERS, 2025


9.7.1
STARS


9.7.2
EMERGING LEADERS


9.7.3
PERVASIVE PLAYERS


9.7.4
PARTICIPANTS


9.7.5
COMPANY FOOTPRINT: KEY PLAYERS, 2025


9.7.5.1
COMPANY FOOTPRINT


9.7.5.2
REGION FOOTPRINT


9.7.5.3
TYPE FOOTPRINT


9.7.5.4
APPLICATION FOOTPRINT


9.7.5.5
END-USE INDUSTRY FOOTPRINT


9.8
COMPANY EVALUATION MATRIX: START-UPS/SMES, 2025


9.8.1
PROGRESSIVE COMPANIES


9.8.2
RESPONSIVE COMPANIES


9.8.3
DYNAMIC COMPANIES


9.8.4
STARTING BLOCKS


9.8.5
COMPETITIVE BENCHMARKING: START-UPS/SMES, 2025


9.8.5.1
LIST OF START-UPS/SMES


9.8.5.2
COMPETITIVE BENCHMARKING OF START-UPS/SMES


9.9
COMPETITIVE SCENARIO


9.9.1
PRODUCT LAUNCHES


9.9.2
DEALS


9.9.3
EXPANSIONS


10
COMPANY PROFILES
In-depth Company Profiles of Leading Market Players with detailed Business Overview, Product and Service Portfolio, Recent Developments, and Unique Analyst Perspective (MnM View)


194
 
10.1
KEY PLAYERS


10.1.1
DUPONT


10.1.1.1
BUSINESS OVERVIEW


10.1.1.2
PRODUCTS OFFERED


10.1.1.3
RECENT DEVELOPMENTS


10.1.1.3.1
PRODUCT LAUNCHES


10.1.1.4
MNM VIEW


10.1.1.4.1
RIGHT TO WIN


10.1.1.4.2
STRATEGIC CHOICES


10.1.1.4.3
WEAKNESSES AND COMPETITIVE THREATS


10.1.2
LANXESS


10.1.3
ECOLAB (PUROLITE)


10.1.4
MITSUBISHI CHEMICAL GROUP CORPORATION


10.1.5
SAMYANG CORPORATION


10.1.6
ION EXCHANGE INDIA (IEI)


10.1.7
JACOBI RESINS


10.1.8
THERMAX LIMITED


10.1.9
OVIVO


10.1.10
SUNRESIN NEW MATERIALS CO., LTD.


10.2
OTHER PLAYERS


10.2.1
RESINTECH, INC.


10.2.2
EVOQUA WATER TECHNOLOGIES LLC


10.2.3
ALDEX CHEMICAL COMPANY, LTD.


10.2.4
GFS CHEMICALS, INC.


10.2.5
SUQING GROUP


10.2.6
APPLEXION


10.2.7
ANHUI SANXING RESIN TECHNOLOGY CO., LTD.


10.2.8
RESINDION S.R.L.


10.2.9
KOVALUS SEPARATION SOLUTIONS


10.2.10
ACURO ORGANICS LIMITED


10.2.11
WESTERN CARBON & CHEMICALS


10.2.12
DOSHION POLYSCIENCE PVT. LTD.


10.2.13
AQUAFILSEP


10.2.14
GRAVER TECHNOLOGIES


10.2.15
HYDROFLUX


11
RESEARCH METHODOLOGY


244
 
11.1
RESEARCH DATA


11.1.1
SECONDARY DATA


11.1.1.1
KEY SECONDARY SOURCES


11.1.1.2
KEY DATA FROM SECONDARY SOURCES


11.1.2
PRIMARY DATA


11.1.2.1
KEY DATA FROM PRIMARY SOURCES


11.1.2.2
KEY INDUSTRY INSIGHTS


11.1.2.3
BREAKDOWN OF INTERVIEWS WITH EXPERTS


11.2
MARKET SIZE ESTIMATION


11.2.1
BOTTOM-UP APPROACH


11.2.2
TOP-DOWN APPROACH


11.3
DATA TRIANGULATION


11.4
FACTOR ANALYSIS


11.5
GROWTH FORECAST


11.5.1
SUPPLY SIDE


11.5.2
DEMAND SIDE


11.6
RESEARCH ASSUMPTIONS


11.7
RESEARCH LIMITATIONS


11.8
RISK ASSESSMENT


12
APPENDIX


253
 
12.1
DISCUSSION GUIDE


12.2
KNOWLEDGESTORE: MARKETSANDMARKETS’ SUBSCRIPTION PORTAL


12.3
CUSTOMIZATION OPTIONS


12.4
RELATED REPORTS


12.5
AUTHOR DETAILS


LIST OF TABLES


TABLE 1
ION EXCHANGE RESINS MARKET: INCLUSIONS AND EXCLUSIONS


TABLE 2
IMPACT OF PORTER'S FIVE FORCES ON ION EXCHANGE RESINS MARKET


TABLE 3
INFLUENCE OF STAKEHOLDERS ON BUYING PROCESS, BY END-USE INDUSTRY (%)


TABLE 4
KEY BUYING CRITERIA, BY TOP 3 END-USE INDUSTRIES


TABLE 5
PROJECTED REAL GDP GROWTH (ANNUAL PERCENT CHANGE) OF KEY COUNTRIES, 2021–2030


TABLE 6
POWER GENERATED IN KEY COUNTRIES, 2023–2025, TERAWATT HOUR (TWH)


TABLE 7
ROLE OF COMPANIES IN ION EXCHANGE RESINS MARKET ECOSYSTEM


TABLE 8
ASIA PACIFIC: LIST OF REGULATORY BODIES, GOVERNMENT AGENCIES, AND OTHER ORGANIZATIONS


TABLE 9
EUROPE: LIST OF REGULATORY BODIES, GOVERNMENT AGENCIES, AND OTHER ORGANIZATIONS


TABLE 10
NORTH AMERICA: LIST OF REGULATORY BODIES, GOVERNMENT AGENCIES, AND OTHER ORGANIZATIONS


TABLE 11
MIDDLE EAST & AFRICA: LIST OF REGULATORY BODIES, GOVERNMENT AGENCIES, AND OTHER ORGANIZATIONS


TABLE 12
SOUTH AMERICA: LIST OF REGULATORY BODIES, GOVERNMENT AGENCIES, AND OTHER ORGANIZATIONS


TABLE 13
IMPORT SCENARIO FOR HS CODE 391400-COMPLIANT PRODUCTS, BY COUNTRY, 2021–2025 (USD MILLION)


TABLE 14
EXPORT SCENARIO FOR HS CODE 391400-COMPLIANT PRODUCTS, BY COUNTRY, 2021–2025 (USD MILLION)


TABLE 15
ION EXCHANGE RESINS MARKET: KEY CONFERENCES AND EVENTS, 2026–2027


TABLE 16
ION EXCHANGE RESINS MARKET, BY TYPE, 2022–2025 (THOUSAND LITERS)


TABLE 17
ION EXCHANGE RESINS MARKET, BY TYPE, 2026–2031 (THOUSAND LITERS)


TABLE 18
ION EXCHANGE RESINS MARKET, BY TYPE, 2022–2025 (USD MILLION)


TABLE 19
ION EXCHANGE RESINS MARKET, BY TYPE, 2026–2031 (USD MILLION)


TABLE 20
ION EXCHANGE RESINS MARKET, BY APPLICATION, 2022–2025 (THOUSAND LITERS)


TABLE 21
ION EXCHANGE RESINS MARKET, BY APPLICATION, 2026–2031 (THOUSAND LITERS)


TABLE 22
ION EXCHANGE RESINS MARKET, BY APPLICATION, 2022–2025 (USD MILLION)


TABLE 23
ION EXCHANGE RESINS MARKET, BY APPLICATION, 2026–2031 (USD MILLION)


TABLE 24
ION EXCHANGE RESINS MARKET, BY END-USE INDUSTRY, 2022–2025 (THOUSAND LITERS)


TABLE 25
ION EXCHANGE RESINS MARKET, BY END-USE INDUSTRY, 2026–2031 (THOUSAND LITERS)


TABLE 26
ION EXCHANGE RESINS MARKET, BY END-USE INDUSTRY, 2022–2025 (USD MILLION)


TABLE 27
ION EXCHANGE RESINS MARKET, BY END-USE INDUSTRY, 2026–2031 (USD MILLION)


TABLE 28
ION EXCHANGE RESINS MARKET, BY REGION, 2022–2025 (THOUSAND LITERS)


TABLE 29
ION EXCHANGE RESINS MARKET, BY REGION, 2026–2031 (THOUSAND LITERS)


TABLE 30
ION EXCHANGE RESINS MARKET, BY REGION, 2022–2025 (USD MILLION)


TABLE 31
ION EXCHANGE RESINS MARKET, BY REGION, 2026–2031 (USD MILLION)


TABLE 32
NORTH AMERICA: ION EXCHANGE RESINS MARKET, BY COUNTRY, 2022–2025 (THOUSAND LITERS)


TABLE 33
NORTH AMERICA: ION EXCHANGE RESINS MARKET, BY COUNTRY, 2026–2031 (THOUSAND LITERS)


TABLE 34
NORTH AMERICA: ION EXCHANGE RESINS MARKET, BY COUNTRY, 2022–2025 (USD MILLION)


TABLE 35
NORTH AMERICA: ION EXCHANGE RESINS MARKET, BY COUNTRY, 2026–2031 (USD MILLION)


TABLE 36
NORTH AMERICA: ION EXCHANGE RESINS MARKET, BY TYPE, 2022–2025 (THOUSAND LITERS)


TABLE 37
NORTH AMERICA: ION EXCHANGE RESINS MARKET, BY TYPE, 2026–2031 (THOUSAND LITERS)


TABLE 38
NORTH AMERICA: ION EXCHANGE RESINS MARKET, BY TYPE, 2022–2025 (USD MILLION)


TABLE 39
NORTH AMERICA: ION EXCHANGE RESINS MARKET, BY TYPE, 2026–2031 (USD MILLION)


TABLE 40
NORTH AMERICA: ION EXCHANGE RESINS MARKET, BY APPLICATION, 2022–2025 (THOUSAND LITERS)


TABLE 41
NORTH AMERICA: ION EXCHANGE RESINS MARKET, BY APPLICATION, 2026–2031 (THOUSAND LITERS)


TABLE 42
NORTH AMERICA: ION EXCHANGE RESINS MARKET, BY APPLICATION, 2022–2025 (USD MILLION)


TABLE 43
NORTH AMERICA: ION EXCHANGE RESINS MARKET, BY APPLICATION, 2026–2031 (USD MILLION)


TABLE 44
NORTH AMERICA: ION EXCHANGE RESINS MARKET, BY END-USE INDUSTRY, 2022–2025 (THOUSAND LITERS)


TABLE 45
NORTH AMERICA: ION EXCHANGE RESINS MARKET, BY END-USE INDUSTRY, 2026–2031 (THOUSAND LITERS)


TABLE 46
NORTH AMERICA: ION EXCHANGE RESINS MARKET, BY END-USE INDUSTRY, 2022–2025 (USD MILLION)


TABLE 47
NORTH AMERICA: ION EXCHANGE RESINS MARKET, BY END-USE INDUSTRY, 2026–2031 (USD MILLION)


TABLE 48
US: ION EXCHANGE RESINS MARKET, BY END-USE INDUSTRY, 2022–2025 (THOUSAND LITERS)


TABLE 49
US: ION EXCHANGE RESINS MARKET, BY END-USE INDUSTRY, 2026–2031 (THOUSAND LITERS)


TABLE 50
US: ION EXCHANGE RESINS MARKET, BY END-USE INDUSTRY, 2022–2025 (USD MILLION)


TABLE 51
US: ION EXCHANGE RESINS MARKET, BY END-USE INDUSTRY, 2026–2031 (USD MILLION)


TABLE 52
CANADA: ION EXCHANGE RESINS MARKET, BY END-USE INDUSTRY, 2022–2025 (THOUSAND LITERS)


TABLE 53
CANADA: ION EXCHANGE RESINS MARKET, BY END-USE INDUSTRY, 2026–2031 (THOUSAND LITERS)


TABLE 54
CANADA: ION EXCHANGE RESINS MARKET, BY END-USE INDUSTRY, 2022–2025 (USD MILLION)


TABLE 55
CANADA: ION EXCHANGE RESINS MARKET, BY END-USE INDUSTRY, 2026–2031 (USD MILLION)


TABLE 56
MEXICO: ION EXCHANGE RESINS MARKET, BY END-USE INDUSTRY, 2022–2025 (THOUSAND LITERS)


TABLE 57
MEXICO: ION EXCHANGE RESINS MARKET, BY END-USE INDUSTRY, 2026–2031 (THOUSAND LITERS)


TABLE 58
MEXICO: ION EXCHANGE RESINS MARKET, BY END-USE INDUSTRY, 2022–2025 (USD MILLION)


TABLE 59
MEXICO: ION EXCHANGE RESINS MARKET, BY END-USE INDUSTRY, 2026–2031 (USD MILLION)


TABLE 60
EUROPE: ION EXCHANGE RESINS MARKET, BY COUNTRY, 2022–2025 (THOUSAND LITERS)


TABLE 61
EUROPE: ION EXCHANGE RESINS MARKET, BY COUNTRY, 2026–2031 (THOUSAND LITERS)


TABLE 62
EUROPE: ION EXCHANGE RESINS MARKET, BY COUNTRY, 2022–2025 (USD MILLION)


TABLE 63
EUROPE: ION EXCHANGE RESINS MARKET, BY COUNTRY, 2026–2031 (USD MILLION)


TABLE 64
EUROPE: ION EXCHANGE RESINS MARKET, BY TYPE, 2022–2025 (THOUSAND LITERS)


TABLE 65
EUROPE: ION EXCHANGE RESINS MARKET, BY TYPE, 2026–2031 (THOUSAND LITERS)


TABLE 66
EUROPE: ION EXCHANGE RESINS MARKET, BY TYPE, 2022–2025 (USD MILLION)


TABLE 67
EUROPE: ION EXCHANGE RESINS MARKET, BY TYPE, 2026–2031 (USD MILLION)


TABLE 68
EUROPE: ION EXCHANGE RESINS MARKET, BY APPLICATION, 2022–2025 (THOUSAND LITERS)


TABLE 69
EUROPE: ION EXCHANGE RESINS MARKET, BY APPLICATION, 2026–2031 (THOUSAND LITERS)


TABLE 70
EUROPE: ION EXCHANGE RESINS MARKET, BY APPLICATION, 2022–2025 (USD MILLION)


TABLE 71
EUROPE: ION EXCHANGE RESINS MARKET, BY APPLICATION, 2026–2031 (USD MILLION)


TABLE 72
EUROPE: ION EXCHANGE RESINS MARKET, BY END-USE INDUSTRY, 2022–2025 (THOUSAND LITERS)


TABLE 73
EUROPE: ION EXCHANGE RESINS MARKET, BY END-USE INDUSTRY, 2026–2031 (THOUSAND LITERS)


TABLE 74
EUROPE: ION EXCHANGE RESINS MARKET, BY END-USE INDUSTRY, 2022–2025 (USD MILLION)


TABLE 75
EUROPE: ION EXCHANGE RESINS MARKET, BY END-USE INDUSTRY, 2026–2031 (USD MILLION)


TABLE 76
GERMANY: ION EXCHANGE RESINS MARKET, BY END-USE INDUSTRY, 2022–2025 (THOUSAND LITERS)


TABLE 77
GERMANY: ION EXCHANGE RESINS MARKET, BY END-USE INDUSTRY, 2026–2031 (THOUSAND LITERS)


TABLE 78
GERMANY: ION EXCHANGE RESINS MARKET, BY END-USE INDUSTRY, 2022–2025 (USD MILLION)


TABLE 79
GERMANY: ION EXCHANGE RESINS MARKET, BY END-USE INDUSTRY, 2026–2031 (USD MILLION)


TABLE 80
FRANCE: ION EXCHANGE RESINS MARKET, BY END-USE INDUSTRY, 2022–2025 (THOUSAND LITERS)


TABLE 81
FRANCE: ION EXCHANGE RESINS MARKET, BY END-USE INDUSTRY, 2026–2031 (THOUSAND LITERS)


TABLE 82
FRANCE: ION EXCHANGE RESINS MARKET, BY END-USE INDUSTRY, 2022–2025 (USD MILLION)


TABLE 83
FRANCE: ION EXCHANGE RESINS MARKET, BY END-USE INDUSTRY, 2026–2031 (USD MILLION)


TABLE 84
ITALY: ION EXCHANGE RESINS MARKET, BY END-USE INDUSTRY, 2022–2025 (THOUSAND LITERS)


TABLE 85
ITALY: ION EXCHANGE RESINS MARKET, BY END-USE INDUSTRY, 2026–2031 (THOUSAND LITERS)


TABLE 86
ITALY: ION EXCHANGE RESINS MARKET, BY END-USE INDUSTRY, 2022–2025 (USD MILLION)


TABLE 87
ITALY: ION EXCHANGE RESINS MARKET, BY END-USE INDUSTRY, 2026–2031 (USD MILLION)


TABLE 88
UK: ION EXCHANGE RESINS MARKET, BY END-USE INDUSTRY, 2022–2025 (THOUSAND LITERS)


TABLE 89
UK: ION EXCHANGE RESINS MARKET, BY END-USE INDUSTRY, 2026–2031 (THOUSAND LITERS)


TABLE 90
UK: ION EXCHANGE RESINS MARKET, BY END-USE INDUSTRY, 2022–2025 (USD MILLION)


TABLE 91
UK: ION EXCHANGE RESINS MARKET, BY END-USE INDUSTRY, 2026–2031 (USD MILLION)


TABLE 92
SPAIN: ION EXCHANGE RESINS MARKET, BY END-USE INDUSTRY, 2022–2025 (THOUSAND LITERS)


TABLE 93
SPAIN: ION EXCHANGE RESINS MARKET, BY END-USE INDUSTRY, 2026–2031 (THOUSAND LITERS)


TABLE 94
SPAIN: ION EXCHANGE RESINS MARKET, BY END-USE INDUSTRY, 2022–2025 (USD MILLION)


TABLE 95
SPAIN: ION EXCHANGE RESINS MARKET, BY END-USE INDUSTRY, 2026–2031 (USD MILLION)


TABLE 96
RUSSIA: ION EXCHANGE RESINS MARKET, BY END-USE INDUSTRY, 2022–2025 (THOUSAND LITERS)


TABLE 97
RUSSIA: ION EXCHANGE RESINS MARKET, BY END-USE INDUSTRY, 2026–2031 (THOUSAND LITERS)


TABLE 98
RUSSIA: ION EXCHANGE RESINS MARKET, BY END-USE INDUSTRY, 2022–2025 (USD MILLION)


TABLE 99
RUSSIA: ION EXCHANGE RESINS MARKET, BY END-USE INDUSTRY, 2026–2031 (USD MILLION)


TABLE 100
NETHERLANDS: ION EXCHANGE RESINS MARKET, BY END-USE INDUSTRY, 2022–2025 (THOUSAND LITERS)


TABLE 101
NETHERLANDS: ION EXCHANGE RESINS MARKET, BY END-USE INDUSTRY, 2026–2031 (THOUSAND LITERS)


TABLE 102
NETHERLANDS: ION EXCHANGE RESINS MARKET, BY END-USE INDUSTRY, 2022–2025 (USD MILLION)


TABLE 103
NETHERLANDS: ION EXCHANGE RESINS MARKET, BY END-USE INDUSTRY, 2026–2031 (USD MILLION)


TABLE 104
REST OF EUROPE: ION EXCHANGE RESINS MARKET, BY END-USE INDUSTRY, 2022–2025 (THOUSAND LITERS)


TABLE 105
REST OF EUROPE: ION EXCHANGE RESINS MARKET, BY END-USE INDUSTRY, 2026–2031 (THOUSAND LITERS)


TABLE 106
REST OF EUROPE: ION EXCHANGE RESINS MARKET, BY END-USE INDUSTRY, 2022–2025 (USD MILLION)


TABLE 107
REST OF EUROPE: ION EXCHANGE RESINS MARKET, BY END-USE INDUSTRY, 2026–2031 (USD MILLION)


TABLE 108
ASIA PACIFIC: ION EXCHANGE RESINS MARKET, BY COUNTRY, 2022–2025 (THOUSAND LITERS)


TABLE 109
ASIA PACIFIC: ION EXCHANGE RESINS MARKET, BY COUNTRY, 2026–2031 (THOUSAND LITERS)


TABLE 110
ASIA PACIFIC: ION EXCHANGE RESINS MARKET, BY COUNTRY, 2022–2025 (USD MILLION)


TABLE 111
ASIA PACIFIC: ION EXCHANGE RESINS MARKET, BY COUNTRY, 2026–2031 (USD MILLION)


TABLE 112
ASIA PACIFIC: ION EXCHANGE RESINS MARKET, BY TYPE, 2022–2025 (THOUSAND LITERS)


TABLE 113
ASIA PACIFIC: ION EXCHANGE RESINS MARKET, BY TYPE, 2026–2031 (THOUSAND LITERS)


TABLE 114
ASIA PACIFIC: ION EXCHANGE RESINS MARKET, BY TYPE, 2022–2025 (USD MILLION)


TABLE 115
ASIA PACIFIC: ION EXCHANGE RESINS MARKET, BY TYPE, 2026–2031 (USD MILLION)


TABLE 116
ASIA PACIFIC: ION EXCHANGE RESINS MARKET, BY APPLICATION, 2022–2025 (THOUSAND LITERS)


TABLE 117
ASIA PACIFIC: ION EXCHANGE RESINS MARKET, BY APPLICATION, 2026–2031 (THOUSAND LITERS)


TABLE 118
ASIA PACIFIC: ION EXCHANGE RESINS MARKET, BY APPLICATION, 2022–2025 (USD MILLION)


TABLE 119
ASIA PACIFIC: ION EXCHANGE RESINS MARKET, BY APPLICATION, 2026–2031 (USD MILLION)


TABLE 120
ASIA PACIFIC: ION EXCHANGE RESINS MARKET, BY END-USE INDUSTRY, 2022–2025 (THOUSAND LITERS)


TABLE 121
ASIA PACIFIC: ION EXCHANGE RESINS MARKET, BY END-USE INDUSTRY, 2026–2031 (THOUSAND LITERS)


TABLE 122
ASIA PACIFIC: ION EXCHANGE RESINS MARKET, BY END-USE INDUSTRY, 2022–2025 (USD MILLION)


TABLE 123
ASIA PACIFIC: ION EXCHANGE RESINS MARKET, BY END-USE INDUSTRY, 2026–2031 (USD MILLION)


TABLE 124
CHINA: ION EXCHANGE RESINS MARKET, BY END-USE INDUSTRY, 2022–2025 (THOUSAND LITERS)


TABLE 125
CHINA: ION EXCHANGE RESINS MARKET, BY END-USE INDUSTRY, 2026–2031 (THOUSAND LITERS)


TABLE 126
CHINA: ION EXCHANGE RESINS MARKET, BY END-USE INDUSTRY, 2022–2025 (USD MILLION)


TABLE 127
CHINA: ION EXCHANGE RESINS MARKET, BY END-USE INDUSTRY, 2026–2031 (USD MILLION)


TABLE 128
INDIA: ION EXCHANGE RESINS MARKET, BY END-USE INDUSTRY, 2022–2025 (THOUSAND LITERS)


TABLE 129
INDIA: ION EXCHANGE RESINS MARKET, BY END-USE INDUSTRY, 2026–2031 (THOUSAND LITERS)


TABLE 130
INDIA: ION EXCHANGE RESINS MARKET, BY END-USE INDUSTRY, 2022–2025 (USD MILLION)


TABLE 131
INDIA: ION EXCHANGE RESINS MARKET, BY END-USE INDUSTRY, 2026–2031 (USD MILLION)


TABLE 132
JAPAN: ION EXCHANGE RESINS MARKET, BY END-USE INDUSTRY, 2022–2025 (THOUSAND LITERS)


TABLE 133
JAPAN: ION EXCHANGE RESINS MARKET, BY END-USE INDUSTRY, 2026–2031 (THOUSAND LITERS)


TABLE 134
JAPAN: ION EXCHANGE RESINS MARKET, BY END-USE INDUSTRY, 2022–2025 (USD MILLION)


TABLE 135
JAPAN: ION EXCHANGE RESINS MARKET, BY END-USE INDUSTRY, 2026–2031 (USD MILLION)


TABLE 136
SOUTH KOREA: ION EXCHANGE RESINS MARKET, BY END-USE INDUSTRY, 2022–2025 (THOUSAND LITERS)


TABLE 137
SOUTH KOREA: ION EXCHANGE RESINS MARKET, BY END-USE INDUSTRY, 2026–2031 (THOUSAND LITERS)


TABLE 138
SOUTH KOREA: ION EXCHANGE RESINS MARKET, BY END-USE INDUSTRY, 2022–2025 (USD MILLION)


TABLE 139
SOUTH KOREA: ION EXCHANGE RESINS MARKET, BY END-USE INDUSTRY, 2026–2031 (USD MILLION)


TABLE 140
THAILAND: ION EXCHANGE RESINS MARKET, BY END-USE INDUSTRY, 2022–2025 (THOUSAND LITERS)


TABLE 141
THAILAND: ION EXCHANGE RESINS MARKET, BY END-USE INDUSTRY, 2026–2031 (THOUSAND LITERS)


TABLE 142
THAILAND: ION EXCHANGE RESINS MARKET, BY END-USE INDUSTRY, 2022–2025 (USD MILLION)


TABLE 143
THAILAND: ION EXCHANGE RESINS MARKET, BY END-USE INDUSTRY, 2026–2031 (USD MILLION)


TABLE 144
INDONESIA: ION EXCHANGE RESINS MARKET, BY END-USE INDUSTRY, 2022–2025 (THOUSAND LITERS)


TABLE 145
INDONESIA: ION EXCHANGE RESINS MARKET, BY END-USE INDUSTRY, 2026–2031 (THOUSAND LITERS)


TABLE 146
INDONESIA: ION EXCHANGE RESINS MARKET, BY END-USE INDUSTRY, 2022–2025 (USD MILLION)


TABLE 147
INDONESIA: ION EXCHANGE RESINS MARKET, BY END-USE INDUSTRY, 2026–2031 (USD MILLION)


TABLE 148
TAIWAN: ION EXCHANGE RESINS MARKET, BY END-USE INDUSTRY, 2022–2025 (THOUSAND LITERS)


TABLE 149
TAIWAN: ION EXCHANGE RESINS MARKET, BY END-USE INDUSTRY, 2026–2031 (THOUSAND LITERS)


TABLE 150
TAIWAN: ION EXCHANGE RESINS MARKET, BY END-USE INDUSTRY, 2022–2025 (USD MILLION)


TABLE 151
TAIWAN: ION EXCHANGE RESINS MARKET, BY END-USE INDUSTRY, 2026–2031 (USD MILLION)


TABLE 152
REST OF ASIA PACIFIC: ION EXCHANGE RESINS MARKET, BY END-USE INDUSTRY, 2022–2025 (THOUSAND LITERS)


TABLE 153
REST OF ASIA PACIFIC: ION EXCHANGE RESINS MARKET, BY END-USE INDUSTRY, 2026–2031 (THOUSAND LITERS)


TABLE 154
REST OF ASIA PACIFIC: ION EXCHANGE RESINS MARKET, BY END-USE INDUSTRY, 2022–2025 (USD MILLION)


TABLE 155
REST OF ASIA PACIFIC: ION EXCHANGE RESINS MARKET, BY END-USE INDUSTRY, 2026–2031 (USD MILLION)


TABLE 156
MIDDLE EAST & AFRICA: ION EXCHANGE RESINS MARKET, BY COUNTRY, 2022–2025 (THOUSAND LITERS)


TABLE 157
MIDDLE EAST & AFRICA: ION EXCHANGE RESINS MARKET, BY COUNTRY, 2026–2031 (THOUSAND LITERS)


TABLE 158
MIDDLE EAST & AFRICA: ION EXCHANGE RESINS MARKET, BY COUNTRY, 2022–2025 (USD MILLION)


TABLE 159
MIDDLE EAST & AFRICA: ION EXCHANGE RESINS MARKET, BY COUNTRY, 2026–2031 (USD MILLION)


TABLE 160
MIDDLE EAST & AFRICA: ION EXCHANGE RESINS MARKET, BY TYPE, 2022–2025 (THOUSAND LITERS)


TABLE 161
MIDDLE EAST & AFRICA: ION EXCHANGE RESINS MARKET, BY TYPE, 2026–2031 (THOUSAND LITERS)


TABLE 162
MIDDLE EAST & AFRICA: ION EXCHANGE RESINS MARKET, BY TYPE, 2022–2025 (USD MILLION)


TABLE 163
MIDDLE EAST & AFRICA: ION EXCHANGE RESINS MARKET, BY TYPE, 2026–2031 (USD MILLION)


TABLE 164
MIDDLE EAST & AFRICA: ION EXCHANGE RESINS MARKET, BY APPLICATION, 2022–2025 (THOUSAND LITERS)


TABLE 165
MIDDLE EAST & AFRICA: ION EXCHANGE RESINS MARKET, BY APPLICATION, 2026–2031 (THOUSAND LITERS)


TABLE 166
MIDDLE EAST & AFRICA: ION EXCHANGE RESINS MARKET, BY APPLICATION, 2022–2025 (USD MILLION)


TABLE 167
MIDDLE EAST & AFRICA: ION EXCHANGE RESINS MARKET, BY APPLICATION, 2026–2031 (USD MILLION)


TABLE 168
MIDDLE EAST & AFRICA: ION EXCHANGE RESINS MARKET, BY END-USE INDUSTRY, 2022–2025 (THOUSAND LITERS)


TABLE 169
MIDDLE EAST & AFRICA: ION EXCHANGE RESINS MARKET, BY END-USE INDUSTRY, 2026–2031 (THOUSAND LITERS)


TABLE 170
MIDDLE EAST & AFRICA: ION EXCHANGE RESINS MARKET, BY END-USE INDUSTRY, 2022–2025 (USD MILLION)


TABLE 171
MIDDLE EAST & AFRICA: ION EXCHANGE RESINS MARKET, BY END-USE INDUSTRY, 2026–2031 (USD MILLION)


TABLE 172
SAUDI ARABIA: ION EXCHANGE RESINS MARKET, BY END-USE INDUSTRY, 2022–2025 (THOUSAND LITERS)


TABLE 173
SAUDI ARABIA: ION EXCHANGE RESINS MARKET, BY END-USE INDUSTRY, 2026–2031 (THOUSAND LITERS)


TABLE 174
SAUDI ARABIA: ION EXCHANGE RESINS MARKET, BY END-USE INDUSTRY, 2022–2025 (USD MILLION)


TABLE 175
SAUDI ARABIA: ION EXCHANGE RESINS MARKET, BY END-USE INDUSTRY, 2026–2031 (USD MILLION)


TABLE 176
UAE: ION EXCHANGE RESINS MARKET, BY END-USE INDUSTRY, 2022–2025 (THOUSAND LITERS)


TABLE 177
UAE: ION EXCHANGE RESINS MARKET, BY END-USE INDUSTRY, 2026–2031 (THOUSAND LITERS)


TABLE 178
UAE: ION EXCHANGE RESINS MARKET, BY END-USE INDUSTRY, 2022–2025 (USD MILLION)


TABLE 179
UAE: ION EXCHANGE RESINS MARKET, BY END-USE INDUSTRY, 2026–2031 (USD MILLION)


TABLE 180
REST OF GCC: ION EXCHANGE RESINS MARKET, BY END-USE INDUSTRY, 2022–2025 (THOUSAND LITERS)


TABLE 181
REST OF GCC: ION EXCHANGE RESINS MARKET, BY END-USE INDUSTRY, 2026–2031 (THOUSAND LITERS)


TABLE 182
REST OF GCC: ION EXCHANGE RESINS MARKET, BY END-USE INDUSTRY, 2022–2025 (USD MILLION)


TABLE 183
REST OF GCC: ION EXCHANGE RESINS MARKET, BY END-USE INDUSTRY, 2026–2031 (USD MILLION)


TABLE 184
TÜRKIYE: ION EXCHANGE RESINS MARKET, BY END-USE INDUSTRY, 2022–2025 (THOUSAND LITERS)


TABLE 185
TÜRKIYE: ION EXCHANGE RESINS MARKET, BY END-USE INDUSTRY, 2026–2031 (THOUSAND LITERS)


TABLE 186
TÜRKIYE: ION EXCHANGE RESINS MARKET, BY END-USE INDUSTRY, 2022–2025 (USD MILLION)


TABLE 187
TÜRKIYE: ION EXCHANGE RESINS MARKET, BY END-USE INDUSTRY, 2026–2031 (USD MILLION)


TABLE 188
SOUTH AFRICA: ION EXCHANGE RESINS MARKET, BY END-USE INDUSTRY, 2022–2025 (THOUSAND LITERS)


TABLE 189
SOUTH AFRICA: ION EXCHANGE RESINS MARKET, BY END-USE INDUSTRY, 2026–2031 (THOUSAND LITERS)


TABLE 190
SOUTH AFRICA: ION EXCHANGE RESINS MARKET, BY END-USE INDUSTRY, 2022–2025 (USD MILLION)


TABLE 191
SOUTH AFRICA: ION EXCHANGE RESINS MARKET, BY END-USE INDUSTRY, 2026–2031 (USD MILLION)


TABLE 192
REST OF MIDDLE EAST & AFRICA: ION EXCHANGE RESINS MARKET, BY END-USE INDUSTRY, 2022–2025 (THOUSAND LITERS)


TABLE 193
REST OF MIDDLE EAST & AFRICA: ION EXCHANGE RESINS MARKET, BY END-USE INDUSTRY, 2026–2031 (THOUSAND LITERS)


TABLE 194
REST OF MIDDLE EAST & AFRICA: ION EXCHANGE RESINS MARKET, BY END-USE INDUSTRY, 2022–2025 (USD MILLION)


TABLE 195
REST OF MIDDLE EAST & AFRICA: ION EXCHANGE RESINS MARKET, BY END-USE INDUSTRY, 2026–2031 (USD MILLION)


TABLE 196
SOUTH AMERICA: ION EXCHANGE RESINS MARKET, BY COUNTRY, 2022–2025 (THOUSAND LITERS)


TABLE 197
SOUTH AMERICA: ION EXCHANGE RESINS MARKET, BY COUNTRY, 2026–2031 (THOUSAND LITERS)


TABLE 198
SOUTH AMERICA: ION EXCHANGE RESINS MARKET, BY COUNTRY, 2022–2025 (USD MILLION)


TABLE 199
SOUTH AMERICA: ION EXCHANGE RESINS MARKET, BY COUNTRY, 2026–2031 (USD MILLION)


TABLE 200
SOUTH AMERICA: ION EXCHANGE RESINS MARKET, BY TYPE, 2022–2025 (THOUSAND LITERS)


TABLE 201
SOUTH AMERICA: ION EXCHANGE RESINS MARKET, BY TYPE, 2026–2031 (THOUSAND LITERS)


TABLE 202
SOUTH AMERICA: ION EXCHANGE RESINS MARKET, BY TYPE, 2022–2025 (USD MILLION)


TABLE 203
SOUTH AMERICA: ION EXCHANGE RESINS MARKET, BY TYPE, 2026–2031 (USD MILLION)


TABLE 204
SOUTH AMERICA: ION EXCHANGE RESINS MARKET, BY APPLICATION, 2022–2025 (THOUSAND LITERS)


TABLE 205
SOUTH AMERICA: ION EXCHANGE RESINS MARKET, BY APPLICATION, 2026–2031 (THOUSAND LITERS)


TABLE 206
SOUTH AMERICA: ION EXCHANGE RESINS MARKET, BY APPLICATION, 2022–2025 (USD MILLION)


TABLE 207
SOUTH AMERICA: ION EXCHANGE RESINS MARKET, BY APPLICATION, 2026–2031 (USD MILLION)


TABLE 208
SOUTH AMERICA: ION EXCHANGE RESINS MARKET, BY END-USE INDUSTRY, 2022–2025 (THOUSAND LITERS)


TABLE 209
SOUTH AMERICA: ION EXCHANGE RESINS MARKET, BY END-USE INDUSTRY, 2026–2031 (THOUSAND LITERS)


TABLE 210
SOUTH AMERICA: ION EXCHANGE RESINS MARKET, BY END-USE INDUSTRY, 2022–2025 (USD MILLION)


TABLE 211
SOUTH AMERICA: ION EXCHANGE RESINS MARKET, BY END-USE INDUSTRY, 2026–2031 (USD MILLION)


TABLE 212
BRAZIL: ION EXCHANGE RESINS MARKET, BY END-USE INDUSTRY, 2022–2025 (THOUSAND LITERS)


TABLE 213
BRAZIL: ION EXCHANGE RESINS MARKET, BY END-USE INDUSTRY, 2026–2031 (THOUSAND LITERS)


TABLE 214
BRAZIL: ION EXCHANGE RESINS MARKET, BY END-USE INDUSTRY, 2022–2025 (USD MILLION)


TABLE 215
BRAZIL: ION EXCHANGE RESINS MARKET, BY END-USE INDUSTRY, 2026–2031 (USD MILLION)


TABLE 216
ARGENTINA: ION EXCHANGE RESINS MARKET, BY END-USE INDUSTRY, 2022–2025 (THOUSAND LITERS)


TABLE 217
ARGENTINA: ION EXCHANGE RESINS MARKET, BY END-USE INDUSTRY, 2026–2031 (THOUSAND LITERS)


TABLE 218
ARGENTINA: ION EXCHANGE RESINS MARKET, BY END-USE INDUSTRY, 2022–2025 (USD MILLION)


TABLE 219
ARGENTINA: ION EXCHANGE RESINS MARKET, BY END-USE INDUSTRY, 2026–2031 (USD MILLION)


TABLE 220
REST OF SOUTH AMERICA: ION EXCHANGE RESINS MARKET, BY END-USE INDUSTRY, 2022–2025 (THOUSAND LITERS)


TABLE 221
REST OF SOUTH AMERICA: ION EXCHANGE RESINS MARKET, BY END-USE INDUSTRY, 2026–2031 (THOUSAND LITERS)


TABLE 222
REST OF SOUTH AMERICA: ION EXCHANGE RESINS MARKET, BY END-USE INDUSTRY, 2022–2025 (USD MILLION)


TABLE 223
REST OF SOUTH AMERICA: ION EXCHANGE RESINS MARKET, BY END-USE INDUSTRY, 2026–2031 (USD MILLION)


TABLE 224
KEY PLAYER STRATEGIES/RIGHT TO WIN, 2023–2026


TABLE 225
ION EXCHANGE RESINS MARKET: DEGREE OF COMPETITION


TABLE 226
REGION FOOTPRINT


TABLE 227
TYPE FOOTPRINT


TABLE 228
APPLICATION FOOTPRINT


TABLE 229
END-USE INDUSTRY FOOTPRINT


TABLE 230
LIST OF START-UPS/SMES


TABLE 231
COMPETITIVE BENCHMARKING OF STARTUPS/SMES


TABLE 232
ION EXCHANGE RESINS MARKET: PRODUCT LAUNCHES, JANUARY 2023–SEPTEMBER 2026


TABLE 233
ION EXCHANGE RESINS MARKET: DEALS, JANUARY 2023–SEPTEMBER 2026


TABLE 234
ION EXCHANGE RESINS MARKET: EXPANSIONS, JANUARY 2023–SEPTEMBER 2026


TABLE 235
DUPONT: COMPANY OVERVIEW


TABLE 236
DUPONT: PRODUCTS OFFERED


TABLE 237
DUPONT: PRODUCT LAUNCHES, JANUARY 2023–SEPTEMBER 2026


TABLE 238
LANXESS: COMPANY OVERVIEW


TABLE 239
LANXESS: PRODUCTS OFFERED


TABLE 240
LANXESS: PRODUCT LAUNCHES, JANUARY 2023–SEPTEMBER 2026


TABLE 241
LANXESS: EXPANSIONS, JANUARY 2023–SEPTEMBER 2026


TABLE 242
ECOLAB: COMPANY OVERVIEW


TABLE 243
ECOLAB: PRODUCTS OFFERED


TABLE 244
ECOLAB: PRODUCT LAUNCHES, JANUARY 2023–SEPTEMBER 2026


TABLE 245
ECOLAB: DEALS, JANUARY 2023–SEPTEMBER 2026


TABLE 246
ECOLAB: EXPANSIONS, JANUARY 2023–SEPTEMBER 2026


TABLE 247
MITSUBISHI CHEMICAL GROUP CORPORATION: COMPANY OVERVIEW


TABLE 248
MITSUBISHI CHEMICAL GROUP CORPORATION: PRODUCTS OFFERED


TABLE 249
MITSUBISHI CHEMICAL GROUP CORPORATION: EXPANSIONS, JANUARY 2023–SEPTEMBER 2026


TABLE 250
SAMYANG CORPORATION: COMPANY OVERVIEW


TABLE 251
SAMYANG CORPORATION: PRODUCTS OFFERED


TABLE 252
IEI: COMPANY OVERVIEW


TABLE 253
IEI: PRODUCTS OFFERED


TABLE 254
JACOBI RESINS: COMPANY OVERVIEW


TABLE 255
JACOBI RESINS: PRODUCTS OFFERED


TABLE 256
THERMAX LIMITED: COMPANY OVERVIEW


TABLE 257
THERMAX LIMITED: PRODUCTS OFFERED


TABLE 258
THERMAX LIMITED: DEALS, JANUARY 2023–SEPTEMBER 2026


TABLE 259
THERMAX LIMITED: EXPANSIONS, JANUARY 2023–SEPTEMBER 2026


TABLE 260
OVIVO: COMPANY OVERVIEW


TABLE 261
OVIVO: PRODUCTS OFFERED


TABLE 262
SUNRESIN NEW MATERIALS CO., LTD.: COMPANY OVERVIEW


TABLE 263
SUNRESIN NEW MATERIALS CO., LTD.: PRODUCTS OFFERED


TABLE 264
RESINTECH, INC.: COMPANY OVERVIEW


TABLE 265
EVOQUA WATER TECHNOLOGIES LLC: COMPANY OVERVIEW


TABLE 266
ALDEX CHEMICAL COMPANY, LTD.: COMPANY OVERVIEW


TABLE 267
GFS CHEMICALS, INC.: COMPANY OVERVIEW


TABLE 268
SUQING GROUP: COMPANY OVERVIEW


TABLE 269
APPLEXION: COMPANY OVERVIEW


TABLE 270
ANHUI SANXING RESIN TECHNOLOGY CO., LTD.: COMPANY OVERVIEW


TABLE 271
RESINDION S.R.L.: COMPANY OVERVIEW


TABLE 272
KOVALUS SEPARATION SOLUTIONS: COMPANY OVERVIEW


TABLE 273
ACURO ORGANICS LIMITED: COMPANY OVERVIEW


TABLE 274
WESTERN CARBON & CHEMICALS: COMPANY OVERVIEW


TABLE 275
DOSHION POLYSCIENCE PVT. LTD.: COMPANY OVERVIEW


TABLE 276
AQUAFILSEP: COMPANY OVERVIEW


TABLE 277
GRAVER TECHNOLOGIES: COMPANY OVERVIEW


TABLE 278
HYDROFLUX: COMPANY OVERVIEW


TABLE 279
INTERVIEWS WITH EXPERTS: DEMAND AND SUPPLY SIDES


LIST OF FIGURES


FIGURE 1
ION EXCHANGE RESINS MARKET SEGMENTATION


FIGURE 2
KEY INSIGHTS AND MARKET HIGHLIGHTS


FIGURE 3
ION EXCHANGE RESINS MARKET, 2026–2031


FIGURE 4
MAJOR STRATEGIES ADOPTED BY KEY PLAYERS IN ION EXCHANGE RESINS MARKET, 2023–2026


FIGURE 5
DISRUPTIONS INFLUENCING GROWTH OF ION EXCHANGE RESINS MARKET


FIGURE 6
HIGH-GROWTH SEGMENTS IN ION EXCHANGE RESINS MARKET, 2026–2031


FIGURE 7
ASIA PACIFIC TO REGISTER HIGHEST CAGR IN ION EXCHANGE RESINS MARKET DURING FORECAST PERIOD


FIGURE 8
ASIA PACIFIC TO REGISTER HIGHEST CAGR DURING FORECAST PERIOD


FIGURE 9
CATIONIC RESINS TO BE LARGEST TYPE SEGMENT DURING FORECAST PERIOD


FIGURE 10
WATER SEGMENT TO ACCOUNT FOR LARGER MARKET SHARE THAN NON-WATER SEGMENT DURING FORECAST PERIOD


FIGURE 11
ELECTRICAL & ELECTRONICS SEGMENT TO WITNESS HIGHEST CAGR DURING FORECAST PERIOD


FIGURE 12
INDIA TO REGISTER HIGHEST CAGR DURING FORECAST PERIOD


FIGURE 13
DRIVERS, RESTRAINTS, OPPORTUNITIES, AND CHALLENGES IN ION EXCHANGE RESINS MARKET


FIGURE 14
ION EXCHANGE RESINS MARKET: PORTER'S FIVE FORCES ANALYSIS


FIGURE 15
INFLUENCE OF STAKEHOLDERS ON BUYING PROCESS, BY TOP 3 END-USE INDUSTRIES


FIGURE 16
KEY BUYING CRITERIA, BY TOP 3 END-USE INDUSTRIES


FIGURE 17
ION EXCHANGE RESINS MARKET VALUE CHAIN


FIGURE 18
ION EXCHANGE RESINS MARKET ECOSYSTEM


FIGURE 19
TRENDS/DISRUPTIONS IMPACTING CUSTOMER BUSINESS


FIGURE 20
IMPORT SCENARIO FOR HS CODE 391400-COMPLIANT PRODUCTS, BY COUNTRY, 2021–2025


FIGURE 21
EXPORT SCENARIO FOR HS CODE 391400-COMPLIANT PRODUCTS, BY COUNTRY, 2021–2025


FIGURE 22
AVERAGE SELLING PRICE TREND, BY REGION, 2023–2025 (USD/LITER)


FIGURE 23
AVERAGE SELLING PRICE TREND, BY TYPE, 2023–2025 (USD/LITER)


FIGURE 24
INVESTMENT AND FUNDING SCENARIO, 2021–2025


FIGURE 25
PATENTS APPLIED AND GRANTED, 2016–2025


FIGURE 26
PATENT ANALYSIS, BY LEGAL STATUS


FIGURE 27
TOP JURISDICTION, BY DOCUMENT


FIGURE 28
CATIONIC RESINS TO ACCOUNT FOR LARGEST MARKET SHARE DURING FORECAST PERIOD


FIGURE 29
WATER APPLICATION TO ACCOUNT FOR LARGER MARKET SHARE DURING FORECAST PERIOD


FIGURE 30
POWER TO BE LARGEST END-USE INDUSTRY DURING FORECAST PERIOD


FIGURE 31
INDIA TO REGISTER HIGHEST GROWTH RATE DURING FORECAST PERIOD


FIGURE 32
NORTH AMERICA: ION EXCHANGE RESINS MARKET SNAPSHOT


FIGURE 33
EUROPE: ION EXCHANGE RESINS MARKET SNAPSHOT


FIGURE 34
ASIA PACIFIC: ION EXCHANGE RESINS MARKET SNAPSHOT


FIGURE 35
REVENUE ANALYSIS OF TOP LISTED/PUBLIC PLAYERS, 2023–2025


FIGURE 36
MARKET SHARE ANALYSIS OF KEY PLAYERS, 2025


FIGURE 37
COMPANY VALUATION (USD BILLION)


FIGURE 38
FINANCIAL METRICS (EV/EBITDA)


FIGURE 39
BRAND/PRODUCT COMPARISON


FIGURE 40
COMPANY EVALUATION MATRIX (KEY PLAYERS), 2025


FIGURE 41
COMPANY FOOTPRINT


FIGURE 42
COMPANY EVALUATION MATRIX (START-UPS/SMES), 2025


FIGURE 43
DUPONT: COMPANY SNAPSHOT


FIGURE 44
LANXESS: COMPANY SNAPSHOT


FIGURE 45
ECOLAB: COMPANY SNAPSHOT


FIGURE 46
MITSUBISHI CHEMICAL GROUP CORPORATION: COMPANY SNAPSHOT


FIGURE 47
SAMYANG CORPORATION: COMPANY SNAPSHOT


FIGURE 48
IEI: COMPANY SNAPSHOT


FIGURE 49
THERMAX LIMITED: COMPANY SNAPSHOT


FIGURE 50
SUNRESIN NEW MATERIALS CO., LTD.: COMPANY SNAPSHOT


FIGURE 51
ION EXCHANGE RESINS MARKET: RESEARCH DESIGN


FIGURE 52
MARKET SIZE ESTIMATION APPROACH: DEMAND SIDE


FIGURE 53
MARKET SIZE ESTIMATION: BOTTOM-UP APPROACH


FIGURE 54
MARKET SIZE ESTIMATION: TOP-DOWN APPROACH


FIGURE 55
ION EXCHANGE RESINS MARKET: DATA TRIANGULATION


Methodology

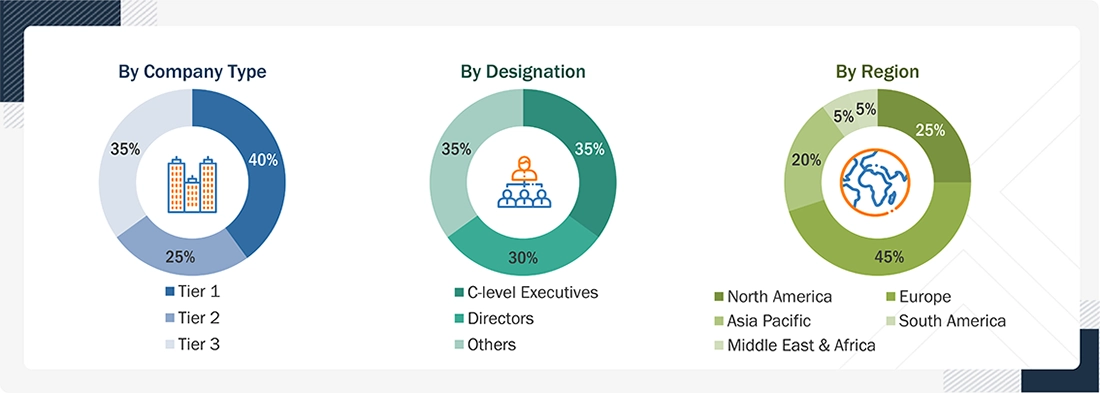
The study involved four major activities to estimate the current size of the global ion exchange resins market. Exhaustive secondary research was conducted to collect information on the ion exchange resins market, the peer product market, and the parent product group market. The next step was to validate these findings, assumptions, and sizes with industry experts across the ion exchange resins value chain through primary research. Both the top-down and bottom-up approaches were employed to estimate the overall size of the ion exchange resins market. After that, market breakdown and data triangulation were used to determine the sizes of different market segments and subsegments.

Secondary Research

For the secondary research, sources such as D&B Hoovers, Factiva, Bloomberg Businessweek, and Dun & Bradstreet were used to identify and collect information for this study of the ion exchange resins market. These sources included annual reports, press releases, and investor presentations from companies; white papers; certified publications; databases; articles by recognized authors; regulatory bodies; and trade directories.

Primary Research

The ion exchange resins market involves various stakeholders along the supply chain, such as raw material suppliers, distributors, end-product manufacturers, buyers, and regulatory bodies. Qualitative and quantitative data were collected through interviews with primary sources from both the supply and demand sides. On the demand side, key participants include opinion leaders, company executives, vice presidents, and CEOs in the market. On the supply side, primary sources consist of associations, institutions, influential opinion leaders, and processing companies involved in the market.

Breakdown of Primary Profiles

Ion Exchange Resins Market 
 Size, and Share

To know about the assumptions considered for the study, download the pdf brochure

Market Size Estimation

The bottom-up and top-down approaches were used to estimate the ion exchange resins market by type, application, end-use industry, and region. The research methodology used to calculate the market size includes the following steps:

  • The key players in the industry and markets were identified through extensive secondary research.
  • In terms of value, the industry’s supply chain and market size were determined through primary and secondary research processes.
  • All percentage shares, splits, and breakdowns were determined using secondary sources and verified through primary sources.
  • All parameters that affect the markets covered in this research study were accounted for, examined in detail, verified through primary research, and analyzed to obtain the final quantitative and qualitative data.
  • The research included reviewing reports, reviews, and newsletters from top market players, as well as extensive interviews with leaders, such as directors and marketing executives, to gather opinions.

The following figure illustrates the overall market size estimation process employed for this study.
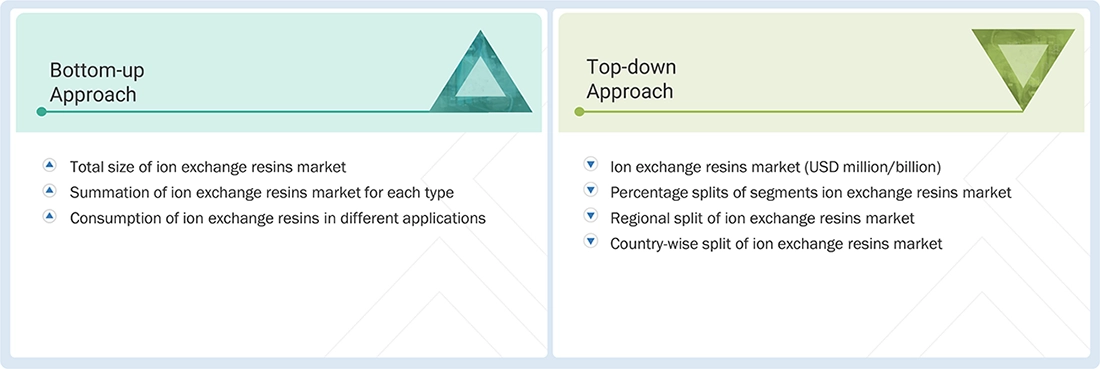
Ion Exchange Resins Market Top Down and Bottom Up Approach

Data Triangulation

After estimating the total size of the ion exchange resins market, the market was divided into multiple segments and subsegments. Data triangulation and breakdown methods were used, where relevant, to refine the overall market analysis and determine precise statistics for all segments. The data was cross-checked by examining factors and trends from both demand and supply perspectives. Additionally, market size validation was performed using top-down and bottom-up approaches.

Market Definition

Ion exchange resins are insoluble polymers prepared by cross-linking polystyrenes that contain various functional groups. They act as a medium for ion exchange reactions and consist of a polymer matrix to which ion exchange sites are attached. These sites carry charged functional groups that attract and exchange ions of the opposite charge. Ion exchange resins are typically available as porous yellow microbeads, membranes, or granular material, although other forms, such as sheets, are also used. Ion exchange resins fall into two categories: cation exchange resins, which attract positive ions, and anion exchange resins, which attract negative ions. Ion exchange resins are used across various industries, such as power, chemical and petrochemical, food and beverage, pharmaceutical, electrical and electronics, metal and mining, and other industrial applications to improve system efficiency, reduce energy consumption, and extend equipment life.

Key Stakeholders

  • Ion exchange resin manufacturers
  • Raw material suppliers
  • Regulatory bodies and government agencies
  • Distributors and suppliers
  • End-use industries
  • Associations and industrial bodies
  • Market research and consulting firms

Report Objectives

  • To define, describe, and forecast the size of the ion exchange resins market in terms of value and volume
  • To provide detailed information regarding the key factors influencing the growth of the market (drivers, restraints, opportunities, and challenges)
  • To forecast the market size based on type, application, end-use industry, and region
  • To forecast the market size for the five main regions—North America, Europe, Asia Pacific, South America, and Middle East & Africa—along with their key countries
  • To strategically analyze micromarkets with respect to individual growth trends, prospects, and contributions to the total market
  • To analyze opportunities in the market for stakeholders and provide details of the competitive landscape for market leaders
  • To strategically profile leading players and comprehensively analyze their key developments, such as product launches, expansions, and deals in the ion exchange resins market
  • To comprehensively analyze the market share and core competencies of key players
  • To study the impact of AI/generative AI on the market under study, along with the macroeconomic outlook

Available customizations:

With the given market data, MarketsandMarkets offers customizations tailored to the specific needs of companies.

The following customization options are available for the report:

PRODUCT ANALYSIS

  • Product matrix, which provides a detailed comparison of the market for different sources of ion exchange resins

REGIONAL ANALYSIS

  • Further country-level breakdown of the ion exchange resins market

COMPANY INFORMATION

  • Detailed analysis and profiling of additional market players

 

Personalize This Research

  • Triangulate with your Own Data
  • Get Data as per your Format and Definition
  • Gain a Deeper Dive on a Specific Application, Geography, Customer or Competitor
  • Any level of Personalization
Request A Free Customisation

Let Us Help You

  • What are the Known and Unknown Adjacencies Impacting the lon Exchange Resins Market
  • What will your New Revenue Sources be?
  • Who will be your Top Customer; what will make them switch?
  • Defend your Market Share or Win Competitors
  • Get a Scorecard for Target Partners
Customized Workshop Request

Custom Market Research Services

We Will Customise The Research For You, In Case The Report Listed Above Does Not Meet With Your Requirements

Get 10% Free Customisation

TESTIMONIALS

Growth opportunities and latent adjacency in lon Exchange Resins Market

avtar

Shaghayegh

Oct, 2015

interested to know about ion exchange technology .

avtar

William

Jun, 2018

Resin type breakup, and company information for North America..

avtar

Marubini

Mar, 2019

Sample report on global ion exchange resins market.

avtar

Freda

Feb, 2019

General information on Ion Exchange materials Market.

avtar

Hartmut

Feb, 2016

General information on Ion Exchange Resins Market.

avtar

Atul

Aug, 2015

Interested in Ion Exchange Resins Market.

avtar

George

Feb, 2019

Interested in market size and growth of acid cation resin..

avtar

Bruno

Dec, 2018

Chile ion exchange resin market specific to mining & metallurgy applications..

avtar

Kalindi

Mar, 2018

Report title not mentioned.

avtar

Norberto

Mar, 2016

General information on Ion Exchange Resins in Germany, Austria, and Denmark.

avtar

Norberto

Mar, 2016

Specific interest on understanding market sixe for floating LNG power vessel market in Europe .

avtar

PATRICK

Aug, 2017

Information on Ion Exchange resin Market in Malaysia.

avtar

antonio

Apr, 2018

Interest pertaining to resins for demineralization, softening, and metal removal..

Show More
DMCA.com Protection Status
popup img