
Direct-to-Device (D2D) Market Revenue Trends & Growth Drivers

Direct-to-Device (D2D) Market by Service Type (Direct to IoT, Direct to Cell), Customer Type (Consumer, Enterprise Network, Government & Defense), Latency Class, Frequency, Orbit and Region - Global Forecast to 2030


OVERVIEW

Source: Secondary Research, Interviews with Experts, MarketsandMarkets Analysis
The Direct-to-Device (D2D) Market is estimated at USD 0.57 billion in 2025 and is projected to reach USD 2.64 billion by 2030, at a CAGR of 35.6%. The D2D subscriber volume for the consumer segment is anticipated to grow from 0.6 million in 2025 to 23.5 million by 2030. The D2D Industry is driven by the growing demand to eliminate connectivity gaps and provide seamless global coverage. It is further accelerated by the rapid proliferation of IoT devices and smartphones requiring always-on, low-latency communication.
Market Size & Forecast
• 2024 Market Size (Value): USD 0.46 BILLION
• 2030 Market Forecast (Value): USD 2.64 BILLION
• CAGR: 35.6% from 2025 to 2030
• Asia Pacific: Fastest-Growing Region
• Opportunity: Growing IoT & Industrial Applications
KEY TAKEAWAYS
-
BY SERVICE TYPEThe market is segmented into Direct-to-cell and Direct-to-IoT by service type.The rapid adoption of digital technologies in industries based on remote operations is propelling D2IoT demand.
-
BY CUSTOMER TYPEGrowing need for operational efficiency and digital transformation is driving the growth of enterprise network segment.
-
BY FREQUENCYThe combination of moderate spectrum availability and increasing operator interest positions S-band as a growth driver for mainstream D2D services.
-
BY ORBITThe scalability of LEO constellations, combined with declining launch costs, is driving widespread deployments by both private and public operators.
-
BY LATENCY CLASSL3 latency class lower infrastructure requirements and ability to support bulk or intermittent data transfer make it a cost-efficient option for niche applications.
-
BY REGIONNorth America is expected to have the largest market share for D2D, supported by the presence of key market players in the region.
-
COMPETITIVE LANDSCAPEMajor players in the D2D market have adopted both organic and inorganic strategies, including partnerships and investments. Iridium Communications Inc. and Globalstar are among the key players in the D2D market.
The future growth of the Direct-to-Device (D2D) market is likely to be fueled by the large-scale deployment of satellite constellations, increasing integration of multi-orbit networks, and expanding adoption across consumer, enterprise, and government sectors. With smartphones and IoT devices becoming satellite-ready through 3GPP NTN standards, D2D services are expected to evolve from emergencies and niche use cases to mainstream connectivity solutions.
TRENDS & DISRUPTIONS IMPACTING CUSTOMERS' CUSTOMERS
The impact on consumers’ business emerges from customer trends or disruptions. Trends and disruptions impacting customer business often stem from strong demand for Direct-to-IoT and Direct-to-Cell services. The Direct-to-Device (D2D) market is driven by the growing demand to eliminate connectivity gaps and provide seamless global coverage. It is further accelerated by the rapid proliferation of IoT devices and smartphones requiring low-latency communication.

Source: Secondary Research, Interviews with Experts, MarketsandMarkets Analysis
MARKET DYNAMICS
Level
-
Growing demand for emergency communication and disaster resilience

-
Proliferation of IoT & connected devices

Level
-
Spectrum & regulatory complexity

-
Ecosystem readiness and device integration

Level
-
Growing IoT & industrial applications

-
Expansion of digital inclusion and rural connectivity

Level
-
Latency and network integration challenges

-
High operational dependency on satellite launches

Source: Secondary Research, Interviews with Experts, MarketsandMarkets Analysis
Driver: Growing Demand for Emergency Communication and Disaster Resilience
The increasing frequency of natural disasters, climate-related events, and infrastructure outages has underscored the need for resilient communication systems, driving adoption of D2D solutions. In disaster situations, terrestrial networks are often the first to fail due to power disruptions, damaged towers, or network congestion, leaving affected populations and emergency responders without reliable communication. D2D addresses this issue by enabling smartphones to connect directly to satellites for essential services.
Restraint: Spectrum & Regulatory Complexity
One of the most significant restraints in the D2D market is the spectrum allocation and regulatory approval. Unlike traditional mobile networks, D2D services operate at the intersection of terrestrial and non-terrestrial communications, requiring harmonized use of spectrum bands across different jurisdictions. This creates a complex environment where mobile network operators (MNOs), satellite providers, and national regulators must coordinate to avoid interference, ensure compatibility, and comply with international frameworks established by bodies.
Opportunity: Growing IoT & Industrial Applications
The proliferation of IoT devices and industrial applications represents one of the strongest growth opportunities for the D2D market. Industrial sectors such as logistics, agriculture, oil & gas, mining, and defense increasingly depend on real-time connectivity to monitor and manage operations. These activities occur in remote or harsh environments where terrestrial networks are unavailable. D2D satellite solutions directly address this challenge by providing global connectivity for IoT modules and sensors without the need for additional ground infrastructure.
Challenge: High Operational Dependency on Satellite Launches
Operational delays and launch risks represent a critical challenge in the D2D market, given the industry’s dependence on large-scale satellite constellations for global coverage. The deployment of these constellations requires precision planning, long production cycles, and complex coordination across multiple supply chains. Even minor delays in satellite manufacturing, integration, or launch schedules can cause cascading effects, postponing service availability and slowing the ability of providers to meet commercial commitments.
Direct-to-Device (D2D) Market: COMMERCIAL USE CASES ACROSS INDUSTRIES
| COMPANY | USE CASE DESCRIPTION | BENEFITS |
|---|---|---|
 |
Enabled satellite-to-smartphone connectivity for emergency and remote communications | Provides truly global coverage with reliable, low-latency messaging |
 |
Supported smartphone emergency SOS services and IoT asset tracking via L/S-band | Delivers cost-effective solutions with mass-market device integration |
 |
Provided satellite services extended to enterprise and IoT devices | Ensures high-capacity, secure connectivity for both consumer and business |
 |
Facilitated Direct-to-IoT services for logistics, fleet tracking, and asset monitoring | Enhances efficiency and reduces costs with continuous IoT data relays |
 |
Enabled Direct-to-Cell and IoT connectivity using LEO mega-constellations | Offers scalable, high-speed, low-latency services with global reach |
Logos and trademarks shown above are the property of their respective owners. Their use here is for informational and illustrative purposes only.
MARKET ECOSYSTEM
The key stakeholders in the market ecosystem are satellite service providers, telecom/mno partners, ground segment & cloud service providers, and end users. The following figure lists some players working in the Direct-to-Device (D2D) market ecosystem. Startups and industries working on D2D services also play a crucial role in shaping the market's direction and future growth.
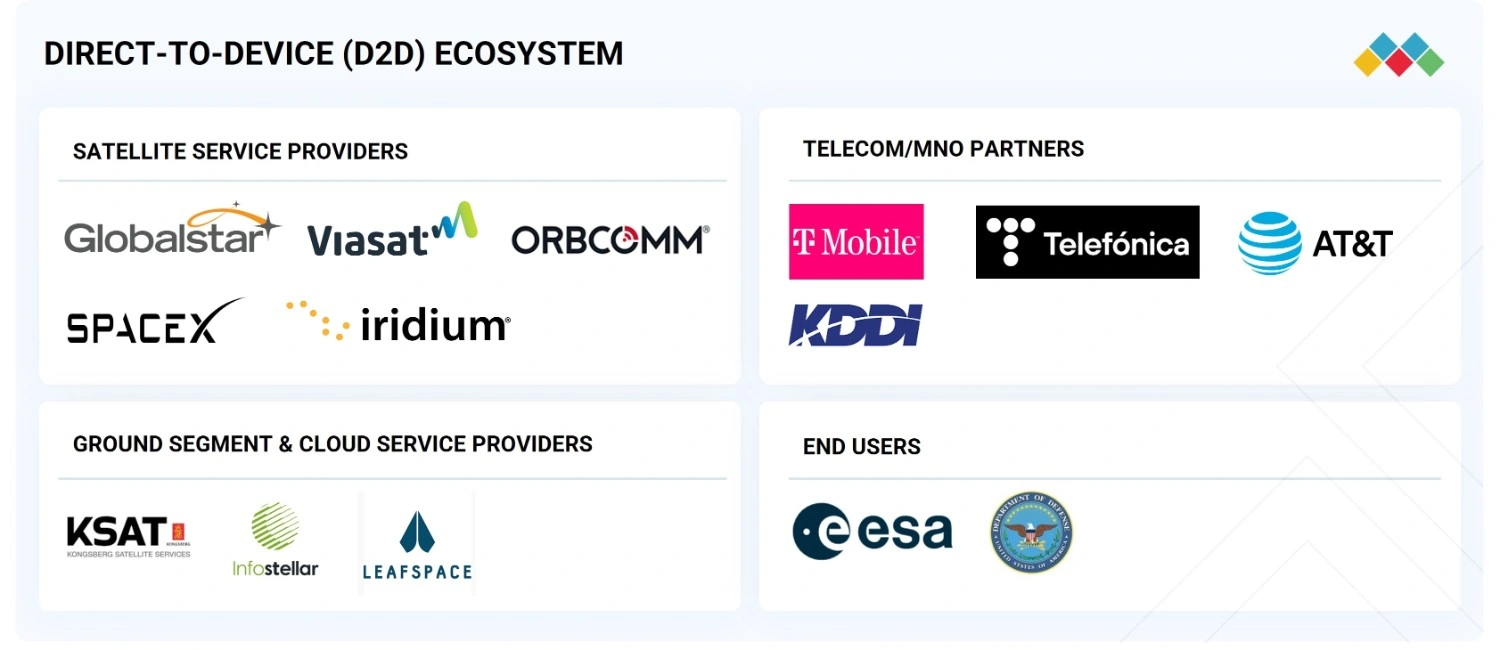
Logos and trademarks shown above are the property of their respective owners. Their use here is for informational and illustrative purposes only.
MARKET SEGMENTS
Source: Secondary Research, Interviews with Experts, MarketsandMarkets Analysis
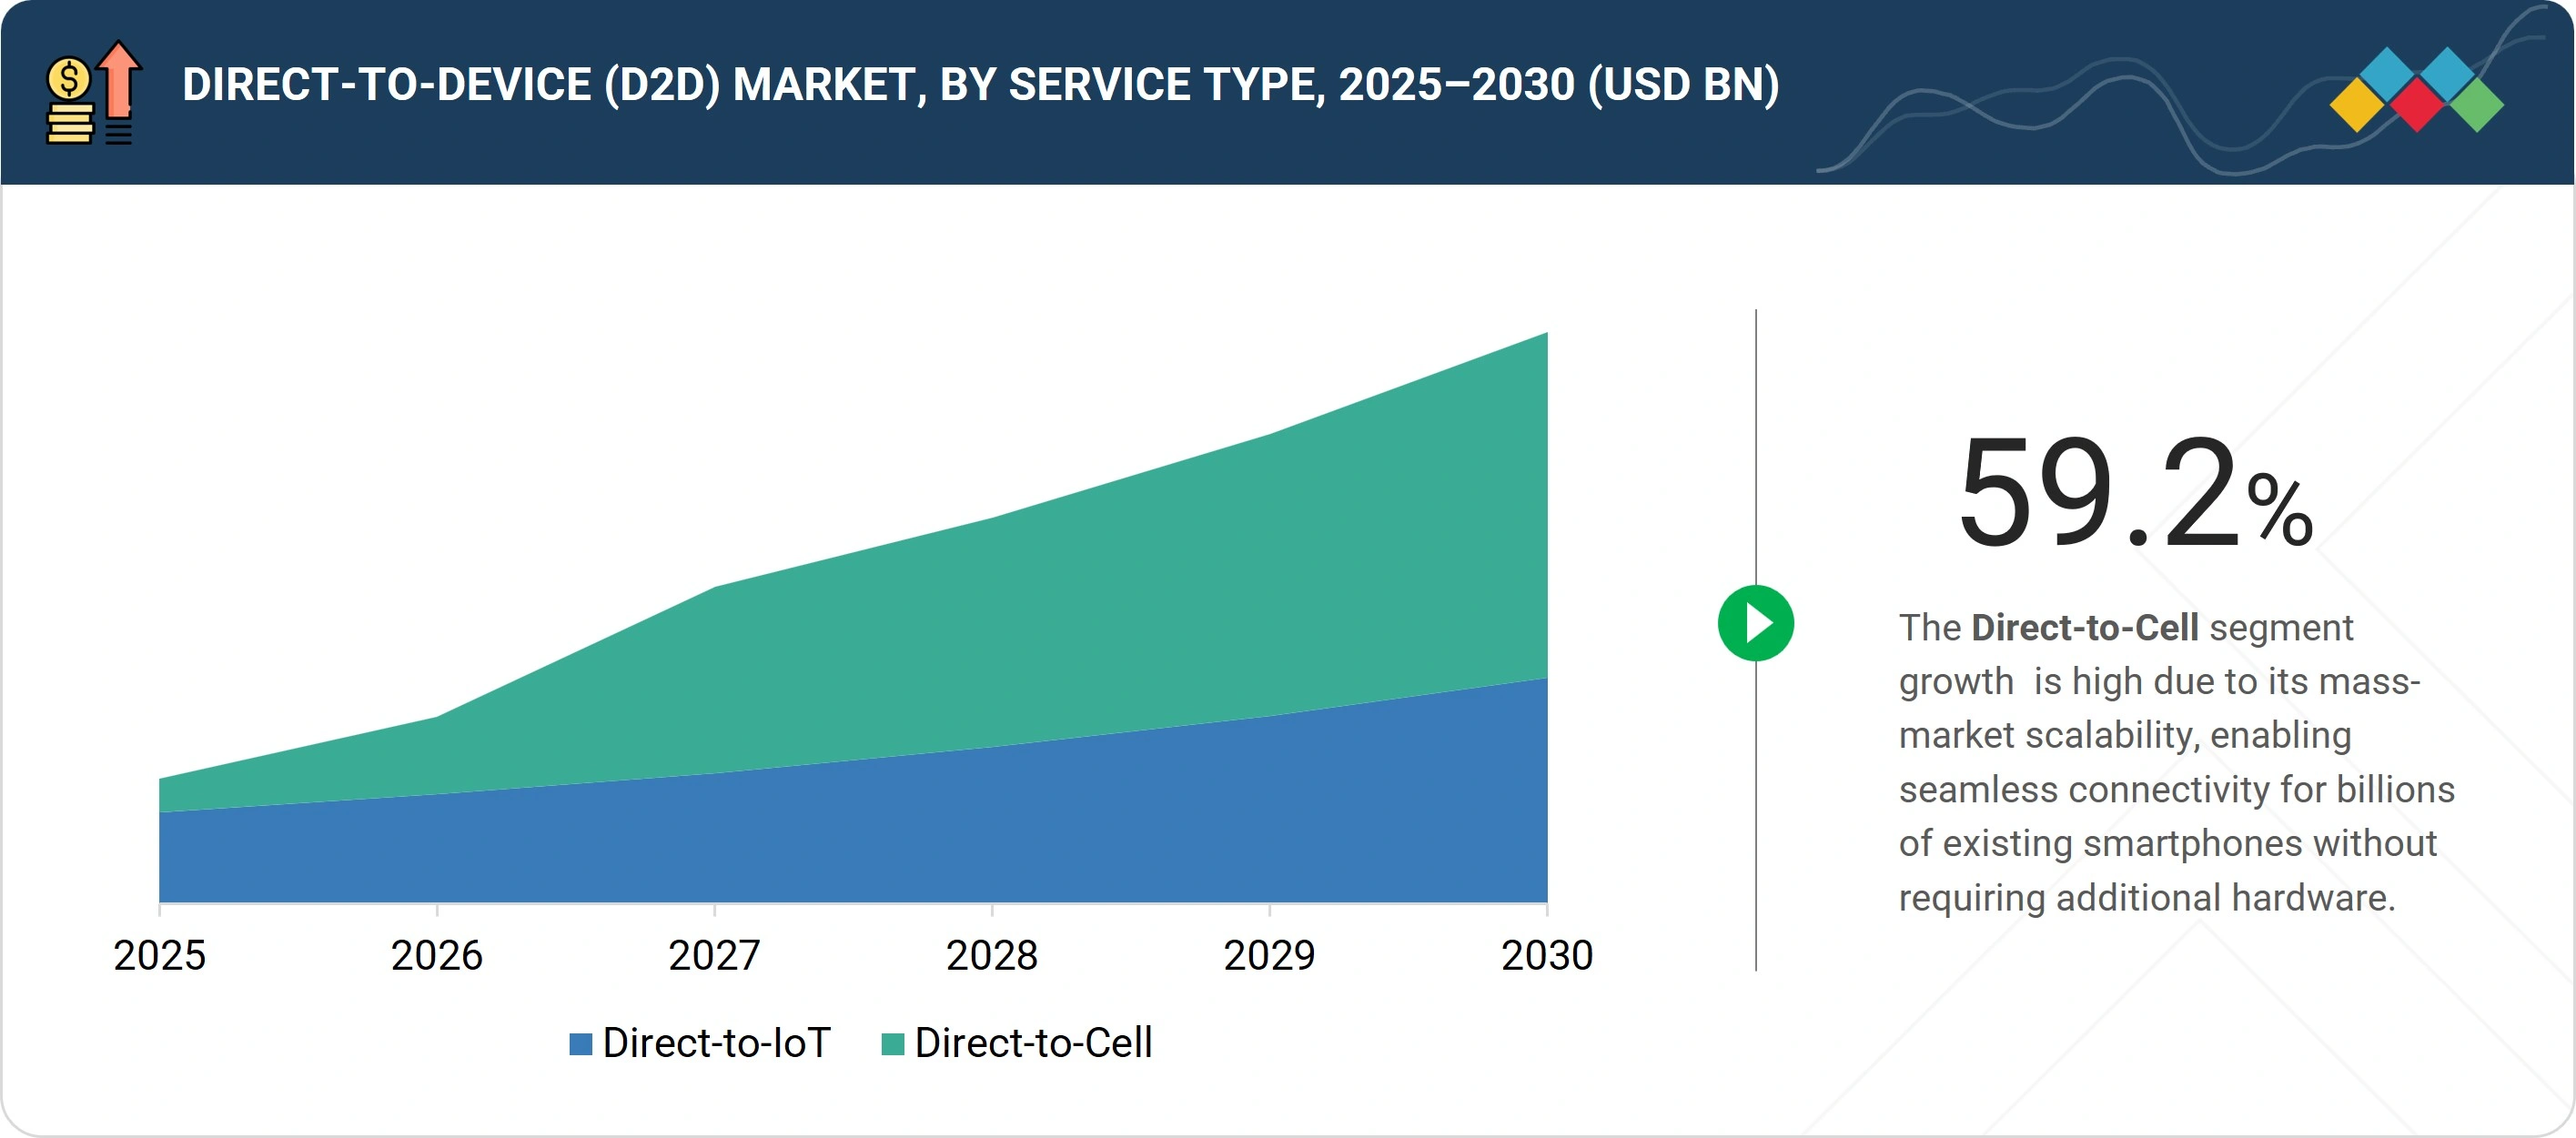
Direct-to-Device (D2D) Market, By Service Type
Based on service type, the direct-to-IoT (D2IoT) segment is expected to account for the largest market share in the Direct-to-Device (D2D) market during the forecast period. The growth is driven by its central role in enterprise and industrial adoption.
Direct-to-Device (D2D) Market, By Frequency
The L-band segment is projected to hold the largest market share of the Direct-to-Device (D2D) market during the forecast period, owing to its proven reliability and suitability for mobile and IoT applications. L-band frequencies, which operate in the 1–2 GHz range, are highly resilient in challenging conditions, including heavy rainfall, dense vegetation, and maritime environments.
Direct-to-Device (D2D) Market, By Customer Type
Based on customer type, the enterprise network segment is projected to dominate the Direct-to-Device (D2D) market share in 2025. Enterprise demand for Direct-to-IoT services is particularly strong, as it enables predictive maintenance, asset tracking, and smart infrastructure deployment. This sustained enterprise-led adoption positions the segment as the primary growth engine within the D2D customer landscape.
Direct-to-Device (D2D) Market, By Orbit
The LEO segment is estimated to dominate the Direct-to-Device (D2D) market during the forecast period. The LEO satellites have benefits including low latency, quicker signal transmission, and enhanced service quality for mobile as well as IoT devices which make them particularly suitable for real-time applications such as voice, messaging, and low-to-high data IoT connectivity.
Direct-to-Device (D2D) Market, By Latency Class
The L3 class segment is expected to be dominant in the Direct-to-Device (D2D) market due to its suitability for IoT and non-real-time applications that require reliable connectivity without the high cost of ultra-low latency infrastructure.
REGION
Asia Pacific to be second fastest-growing region in global Direct-to-Device (D2D) market during forecast period
Asia Pacific is projected to be the second fastest-growing region in the global Direct-to-Device (D2D) market during the forecast period, driven by its vast population, rapid digital adoption, and expanding mobile subscriber base. The region is witnessing strong demand for Direct-to-IoT applications in agriculture, logistics, and smart city development, alongside rising consumer adoption of Direct-to-Cell services for emergency connectivity.

Direct-to-Device (D2D) Market: COMPANY EVALUATION MATRIX
The company evaluation matrix for Direct-to-Device (D2D) market evaluates players based on product footprint and market share. It highlights their competitive positioning and ranks them according to market strength and growth strategies. Iridium Communications Inc. leads the Direct-to-device market with a strong service portfolio, advanced satellite technologies, and broad customer base, while AST Spacemobile is recognized as an emerging leader in this market.

Source: Secondary Research, Interviews with Experts, MarketsandMarkets Analysis
KEY MARKET PLAYERS
List of Top Direct-to-Device (D2D) Companies
MARKET SCOPE
| REPORT METRIC | DETAILS |
|---|---|
| Market Size in 2024 (Value) | USD 0.46 BILLION |
| Market Forecast in 2030 (value) | USD 2.64 BILLION |
| Growth Rate | CAGR of 35.6% from 2025 to 2030 |
| Years Considered | 2021–2030 |
| Base Year | 2024 |
| Forecast Period | 2025–2030 |
| Units Considered | Value (USD Billion), Volume (Million Subscribers) |
| Report Coverage | Revenue forecast, company ranking, competitive landscape, growth factors, and trends |
| Segments Covered | • By Customer Type- Consumer, Enterprise Network, and Government & Defense • By Orbit- LEO, GEO, and Multi Orbit • By Service Type- Direct-to-IoT, and Direct-to-Cell • By Frequency- UHF/VHF-band, L-band, S-band • By Latency Class- L1 (<150Ms), L2 (150-600Ms), L3 (600Ms-10s), L4 (>10s) |
| Regions Covered | North America, Europe, Asia Pacific, Middle East, and Rest of the World |
WHAT IS IN IT FOR YOU: Direct-to-Device (D2D) Market REPORT CONTENT GUIDE

DELIVERED CUSTOMIZATIONS
We have successfully delivered the following deep-dive customizations:
| CLIENT REQUEST | CUSTOMIZATION DELIVERED | VALUE ADDS |
|---|---|---|
| Leading Manufacturer | Additional segment breakdown for countries | Additional country-level market sizing tables for segments/sub-segments covered at the regional/global level to gain an understanding of market potential by each country |
| Emerging Leader | Additional company profiles | Competitive information on targeted players to gain granular insights on direct competition |
| Regional Market Leader | Additional country market estimates | Additional country-level deep dive for a more targeted understanding of the total addressable market |
RECENT DEVELOPMENTS
- November 2025 : Space42 (UAE) and Viasat (US) partnered to explore a shared, multi-tenant, multi-orbit 5G Non-Terrestrial Network (NTN) built on open, 3GPP-based architecture.
- September 2025 : SpaceX (US) entered into a purchase agreement with EchoStar Corporation(US) for 50 MHz of exclusive S-band spectrum in the US as well as global Mobile Satellite Service (MSS) spectrum licenses.
- September 2025 : EchoStar (US) agreed to sell its AWS-4 and H-block spectrum licenses to SpaceX (US) in Hawthorne, California, for about USD 17 billion.
- June 2025 : Vi (India) and AST & Science, LLC (US) announced a strategic partnership to deliver direct-to-smartphone satellite mobile services across India.
- December 2024 : Ukraine’s largest mobile operator, Kyivstar (Ukraine), partnered with SpaceX’s (US) Starlink to enhance national connectivity through satellite services.
Table of Contents
 Exclusive indicates content/data unique to MarketsandMarkets and not available with any competitors.
Methodology
This research study involves the use of extensive secondary sources, directories, and databases (e.g., Hoovers, Bloomberg Business, Factiva, and OneSource) to identify and collect information useful for this technical, market-oriented, and commercial study of the Direct-to-Device (D2D) market. Primary sources include several industry experts from the core and related industries and preferred suppliers, manufacturers, distributors, technology developers, IP vendors, standards, and organizations related to all the segments of this industry’s value chain. In-depth interviews have been conducted with various primary respondents, including key industry participants, subject matter experts (SMEs), C-level executives of key market players, and industry consultants to obtain and verify critical qualitative and quantitative information, as well as to assess the prospects.
Secondary Research
In the secondary research process, various secondary sources have been referred to for identifying and collecting information for this study. The secondary sources include annual reports, press releases, and investor presentations of companies; white papers, journals, and certified publications and articles from recognized authors; and websites, directories, and databases. Secondary research has mainly been used to obtain key information about the industry’s supply chain, the market’s value chain, major players, market classification, and segmentation according to the industry trends to the bottommost level, geographic markets, and key developments from both market- and technology-oriented perspectives. The secondary data has been collected and analyzed to arrive at the overall market size, which has further been validated by primary research.
Primary Research
Extensive primary research has been conducted after obtaining information about the current scenario of the Direct-to-Device (D2D) market through secondary research. Several primary interviews have been conducted with market experts from the demand and supply sides across North America, Europe, the Asia Pacific, the Middle East, and the Rest of the World. This primary data has been collected through questionnaires, emails, and telephonic interviews.
 Market Size, and Share")
Note: Tiers of companies are based on their revenue in 2024. Tier 1: company revenue greater than USD 1 billion; Tier 2: company revenue between USD 100 million and USD 1 billion; and Tier 3: company revenue less than USD 100 million.
To know about the assumptions considered for the study, download the pdf brochure
Market Size Estimation
Both the top-down and bottom-up approaches have been used to estimate and validate the size of the D2D market.
The research methodology used to estimate the market size also includes the following details:
- Key players in the market have been identified through secondary research, and their market ranking has been determined through primary and secondary research. This includes a study of annual and financial reports of the top market players and extensive interviews with industry experts who are knowledgeable about Direct-to-Device (D2D).
- The top-down and bottom-up approaches have been used to estimate and validate the size of the global market and the dependent submarkets in the overall market.
Direct-to-Device (D2D) Market: Top-Down and Bottom-Up Approach
 Market Top Down and Bottom Up Approach")
Data Triangulation
After arriving at the overall size of the Direct-to-Device (D2D) market from the estimation process explained above, the total market has been split into several segments and subsegments. The data triangulation and market breakdown procedures explained below have been implemented, wherever applicable, to complete the overall market engineering process and arrive at the exact statistics for various market segments and subsegments. The data has been triangulated by studying various factors and trends from the demand and supply sides. Along with this, the D2D market size has been validated using the top-down and bottom-up approaches.
Market Definition
The D2D refers to satellite services that connect directly to end-user devices such as smartphones, sensors, and machines without relying on traditional fixed ground infrastructure. It covers three key segments: Direct-to-Cell, which provides voice, messaging, and data services directly to standard smartphones using satellite-enabled cellular bands; Direct-to-Broadband, which offers high-speed internet via compact user terminals; and Direct-to-IoT, which enables low-bandwidth data transfer for sensors, trackers, and machines using integrated or low-power satellite modules.
Key Stakeholders
- Mobile Network Operators (MNOs)
- Satellite Operators
- Device Manufacturers (Handsets & IoT Devices)
- Chipset & Technology Providers
- Regulators & Government Agencies
- Defense & Emergency Agencies
- Enterprise & Industrial Users
- Commercial Organizations
- Research Institutions
Report Objectives
- To define, describe, segment, and forecast the size of the Direct-to-Device (D2D) market based on service type, customer type, latency class, orbit, frequency, and region
- To forecast sizes of various segments of the market with respect to major regions, namely, North America, Europe, the Asia Pacific, the Middle East, and the Rest of the World, along with major countries in each of these regions
- To identify and analyze key drivers, restraints, opportunities, and challenges influencing the growth of the market across the globe
- To identify industry trends, market trends, and technology trends that are currently prevailing in the market
- To provide an overview of the regulatory landscape with respect to D2D regulations across regions
- To analyze micro markets with respect to individual growth trends, prospects, and their contribution to the overall market
- To analyze opportunities in the market for stakeholders by identifying key market trends
- To profile key market players and comprehensively analyze their market shares and core competencies
- To analyze the degree of competition in the market by identifying key growth strategies, such as acquisitions, product launches, contracts, and partnerships, adopted by leading market players
- To identify detailed financial positions, key products, and unique selling points of leading companies in the market
- To provide a detailed competitive landscape of the market, along with market ranking analysis, market share analysis, and revenue analysis of key players
Available customizations
Along with the market data, MarketsandMarkets offers customizations as per the specific needs of companies. The following customization options are available for the report:
Product Analysis
- Product matrix, which gives a detailed comparison of the product portfolio of each company
Regional Analysis
- Further breakdown of the market segments at the country level
Company Information
- Detailed analysis and profiling of additional market players (up to 5)
Key Questions Addressed by the Report
What is the current and projected market value of the satellite direct-to-device (D2D) market?
The satellite direct-to-device market is estimated at USD 0.57 billion in 2025 and is projected to reach USD 2.64 billion by 2030, growing at a CAGR of 35.6% during the forecast period.
Which region is expected to witness strong growth in the satellite D2D market?
Asia Pacific is expected to be one of the fastest growing regions in the satellite D2D market due to rising mobile adoption, expanding digital infrastructure, and increasing demand for IoT connectivity.
Which segment dominates the satellite D2D market by customer type?
The enterprise network segment is expected to dominate the satellite D2D market as enterprises increasingly adopt direct-to-IoT services for asset tracking, predictive maintenance, and smart infrastructure.
How is the satellite direct-to-device market segmented?
The satellite D2D market is segmented by service type into direct-to-IoT and direct-to-cell, by customer type into consumer, enterprise network, and government and defense, and further by latency class, frequency, orbit, and region.
Who are the key players in the satellite direct-to-device market?
Key players in the satellite direct-to-device market include Iridium Communications Inc. and AST SpaceMobile, which are recognized for their strong service portfolios and emerging leadership in satellite connectivity solutions.
Need a Tailored Report?
Customize this report to your needs
Get 10% FREE Customization
Customize This ReportPersonalize This Research
- Triangulate with your Own Data
- Get Data as per your Format and Definition
- Gain a Deeper Dive on a Specific Application, Geography, Customer or Competitor
- Any level of Personalization
Let Us Help You
- What are the Known and Unknown Adjacencies Impacting the Direct-to-Device (D2D) Market
- What will your New Revenue Sources be?
- Who will be your Top Customer; what will make them switch?
- Defend your Market Share or Win Competitors
- Get a Scorecard for Target Partners

Custom Market Research Services
We Will Customise The Research For You, In Case The Report Listed Above Does Not Meet With Your Requirements
Get 10% Free CustomisationTESTIMONIALS


Growth opportunities and latent adjacency in Direct-to-Device (D2D) Market