
Sodium Silicate Market

Sodium Silicate Market by Form (Liquid, Solid), Application (Detergent & Cleaning Agents, Precipitated Silica, Pulp & Paper, Water Treatment, Other Application), & Region (North America, Europe, Asia Pacific, South America, MEA) - Global Forecast to 2029


OVERVIEW
Source: Secondary Research, Interviews with Experts, MarketsandMarkets Analysis
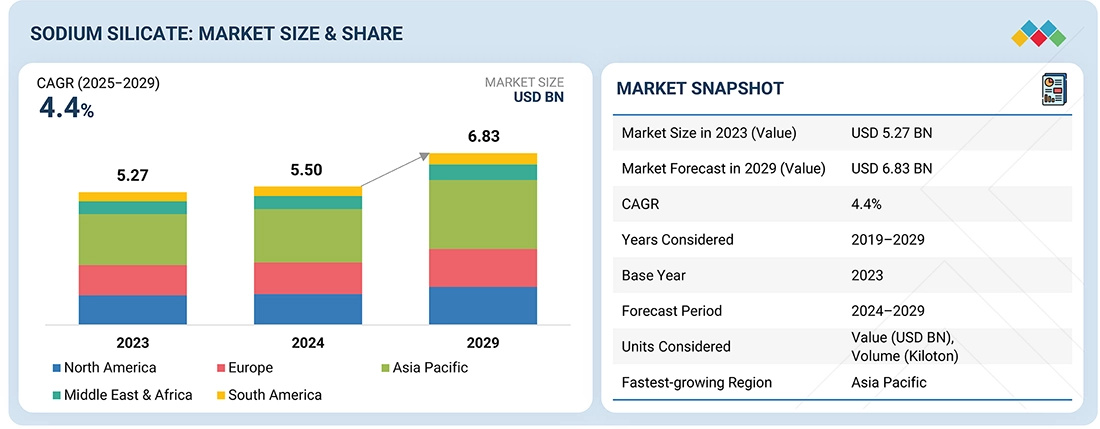
The global sodium silicate market is forecasted to grow from USD 5.50 billion in 2024 to USD 6.83 billion by 2029, with a CAGR of 4.4% during the projection period. The demand for sodium silicate is fueled by its increasing use in detergent production, where it serves as a key ingredient due to its cleaning and emulsification properties. Growth in the construction industry also enhances its application in cement and adhesives because of its superior binding and reinforcing capabilities. The pulp and paper industry also relies on sodium silicate for bleaching, deinking, and sizing. Additionally, strict environmental regulations promoting water treatment activities are driving the demand for sodium silicate in purification and wastewater management. All these factors contribute to the rising demand for sodium silicate across various industries.
KEY TAKEAWAYS
-
BY FORMThe sodium silicate market comprises both liquid and solid forms. The liquid sodium silicate segment is expected to achieve the highest CAGR during the forecast period due to its increasing use across various industries. Its high solubility and ease of application make it a preferred choice in detergent manufacturing, where it enhances cleaning performance and stabilizes the formulation.
-
BY APLICATIONThe market for sodium silicate is segmented by application and includes precipitated silica, adhesives, detergents & cleaning products, pulp & paper, water treatment, and other uses. The precipitated silica segment is expected to show the highest CAGR during the forecast period due to its increasing use in various high-growth sectors. The tire and rubber industries are major markets because precipitated silica is used as a reinforcing filler in tire manufacturing to boost durability, fuel efficiency, and wet traction.
-
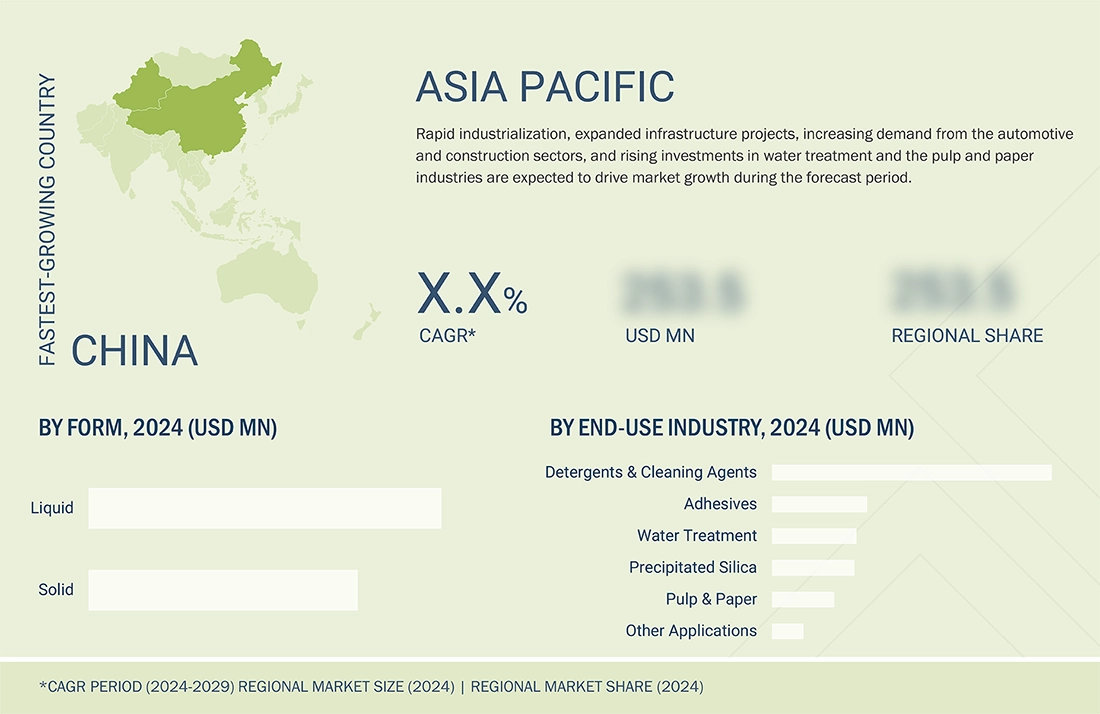
BY REGIONThe market for sodium silicate is divided regionally into North America, Europe, Asia Pacific, the Middle East and Africa, and South America. Among these, the Asia Pacific region held the largest market share in 2023 and is the fastest-growing region worldwide. The growth is driven by rapid industrialization, increasing construction activities, rising detergent production, and growing demand from the pulp and paper industry.
-
COMPETITIVE LANDSCAPEThe market is driven by strategic acquisitions and expansions from leading players such as PQ Corporation (US), Qemetica (Poland), Nippon Chemical Industrial Co., Ltd. (Japan), and Occidental Petroleum Corporation (US). These companies are planning strategic expansions and conducting acquisitions that help them increase their regional presence.
The sodium silicate market is expected to grow due to various factors. Increasing demand from end-use industries like detergent production, pulp & paper, and adhesives in construction is expected to drive the market.
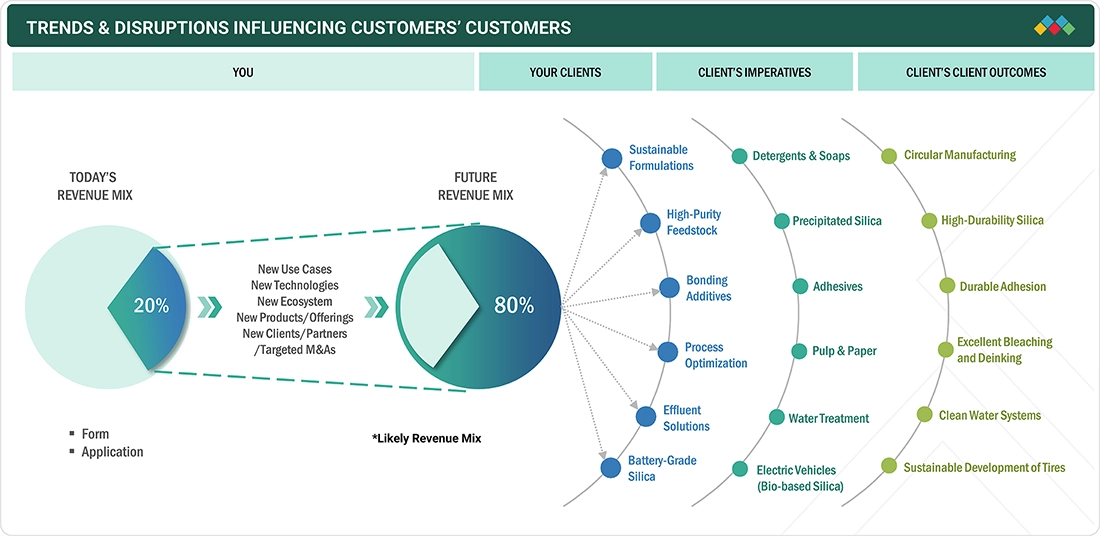
TRENDS & DISRUPTIONS IMPACTING CUSTOMERS' CUSTOMERS
Sodium silicate finds extensive use across diverse industrial and commercial sectors due to its unique properties such as adhesion, corrosion resistance, and ability to act as a binder or buffering agent. The demand for sodium silicate is closely tied to developments in its major end-use industries, including detergents, pulp and paper, construction, textiles, water treatment, and ceramics. Over time, shifts in consumer preferences, regulatory standards, and technological advancements have directly influenced both the volume and nature of sodium silicate consumption.
Source: Secondary Research, Interviews with Experts, MarketsandMarkets Analysis
MARKET DYNAMICS
Level
-
•Growing demand in detergent production

-
•Expansion in construction activities

Level
-
•Fluctuating raw material prices

-
•Health and environmental concerns

Level
-
•Application in green tire manufacturing

-
•Rapid urbanization in Africa and Asia

Level
-
•Environmental and regulatory compliance

-
•Competition from alternative materials

Source: Secondary Research, Interviews with Experts, MarketsandMarkets Analysis
Driver: Growing demand in detergent production
Rising demand for detergents is a major factor boosting the market for sodium silicate because of its important role in detergent formulations. Sodium silicate aids in cleaning by softening water, preventing mineral scale buildup, and maintaining pH balance. It also helps with grease removal and shields washing machines and industrial equipment from corrosion. Additionally, as some companies transition to phosphate-free and eco-friendly options, sodium silicate has emerged as a popular choice due to its biodegradability and effectiveness. Global trade data shows strong export growth in detergents, reflecting industry expansion. In 2023, the European Union exported about USD 1.5 billion worth of detergents, while the U.S. and China reported exports close to USD 1 billion and USD 770 million, respectively. This growth mirrors the increasing worldwide use of cleaning agents, which directly impacts the demand for sodium silicate.
Restraint: Fluctuating raw material prices
The cost of sodium silicate relies heavily on the fluctuations in raw material prices, particularly soda ash and silica sand, which have a significant influence on production costs. In 2023, Chinese soda ash export prices averaged approximately USD 360 per metric ton FOB but experienced a significant drop by mid-2024 to almost USD 265 per metric ton. This kind of volatility introduces uncertainty into production planning, impacting pricing strategies and overall profit margins. During the third quarter of 2024, the European soda ash market experienced significant price volatility owing to supply shortages and increasing energy prices. Robust demand from the glass sector, combined with constrained supply within the Eurozone, caused market volatility. As Europe is a large user of sodium silicate in detergents, adhesives, and building materials, these price swings translate into higher production costs, impacting profitability for local producers. Another key determinant of the cost is the energy-intensive nature of sodium silicate manufacturing. High-temperature processing of soda ash and silica sand leaves the industry extremely vulnerable to fuel and electricity price hikes.
Opportunity: Application in green tire manufacturing
The growing emphasis on sustainability in the automotive industry has driven high demand for eco-friendly tires, which utilize advanced materials to make vehicles more fuel-efficient and durable. Sodium silicate is a key component used in manufacturing silica-reinforced tire compounds, improving traction, reducing rolling resistance, and boosting overall performance. Tire manufacturers are using silica-silane technology to meet strict environmental regulations and fulfill consumers’ desires for fuel-efficient vehicles. As eco-friendly mobility solutions gain momentum, the use of sodium silicate in sustainable tire production is likely to increase.
Challenge: Environmental and regulatory compliance
Sodium silicate is a safer alternative to most industrial chemicals. However, its manufacturing process consumes a lot of energy, leading to environmental problems. Producing sodium silicate involves reacting silica (sand) and soda ash (sodium carbonate) at high temperatures that require significant energy, mostly from fossil fuels. This process results in high levels of carbon emissions, challenging industries to lower their greenhouse gas footprint. In European and North American countries, stricter environmental policies are pressuring sodium silicate producers. The European Union’s Green Deal aims to cut emissions by over 50% by 2030, which has increased industrial standards. The EU Industrial Emissions Directive requires the adoption of cleaner technologies, and the US Clean Air Act enforces strict emission standards that compel producers to invest in carbon capture and filtration technologies. Failing to comply with these standards can lead to hefty fines or costly upgrades to operations.
Sodium Silicate Market: COMMERCIAL USE CASES ACROSS INDUSTRIES
| COMPANY | USE CASE DESCRIPTION | BENEFITS |
|---|---|---|
 |
Physical-chemical stabilization of collapsible loess soil in southern Algeria using sodium silicate treatment to reduce collapse potential and improve soil mechanical strength | Significant reduction of soil collapse potential, improved erosion resistance, increased soil mechanical strength by cementation and pore filling, enhanced water stability, and improved durability for construction and infrastructure applications in arid regions |
 |
Novel application of sodium silicate-based drilling fluids in East African shale formations to inhibit shale swelling, stabilize boreholes, and enhance drilling efficiency | Reduced shale swelling and disintegration compared to conventional inhibitors, improved borehole stability by forming a protective silicate film, increased drilling rate, reduced well costs through fewer drilling problems and less downtime, and enhanced performance under contamination and temperature variations |
 |
Use of sodium silicate in oil, gas, and geothermal well operations for wellbore stabilization, fluid loss control, cementing, and leak prevention | Enhanced wellbore stability by sealing microfractures, improved bonding strength in cement to prevent gas migration and fluid leaks, reduced operational downtime and maintenance costs, environmentally safe due to non-toxicity and biodegradability, and overall increased safety and efficiency of drilling and production operations |
Logos and trademarks shown above are the property of their respective owners. Their use here is for informational and illustrative purposes only.
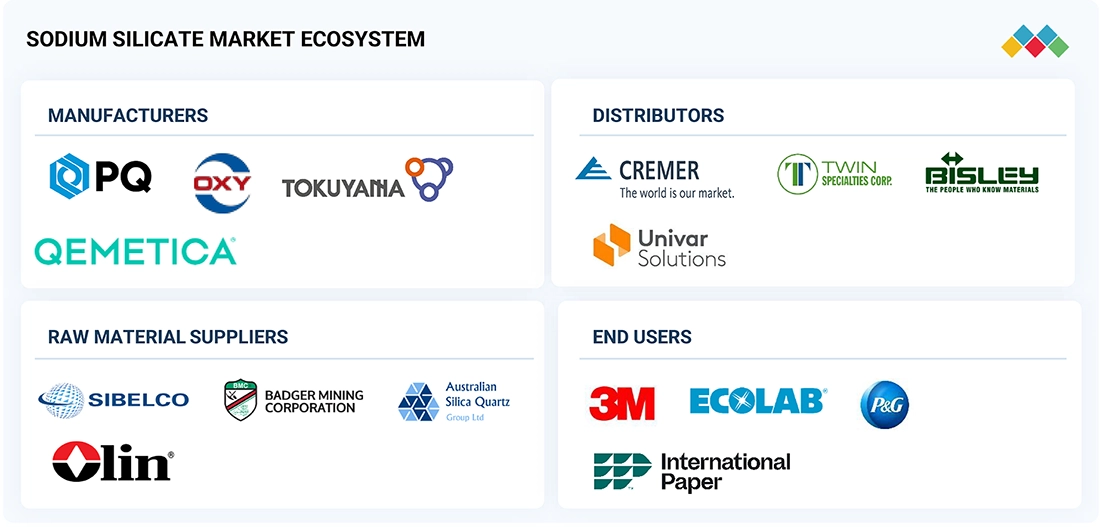
MARKET ECOSYSTEM
The ecosystem analysis of the sodium silicate market offers a detailed view of the interconnected stages within the market value chain. It starts with the raw materials stage, where essential inputs like silica, sodium carbonate, and sodium hydroxide are sourced and processed. Sodium silicate producers use these raw materials to create sodium silicate in either solid or liquid form for various applications. These products are then distributed through specialized distributors and supply chains to reach a range of end-use sectors, including detergents, soaps, automotive, construction, adhesives, water treatment, pulp, and paper. This multi-stage ecosystem ensures the smooth flow of materials and products, meeting the increasing demand for sodium silicates.
Logos and trademarks shown above are the property of their respective owners. Their use here is for informational and illustrative purposes only.
MARKET SEGMENTS
Source: Secondary Research, Interviews with Experts, MarketsandMarkets Analysis
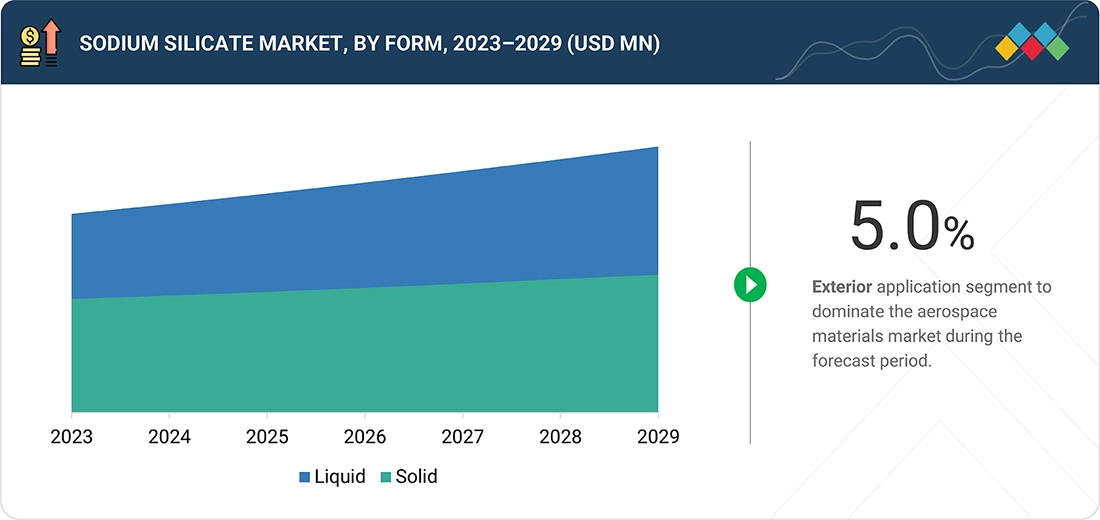
Sodium Silicate Market, By Form
The liquid sodium silicate segment is expected to see the highest CAGR during the forecast period due to its growing use in various industries. Its high solubility and ease of use make it a preferred choice in detergent manufacturing, where it enhances cleaning effectiveness and stabilizes formulations. The rising demand for environmentally friendly water treatment products is also driving its application in wastewater and sludge treatment, as it effectively removes heavy metals and contaminants.
Sodium Silicate Market, By Application
The precipitated silica segment is expected to have the highest CAGR during the forecast period because of its increasing use in various high-growth industries. The tire and rubber markets are key because precipitated silica is used as a reinforcing filler in tire manufacturing to boost durability, fuel efficiency, and wet traction. The rising demand for energy-efficient and eco-friendly tires, driven by stricter emissions standards and higher electric vehicle sales, is boosting its application. In the personal care and cosmetics fields, precipitated silica is gaining popularity as a thickener and anti-caking agent in toothpaste, skincare products, and pharmaceuticals. The shift toward silica-based alternatives in oral care products, replacing traditional abrasives, further accelerates its market growth. The food industry also presents significant growth prospects, with precipitated silica increasingly used as an anti-caking and free-flowing agent in powdered foods and food additives. Additionally, it is used in high-performance coatings and adhesives, especially in industrial settings where stability and longevity are important.
REGION
Asia Pacific to be fastest-growing region in global sodium silicate market during forecast period
The Asia Pacific is expected to see the fastest growth in the market during the forecast period due to rapid industrial expansion, infrastructure development, and increasing demand in key end-use sectors. Urbanization and large-scale infrastructure projects in China, India, and Indonesia have led to higher demand for sodium silicate in cement, adhesives, and coating applications. Government policies supporting smart cities and green building materials are also driving this growth. Additionally, Asia Pacific is a major center for the pulp and paper industry, where sodium silicate is widely used in deinking, bleaching, and wastewater treatment. Strict environmental regulations and growing concerns about water pollution are boosting sodium silicate use in wastewater treatment, especially in heavily industrialized countries like China and South Korea. Industry players investing in local manufacturing, research and development, and strategic partnerships with local companies are poised to benefit as demand for sodium silicate continues to grow in the Asia Pacific.
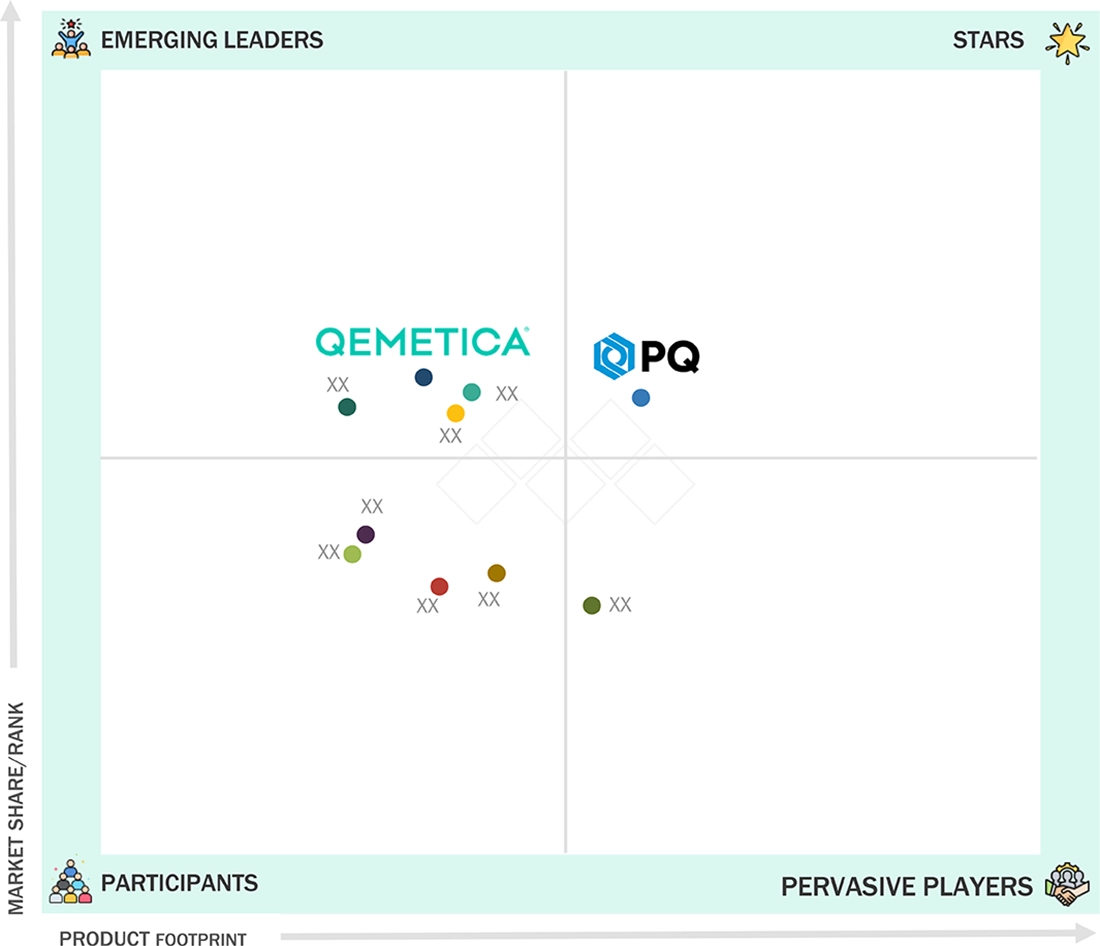
Sodium Silicate Market: COMPANY EVALUATION MATRIX
In the sodium silicate market landscape, PQ Corporation (Star) is a leading producer of silicates, silica, and related products. PQ Corporation has employed acquisition strategies to strengthen its business and expand its global presence. The company’s longstanding presence in the market has built a reputable brand. Qemetica (Emerging Leader) offers a range of products, including silica, silicates, CARGO, soda, agro solutions, and glass. Expansion and acquisitions have been key strategies for the company. While PQ Corporation leads with scale, Qemetica demonstrates strong growth potential to move toward the leaders’ quadrant.
Source: Secondary Research, Interviews with Experts, MarketsandMarkets Analysis
KEY MARKET PLAYERS
MARKET SCOPE
| REPORT METRIC | DETAILS |
|---|---|
| Market Size in 2023 (Value) | USD 5.27 Billion |
| Market Forecast in 2029 (value) | USD 6.83 Billion |
| Growth Rate | CAGR of 4.4% from 2024-2029 |
| Years Considered | 2019–2029 |
| Base Year | 2023 |
| Forecast Period | 2024–2029 |
| Units Considered | Value (USD Million/Billion), Volume (Kiloton) |
| Report Coverage | Revenue forecast, company ranking, competitive landscape, growth factors, and trends |
| Segments Covered |
|
| Regions Covered | Europe, North America, Asia Pacific, Middle East & Africa, and South America |
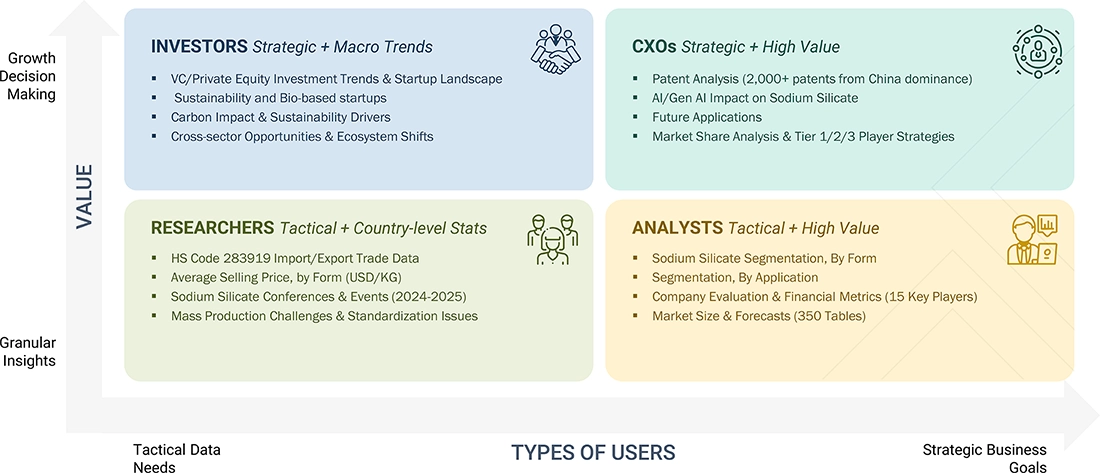
WHAT IS IN IT FOR YOU: Sodium Silicate Market REPORT CONTENT GUIDE
DELIVERED CUSTOMIZATIONS
We have successfully delivered the following deep-dive customizations:
| CLIENT REQUEST | CUSTOMIZATION DELIVERED | VALUE ADDS |
|---|---|---|
| Deep Dive into APAC Sodium Silicate Market |
|
|
RECENT DEVELOPMENTS
- January 2025 : ESAB signed an agreement to acquire Germany-based EWM GmbH for approximately USD 317.06 million (€275 million), targeting completion in the second half of 2025. This deal addresses ESAB’s product gaps in heavy industrial welding equipment, enhances technological capabilities, and is expected to be accretive to earnings from year one, while expanding the global market reach.
- December 2024 : Tokuyama Corporation decided to establish a new subsidiary in India called Tokuyama India Private Limited to sell all its products. It is expected to be up and running in April 2025. This move will help increase demand for the company’s chemical products.
- August 2024 : Qemetica signed an agreement with PPG, a leading paints, coatings, and specialty materials manufacturer, to acquire its silica products business, which has helped it increase its global reach and revenue.
- October 2022 : Occidental Petroleum Corporation, a subsidiary of Oxy Low Carbon Ventures (OLCV), signed an agreement with Natural Resource Partners L.P., a natural resource company, to develop a carbon dioxide sequestration hub in Southeast Texas. Sodium silicate production releases carbon dioxide during reactions and energy consumption.
- February 2022 : Nippon Chemical Industrial Co., Ltd. invested 20% in CT Glass Company Limited, a Thai affiliate of C. Thai Chemical Co., Ltd., to continue its sodium silicate glass (cullet) business after the liquidation of Kanto Sodium Silicate Glass Co., Ltd.
Table of Contents
 Exclusive indicates content/data unique to MarketsandMarkets and not available with any competitors.
Methodology
The study involved four major activities for estimating the current global size of the Sodium Silicate market. Exhaustive secondary research was conducted to gather information on the market, the peer and parent market. Both the top-down and bottom-up approaches were employed to estimate the overall size of the Sodium silicate market. After that, market breakdown and data triangulation procedures were used to determine the size of different segments and sub-segments of the market.
Secondary Research
The market for the companies offering the Sodium Silicate market is arrived at by secondary data available through paid and unpaid sources, analyzing the product portfolios of the major companies in the ecosystem, and rating the companies by their performance and quality. In the secondary research process, various secondary sources were referred to for identifying and collecting information related to the study. Secondary sources included annual reports, press releases, and investor presentations of Sodium Silicate materials vendors, forums, certified publications, and whitepapers. The secondary research was used to obtain critical information on the industry’s value chain, the total pool of key players, market classification, and segmentation from the market and technology-oriented perspectives.
Primary Research
In the primary research process, various primary sources from both the supply and demand sides were interviewed to obtain qualitative and quantitative information for this report. The primary sources from the supply side included industry experts, such as Chief Executive Officers (CEOs), Vice Presidents (VPs), marketing directors, technology and innovation directors, and related key executives from various key companies and organizations operating in the Sodium Silicate market. After the complete market engineering (calculations for market statistics, market breakdown, market size estimations, market forecasting, and data triangulation), extensive primary research was conducted to gather information and verify and validate the critical numbers arrived at. Primary research was also conducted to identify the segmentation types, industry trends, competitive landscape of Sodium Silicate offered by various market players, and key market dynamics, such as drivers, restraints, opportunities, challenges, industry trends, and key player strategies. In the complete market engineering process, the top-down and bottom-up approaches were extensively used, along with several data triangulation methods, to perform the market estimation and market forecasting for the overall market segments and subsegments listed in this report.

To know about the assumptions considered for the study, download the pdf brochure
Market Size Estimation
Both the top-down and bottom-up approaches were used to estimate and validate the global size of the Sodium Silicate market. These approaches were also used extensively to estimate the size of various dependent segments of the market. The research methodology used to estimate the market size included the following:

Data Triangulation
After arriving at the overall market size using the market size estimation processes explained above, the market was split into several segments and subsegments. The data triangulation and market breakup procedures were employed, wherever applicable, to complete the overall market engineering process and arrive at the exact statistics of each market segment and subsegment. The data was triangulated by studying various factors and trends from both the demand and supply sides.
Market Definition
Sodium silicate is a liquid or solid form of chemical made from silica sand, sodium hydroxide and sodium carbonate. It comes in the form of liquid solution or in solid form like lumps, powder or granules. The product has many applications for example in water treatment, detergents, cleaning agents, paper and pulp, adhesives, construction, and in making precipitated silica. Another developing application can be seen in the developing green tire manufacturing market.
Stakeholders
- Sodium silicate Manufacturers
- Sodium silicate Suppliers
- Raw Material Suppliers
- Chemical manufacturing companies
- Small and Medium-Sized Enterprises (SMEs) and Large Enterprises
- Government Agencies
- Distributors
- Pulp and Paper companies
- Water treatment companies
Report Objectives
- To estimate and forecast the Sodium silicate market, in terms of value and volume
- To provide detailed information about the major factors (drivers, restraints, opportunities, and challenges) influencing the market growth
- To define, describe, and forecast the market size, based on form, application, and region
- To forecast the market size along with segments and submarkets, in key regions: North America, Europe, Asia Pacific (APAC), Middle East & Africa (MEA), and South America along with their key countries
- To strategically analyze micro markets, for individual growth trends, prospects, and their contribution to the total market
- To analyze growth opportunities in the market for stakeholders and provide details on the competitive landscape for market leaders
- To strategically profile key players and comprehensively analyze their market shares and core competencies
- To analyze competitive developments, such as merger & acquisition, expansion & investment, and agreements in the Sodium silicate market
Key Questions Addressed by the Report
Need a Tailored Report?
Customize this report to your needs
Get 10% FREE Customization
Customize This ReportPersonalize This Research
- Triangulate with your Own Data
- Get Data as per your Format and Definition
- Gain a Deeper Dive on a Specific Application, Geography, Customer or Competitor
- Any level of Personalization
Let Us Help You
- What are the Known and Unknown Adjacencies Impacting the Sodium Silicate Market
- What will your New Revenue Sources be?
- Who will be your Top Customer; what will make them switch?
- Defend your Market Share or Win Competitors
- Get a Scorecard for Target Partners

Custom Market Research Services
We Will Customise The Research For You, In Case The Report Listed Above Does Not Meet With Your Requirements
Get 10% Free CustomisationTESTIMONIALS

We at Nissan Chemicals Corporation have been clients of MarketsandMarkets for more than a year now. We recently consulted MarketsandMarkets for a study, the team at MarketsandMarkets was extremely professional and organized. The business insights were very detailed and aligned well with our expectations that really helped us formulate the Business Plans and device new strategies for development themes. MarketsandMarkets offers a unique combination of expertise and dedicated engagement model. Their research findings have helped us in designing our Pricing Strategy which will make it easier for us to predict the future sales and profits for the next ten years. We look forward to working with MarketsandMarkets in the future.
VP of Strategy & New Business Development
Leading Specialty Chemical Company
The MarketsandMarkets Engagement Model, composed of both the Knowledge Store and advisory custom research, has greatly helped us in understanding our markets and making strategic decisions. The Knowledge Store is a fast way to allow everyone in our organization to understand more about most any market they are interested in. The ability to then get custom research done and get answers to specific strategic questions and market insight has been spectacular. The Markets and Markets team feel more like colleagues than vendors and their services have helped us change our culture where statements of things like growth opportunities and competitive position are always backed by industry research.

Rich Gibson,
Director, Corporate Strategy
Milliken & Company,
Leading Industrial Manufacturer of specialty chemical, floor covering, performance and protective textile materials, and healthcaremilliken.com
MarketsandMarkets is a trusted resource that helps us to better understand markets that are near-adjacencies-whether its technology, value chain or geography. Their Knowledge Store platform provides a dashboard of markets and their characteristics which is easy to use and saves us time.
Adam Shaw,
Market Development and Strategy Manager
AdvanSix Inc. USA,
An American Leader in Chemicalswww.advansix.com
The Knowledge Store from MarketsandMarkets is a valuable tool which has helped my team acquire greater insight in to the end markets that our business serves. This has enabled us to help our company build stronger strategies throughout our planning process.
TOSHIO KINOSHITA
Senior Chif Consultion Research & Consulting Division
Mitsubishi Chemical Research Corporation,
Leading Manufacturer of Chemical Productswww.mitsubishichem-res.co.jp/en/

We recently engaged with MarketsandMarkets for a study, the team not only clearly understood our business objectives but was also extremely professional in the way they handled the entire project. The study was efficiently conducted in a phase-wise manner, and the engagement model furnished us with high-quality business insights that far exceeded our expectations at each phase. We were especially happy that MarketsandMarkets could provide us with both, an English as well as a Japanese version of the study. A special thanks to the Analyst Team and Client Services Team, whose fluency in Japanese enhanced our comfort level, as we could converse with them in our preferred language.
Independent entrepreneurs
Arrow Precision
We approached MarketsandMarkets for study on Proppants Market, and their work exceeded our expectations. The study conducted was comprehensive and enabled us to view the market through the various dimensions. In addition, the team was extraordinarily responsive throughout the process and resolved our queries on time. I strongly recommend MarketsandMarkets and will certainly consider them for additional market assessments we will need in the future.
Global engineering company, Japan
Deputy Manager,
Strategic Planning OfficeThe high-quality insights shared by the MarketsandMarkets team helped us understand the pharmaceutical plant designers in a specific geography. It also captured the risks that we may likely face in communicating with our potential partners. The study would enable us identify partners, which would impact our future growth.


Growth opportunities and latent adjacency in Sodium Silicate Market