Switchgear Market

Switchgear Market by Insulation type (Gas-insulated, Air-insulated), Installation (Indoor, Outdoor), Current (AC, DC), Voltage (Low, Medium, High), End User (Power Utilities, Industries, Renewables, Datacenter), and Region - Global Forecast to 2031




OVERVIEW
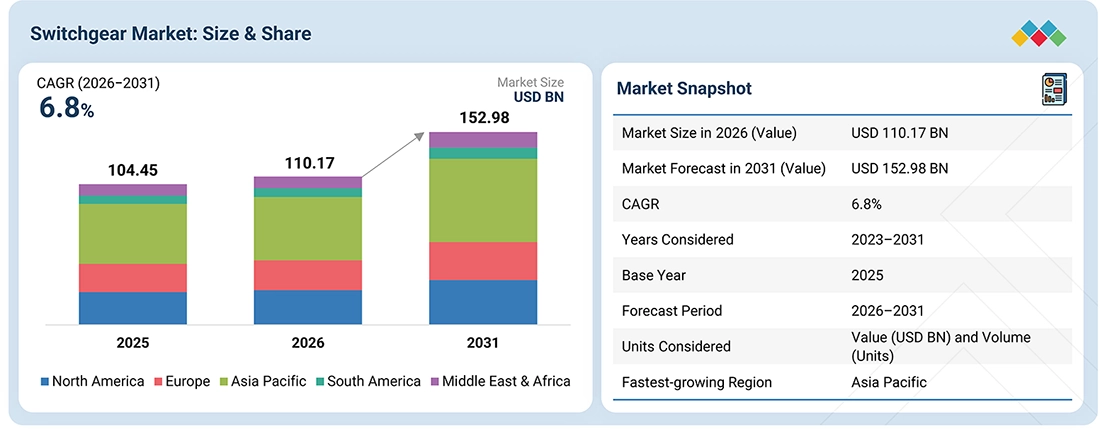
Source: Secondary Research, Interviews with Experts, MarketsandMarkets Analysis
The switchgear market is estimated to be USD 110.17 billion in 2026 and is projected to reach USD 152.98 billion by 2031, growing at a CAGR of 6.8% during the forecasted period. The switchgear market's growth is being propelled by the accelerating pace of grid modernization and electrification investments worldwide, as utilities replace aging, decades-old infrastructure with digital, IoT-enabled switchgear capable of remote monitoring, fault detection, and predictive maintenance. The rapid buildout of renewable energy capacity—solar and wind in particular—is a major catalyst, since every new generation asset requires switchgear for grid interconnection, substation protection, and power evacuation, while the intermittent and variable nature of renewables is pushing utilities toward smarter, faster-switching equipment capable of handling bidirectional power flows. Industrial expansion across Asia Pacific, coupled with urbanization and rising per-capita electricity consumption in emerging economies, is driving substantial new T&D infrastructure spending, and government-backed rural electrification and grid extension programs in countries like India and across Southeast Asia are further amplifying demand.
KEY TAKEAWAYS
-
BY REGIONAsia Pacific is projected to be the fastest-growing region in the switchgear market, registering a CAGR of 7.2% during 2026-2031.
-
BY INSULATION TYPEThe air-insulated switchgear segment held the largest market share in 2025.
-
BY INSTALLATIONOutdoor installations are likely to record a higher CAGR during the forecast period.
-
BY CURRENTThe DC segment is projected to record a higher CAGR during the forecast period.
-
BY VOLTAGEBy voltage, the high (Above 220 kV) segment held the largest share of the overall switchgear market in 2025.
-
BY END USERBased on end user, power utilities accounted for the largest market share in 2025.
-
COMPETITIVE LANDSCAPE - KEY PLAYERSKey players in the switchgear market are ABB (Switzerland), Eaton (Ireland), Schneider Electric (France), GE Vernova (US), and Siemens (Germany), which have employed various strategies to increase their shares in the switchgear market.
-
COMPETITIVE LANDSCAPE - STARTUPS/SMESThe strong product ecosystem and market penetration of Ayr Energy, Inc. (US) and Sunward Technology Co., Ltd. (China) have made them influential startups/SMEs/ leaders in the market.
The explosive growth of data centers—driven by AI workloads, cloud computing, and hyperscale expansion—is creating unprecedented demand for reliable medium- and low-voltage switchgear to ensure uninterrupted power supply, fault isolation, and redundancy in mission-critical facilities. In mature markets like North America and Europe, grid resilience initiatives against extreme weather events, coupled with aging asset replacement cycles, are sustaining steady demand even amid slower load growth. Additionally, the accelerating rollout of electric vehicle charging infrastructure and the broader push toward decarbonization and grid decentralization—through microgrids and distributed energy resources—is expanding the addressable market for compact, environmentally friendly, and modular switchgear solutions, further reinforced by rising capital investment from both public utilities and private industrial players in grid reliability and energy security.
TRENDS & DISRUPTIONS IMPACTING CUSTOMERS' CUSTOMERS
The switchgear industry is undergoing a fundamental revenue mix transformation, shifting from traditional, technology-dependent revenue streams to a new, technology-led growth model. Six emerging technologies are set to redefine customer revenue in the near future: SF6-free/green gas-insulated switchgear, digital substations and IEC 61850-based switchgear, solid-state switchgear/circuit breakers, DC switchgear for data centers and EV infrastructure, compact/modular GIS for space-constrained applications, and AI/IoT-enabled predictive monitoring platforms. These disruptions are cascading across the value chain—compelling T&D utilities to accelerate SF6 phase-out roadmaps in response to tightening environmental regulations, pushing industrial and commercial players to invest in digital grid readiness, driving data center operators to build DC-ready infrastructure to support AI and cloud-driven power demand, and prompting renewable energy and offshore developers to shift their investment philosophy from a pure capital-expenditure mindset to one centered on lifecycle value creation. Collectively, these shifts signal that customers who fail to pivot from legacy revenue sources toward these emerging technology segments risk ceding competitive ground as the market's revenue base fundamentally reconfigures over the coming years.
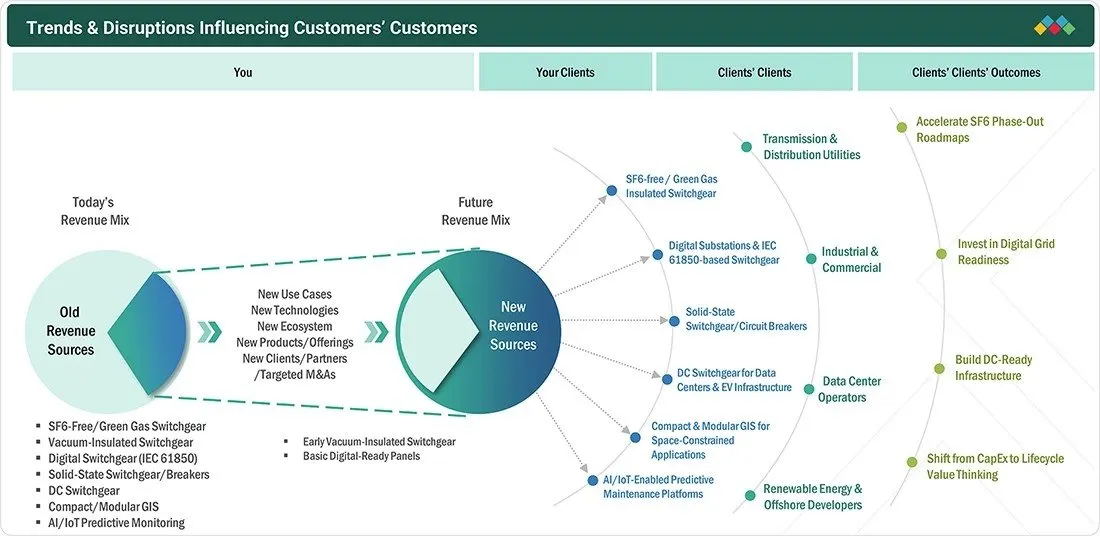
Source: Secondary Research, Interviews with Experts, MarketsandMarkets Analysis
MARKET DYNAMICS

Level
-
Rising global T&D investment to support electrification

-
Data center power demand growth driving MV/HV switchgear needs


Level
-
High capital cost of digital and SF6-free switchgear

-
Volatility in raw material costs


Level
-
Large-scale retrofit demand from aging SF6 installed base

-
Digital/smart switchgear enabling recurring service revenue


Level
-
Cybersecurity risk from increased digital substation connectivity

Source: Secondary Research, Interviews with Experts, MarketsandMarkets Analysis
Rising global T&D investment to support electrification
Utilities and grid operators worldwide are ramping up transmission and distribution investments to accommodate rising electricity demand from the electrification of transport, heating, and industrial processes. This surge in infrastructure spending is directly translating into higher procurement of switchgear across all voltage levels, as new substations, feeder networks, and interconnection points require reliable protection and switching equipment. Government-backed grid expansion programs, particularly in emerging economies, alongside grid-strengthening initiatives in mature markets to accommodate renewable integration, are creating a sustained pipeline of switchgear demand expected to persist well into the forecast period.
High capital cost of digital and SF6-free switchgear
While digital and SF6-free switchgear offer superior environmental and operational benefits, their significantly higher upfront capital costs compared to conventional SF6-based alternatives remain a key barrier to widespread adoption, particularly for utilities and industrial players operating under tight capex constraints. Smaller utilities and cost-sensitive end users in price-competitive markets often delay procurement decisions or opt for conventional technologies, slowing the pace of transition despite regulatory pressure. This cost differential is especially pronounced in emerging economies, where budget limitations can outweigh long-term lifecycle savings, thereby moderating overall market growth in the near term.
Large-scale retrofit demand from aging SF6 installed base
A substantial share of the global switchgear installed base, particularly in North America and Europe, is approaching or has exceeded its operational lifespan, creating a significant retrofit and replacement opportunity. As utilities face mounting pressure to phase out SF6 because of environmental regulations, this aging installed base presents a dual opportunity for manufacturers—capturing replacement revenue while upselling customers on next-generation, eco-efficient, and digitally enabled switchgear. This retrofit wave is expected to be a meaningful growth lever, particularly for vendors with strong service and lifecycle management capabilities.
Cybersecurity risk from increased digital substation connectivity
As switchgear becomes increasingly digitalized and integrated into IoT-enabled smart grid ecosystems, expanding connectivity heightens exposure to cybersecurity threats, including potential grid disruptions from malicious attacks on substation control systems. This growing attack surface poses a critical challenge for utilities and industrial operators, who must now balance the operational benefits of digital switchgear with the imperative to invest in robust cybersecurity frameworks, secure communication protocols, and continuous threat monitoring. Failure to adequately address these risks could undermine customer confidence in digital switchgear adoption and slow the broader digital transformation of grid infrastructure.
SWITCHGEAR MARKET: COMMERCIAL USE CASES ACROSS INDUSTRIES
| COMPANY | USE CASE DESCRIPTION | BENEFITS |
|---|---|---|
 |
Siemens Energy is supplying its 8VM1 Blue SF6-free gas-insulated switchgear (GIS) for the Hornsea 3 offshore wind farm off the UK coast. The 2.9 GW project comprises 197 turbines, with the switchgear installed within the wind-turbine towers. The 8VM1 Blue switchgear uses clean-air insulation and vacuum switching technology instead of SF6. As of mid-2026, Siemens Energy had delivered 2,870 GIS units for offshore wind-turbine applications. | Reduces greenhouse-gas emissions by approximately 900 tonnes of CO2 equivalent per switchgear unit compared with conventional SF6-filled bays | Eliminates the use of SF6, avoiding its high global-warming impact | Reducing the need for special handling, recycling, and reporting |
 |
TGOOD supplied 104 units of TGS-40.5 kV medium-voltage gas-insulated switchgear enclosed in prefabricated substation kiosks for the Western Downs Battery Energy Storage System (BESS) in Australia. The project was delivered in stages, with the second stage completed in July 2025. | Provides compact and integrated MV switchgear for BESS grid connection | Enabling reliable power switching and protection within prefabricated substation infrastructure while supporting faster deployment of energy-storage projects |
 |
GE Vernova commissioned 765 kV and 400 kV GIS bays at Khavda, Gujarat, for Adani, together with a 500 MVA transformer and 125 MVAR reactor. The project forms part of India's high-voltage transmission infrastructure supporting the rapidly developing renewable-energy region of Khavda. | Provides high-voltage transmission infrastructure capable of transferring large volumes of electricity from the Khavda renewable-energy zone | Supporting grid expansion and renewable-power evacuation |
Logos and trademarks shown above are the property of their respective owners. Their use here is for informational and illustrative purposes only.
MARKET ECOSYSTEM
The switchgear market ecosystem spans the entire value chain, from raw material sourcing to end user consumption. At the upstream level, raw material suppliers such as Aurubis (Germany) and ArcelorMittal (Luxembourg) provide critical inputs such as copper and steel essential for switchgear manufacturing, while component manufacturers, including TE Connectivity (Switzerland) and Phoenix Contact (Germany), supply connectors, relays, and control components integral to switchgear assemblies. The market manufacturing tier is dominated by global heavyweights such as Eaton (Ireland) and ABB (Switzerland), alongside other major players like Siemens Energy (Germany) and Schneider Electric (France), who design and produce the full spectrum of switchgear solutions across voltage classes. Distribution is facilitated by companies such as Rexel (France) and Graybar (US), which ensure last-mile availability and logistical support for end markets. Finally, at the demand end, utilities and industrial conglomerates such as State Grid Corporation of China (China) and National Grid (UK) represent major end users driving procurement of switchgear for transmission, distribution, and industrial power infrastructure. This interconnected ecosystem underscores the complex, multi-tiered nature of the switchgear industry, where value creation and competitive positioning depend on relationships among suppliers, manufacturers, distributors, and end users.
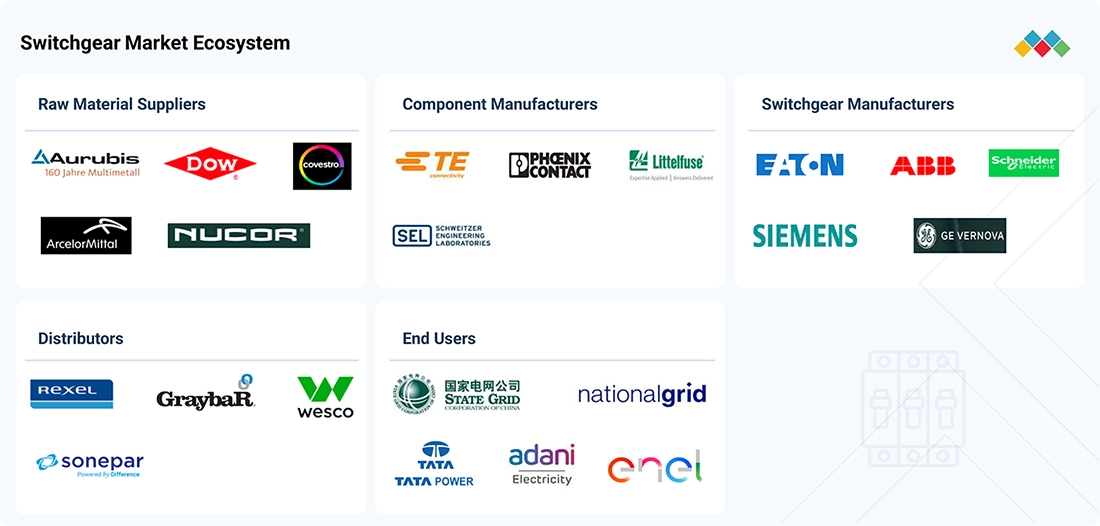
Logos and trademarks shown above are the property of their respective owners. Their use here is for informational and illustrative purposes only.
MARKET SEGMENTS
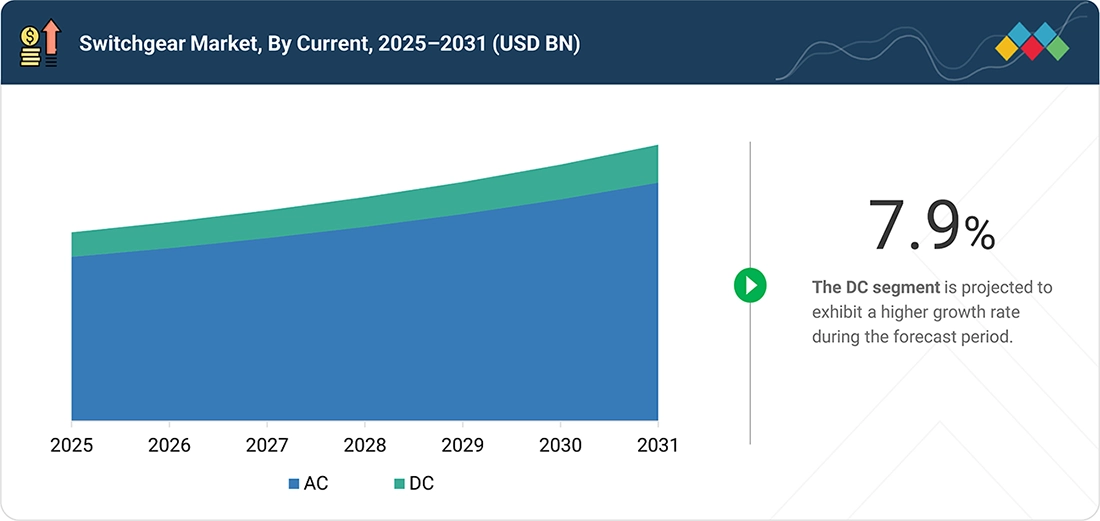
Source: Secondary Research, Interviews with Experts, MarketsandMarkets Analysis
Switchgear market, By Insulation Type
Air-insulated switchgear commands the largest share of the switchgear market in 2025, underpinned by its lower upfront cost, mature and well-established technology base, and ease of maintenance compared to gas-insulated alternatives. AIS remains the preferred choice across price-sensitive and space-abundant markets, particularly in emerging economies where cost efficiency often outweighs the compactness benefits offered by gas-insulated switchgear. Its widespread deployment across low- and medium-voltage applications in utility, industrial, and commercial settings, combined with a large existing installed base requiring replacement and expansion, continues to reinforce AIS's dominant position, even as GIS gains traction in space-constrained urban and environmentally regulated markets.
Switchgear market, By Installation
The indoor installation segment holds the largest market share in 2025, driven by its widespread adoption across urban substations, commercial buildings, industrial facilities, and data centers, where space optimization, protection from environmental elements, and enhanced safety are critical priorities. Indoor switchgear offers superior resilience against harsh weather conditions, reduced maintenance requirements, and better suitability for densely populated and space-constrained environments—factors that are increasingly important as urbanization accelerates and grid infrastructure moves closer to load centers. The segment's dominance is further reinforced by growing demand from data centers and commercial real estate, where indoor-rated switchgear is essential to meet stringent reliability and safety standards.
Switchgear market, By Current
The AC segment holds the largest market share in 2025, reflecting the continued dominance of alternating current as the backbone of global transmission and distribution infrastructure. Since the vast majority of existing grid networks, generation assets, and end-use equipment are designed around AC systems, switchgear demand remains overwhelmingly concentrated in AC applications across utility, industrial, and commercial segments. While DC switchgear is gaining momentum on the back of data center growth, EV charging infrastructure, and renewable energy integration, the sheer scale of legacy AC grid infrastructure and the high cost of transitioning existing networks ensure AC switchgear retains its commanding market position through the near term.
Switchgear market, By Voltage
The high voltage (above 220 kV) segment holds the largest market share in 2025, driven by its critical role in bulk power transmission across national and regional grids, where reliability and fault protection at scale are paramount. Sustained investment in ultra-high-voltage transmission corridors, cross-border interconnections, and large-scale renewable energy evacuation infrastructure, particularly in China, India, and other high-growth Asia Pacific markets, continues to anchor demand for high-voltage switchgear. Additionally, aging transmission infrastructure replacement cycles in North America and Europe, coupled with growing investments in grid resilience and long-distance power transmission to connect remote generation sources with demand centers, further reinforce the segment's leading position in the overall market.
Switchgear market, By End User
The power utilities segment holds the largest market share in 2025, driven by its central role in operating and maintaining the backbone of national and regional power grids. As the primary custodians of grid infrastructure, power utilities represent the single largest procurement base for switchgear across all voltage classes, spanning substations, feeder networks, and interconnection facilities. Sustained investment in grid modernization, renewable energy integration, aging infrastructure replacement, and expanding electrification needs continues to position power utilities as the dominant end-user segment, further reinforced by government-backed grid strengthening initiatives across both developed and emerging markets.
REGION
Asia Pacific to dominate switchgear market during forecast period
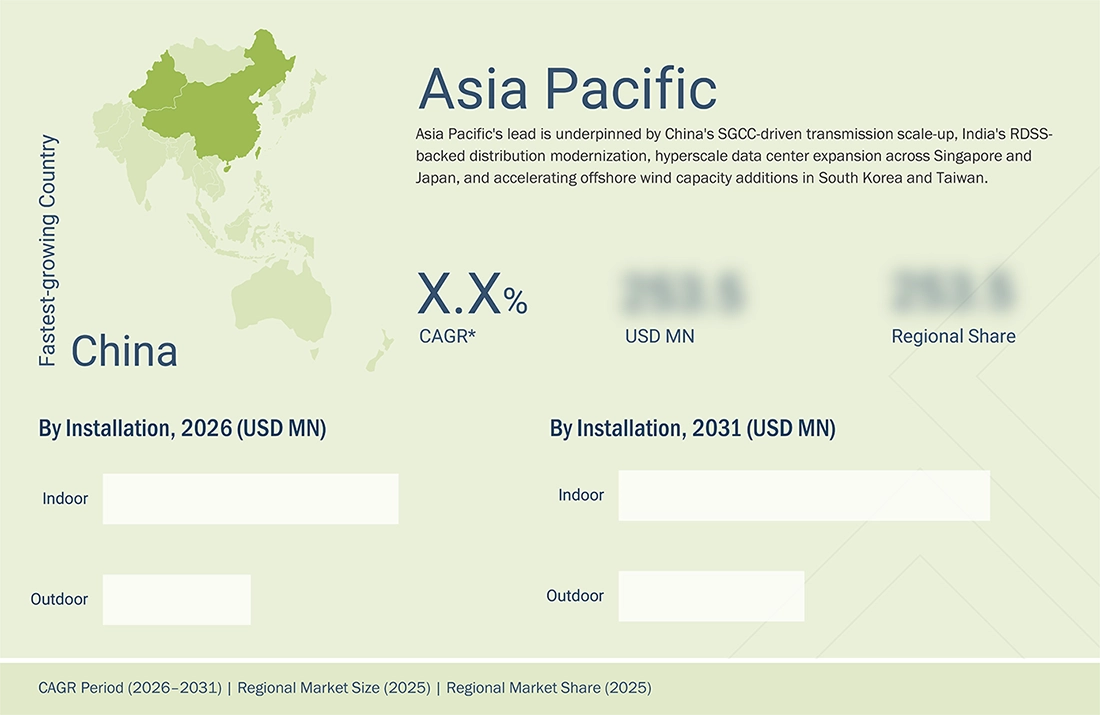
The switchgear market in Asia Pacific is estimated to be USD 47.14 billion in 2026 and is projected to reach USD 66.85 billion by 2031, growing at a CAGR of 7.2% during the forecast period. Asia Pacific's dominant growth in the switchgear market is being driven by rapid industrialization and urbanization across China, India, and Southeast Asia, coupled with massive government-backed investments in transmission and distribution infrastructure to support rising electricity demand and grid electrification. China's aggressive renewable energy buildout and ultra-high-voltage grid expansion, alongside India's ambitious rural electrification and "Power for All" initiatives, are creating substantial procurement pipelines for switchgear across all voltage classes, while the region's booming data center construction, fueled by cloud computing and AI infrastructure investments in markets like Singapore, Japan, and India, is generating strong demand for reliable medium- and low-voltage switchgear. Additionally, the region's accelerating shift toward solar and wind capacity addition, growing EV adoption, and increasing focus on smart grid modernization and digital substations are pushing utilities and industrial players to adopt next-generation, digitally enabled, and increasingly SF6-free switchgear solutions, further reinforced by rising foreign direct investment in manufacturing and infrastructure that continues to position Asia Pacific as the fastest-growing and largest regional market through 2031.
SWITCHGEAR MARKET: COMPANY EVALUATION MATRIX
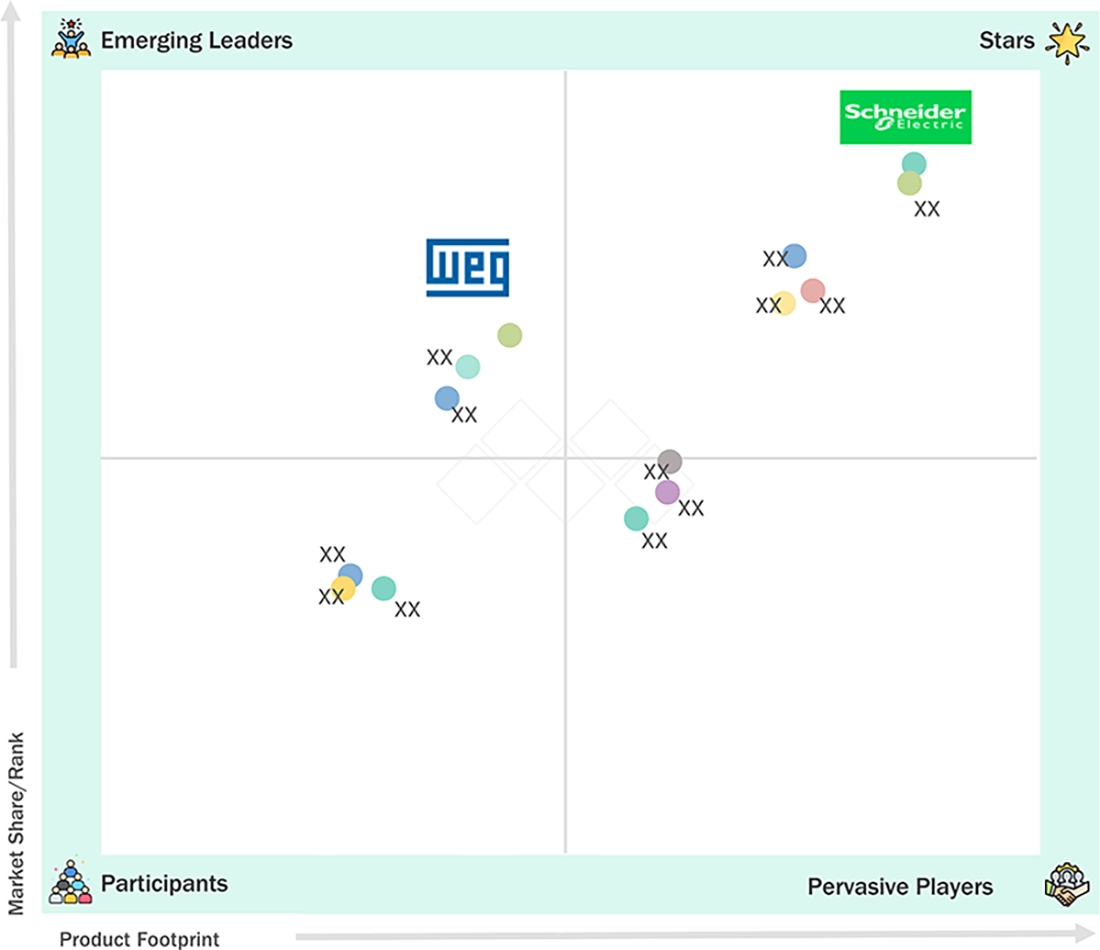
Schneider Electric (France) stands out as a star player in the switchgear market, backed by its broad portfolio, strong global utility relationships, and leadership in SF6-free and digital switchgear innovation. In contrast, WEG (Brazil) is emerging as a fast-rising challenger, leveraging competitive pricing and a strong foothold across Latin America and an expanding presence in Asia, positioning it as a notable force in the medium-voltage and industrial switchgear space going forward.
Source: Secondary Research, Interviews with Experts, MarketsandMarkets Analysis
KEY MARKET PLAYERS
- ABB (Switzerland)
- Schneider Electric (France)
- Eaton (Ireland)
- Siemens (Germany)
- GE Vernova (US)
- Mitsubishi Electric Corporation (Japan)
- TOSHIBA CORPORATION (Japan)
- Siemens Energy (Germany)
- Hitachi Energy Ltd. (Switzerland)
- WEG (Brazil)
- CHINT Group (China)
- CG Power and Industrial Solutions Limited (India)
- HD Hyundai Electric Co., Ltd. (South Korea)
- HYUSONG HEAVY INDUSTRIES (South Korea)
- Fuji Electric Co., Ltd. (Japan)
- LS ELECTRIC Co., Ltd (South Korea)
- TBEA Co., Ltd. (China)
- Ormazabal (Spain)
- Bharat Heavy Electricals Limited (India)
- MEIDENSHA CORPORATION (Japan)
- TGOOD Global Ltd. (China)
- S&C Electric Company (US)
- G&W Electric (US)
- Sieyuan Electric Co., Ltd. (China)
- nVent (UK)
MARKET SCOPE
| REPORT METRIC | DETAILS |
|---|---|
| Market Size in 2025 (Value) | USD 104.45 Billion |
| Market Size in 2026 (Value) | USD 110.17 Billion |
| Market Forecast in 2031 (Value) | USD 152.98 Billion |
| Growth Rate | 6.8% |
| Years Considered | 2023–2031 |
| Base Year | 2025 |
| Forecast Period | 2026–2031 |
| Units Considered | Value (USD Billion), Volume (Units) |
| Report Coverage | Revenue forecast, company ranking, competitive landscape, growth factors, and trends |
| Segments Covered |
|
| Regions Covered | North America, Europe, Asia Pacific, Middle East & Africa, South America |
WHAT IS IN IT FOR YOU: SWITCHGEAR MARKET REPORT CONTENT GUIDE
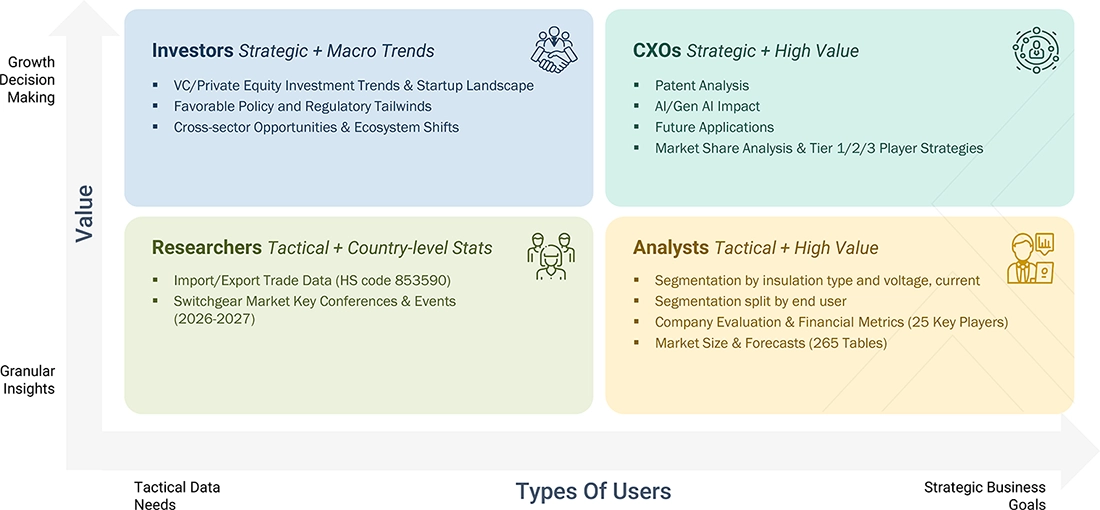
DELIVERED CUSTOMIZATIONS
We have successfully delivered the following deep-dive customizations:
| CLIENT REQUEST | CUSTOMIZATION DELIVERED | VALUE ADDS |
|---|---|---|
| Global and India switchgear market scope with profiling of key players | Profiled 25 global and Indian switchgear market players | Provides a comprehensive competitive landscape and benchmarking of key market participants |
| Switchgear market value by component | Added component-level market sizing for circuit breakers, busbars & conductors, protection & control relays, switch disconnectors & isolators, and other components | Enables deeper assessment of component-level market opportunities and growth areas |
| Switchgear market value and share by voltage | Added market sizing and share analysis for Medium Voltage (11–36 kV), High Voltage (37–220 kV), and Extra High Voltage ( Above 220 kV) | Provides granular understanding of voltage-level market dynamics and identifies high-potential segments |
RECENT DEVELOPMENTS
- July 2026 : ABB completed the acquisition of Specialtrasfo S.p.A. to strengthen its portfolio of specialized medium-voltage transformers, including converter and rectifier transformers, while expanding its integrated electrification offering that also includes switchgear, drives, motors, generators, and custom e-houses for industrial applications.
- June 2026 : Schneider Electric partnered with Southern California Edison to deploy SF6-free, gas-insulated GM AirSeT switchgear at existing US substations, marking the first large-scale deployment of the technology in US utility operations to expand grid capacity and reduce emissions.
- March 2026 : Schneider Electric launched MCSeT, a digitally connected medium-voltage switchgear featuring EvoPacT HVX circuit breakers, integrated IoT sensors, predictive maintenance capabilities, and SF6-free design to enhance reliability, safety, and energy-efficient power distribution.
Table of Contents
 Exclusive indicates content/data unique to MarketsandMarkets and not available with any competitors.
Methodology
The research process for this technical, market-oriented, and commercial study of the 3D printing market included systematic gathering, recording, and analysis of data about companies operating in the market. It involved the extensive use of secondary sources, directories, and databases (Factiva, OANDA) to identify and collect relevant information. In-depth interviews were conducted with various primary respondents, including experts from core and related industries and preferred manufacturers, to obtain and verify critical qualitative and quantitative information, as well as to assess the growth prospects of the market. Key players in the switchgear market were identified through secondary research, and their market rankings were determined through primary and secondary research. This included studying annual reports of top players and interviewing key industry experts, such as CEOs, directors, and marketing executives.
Secondary Research
In the secondary research process, various secondary sources were referred to for identifying and collecting information relevant to this study. Secondary sources include annual reports, press releases, and investor presentations of companies; white papers, certified publications, and articles from recognized authors; directories; and databases. Secondary research was mainly conducted to obtain key information about the supply chain of the industry; the total pool of key players; segmentation of the market according to industry trends, geographic markets, and key developments from market- and technology-oriented perspectives.
Primary Research
During the primary research process, various key sources from the demand side and supply side have been interviewed to gather qualitative and quantitative data for this report. Throughout the comprehensive market engineering process, a combination of top-down and bottom-up approaches, along with multiple data triangulation methods, has been extensively employed to estimate market sizes and forecast all segments and subsegments outlined in this report. Extensive qualitative and quantitative analyses have been undertaken to ensure the integrity of the market engineering process, providing key insights throughout the report. Following completion of the market engineering process, which involved calculations of market statistics, breakdowns, size estimates, forecasts, and data triangulation, thorough primary research has been conducted to gather, verify, and validate critical data points. Primary research has also been conducted to identify market segments, industry trends, and the competitive landscape in the switchgear market.
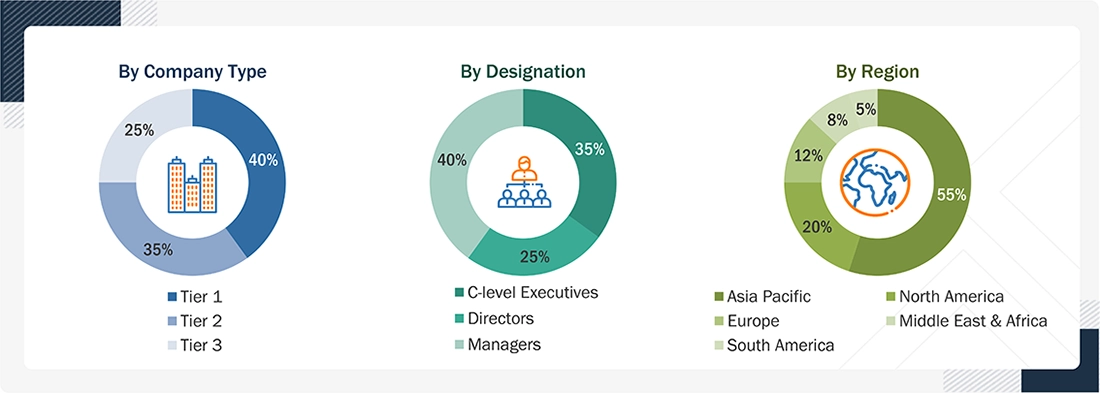
Note: Managers include sales managers, production managers, and regional managers.
Tier 1 company: revenue >USD 5 billion; tier 2 company: revenue between USD 1 and USD 5 billion; and tier 3 company: revenue <USD 1 billion in 2025
To know about the assumptions considered for the study, download the pdf brochure
Market Size Estimation
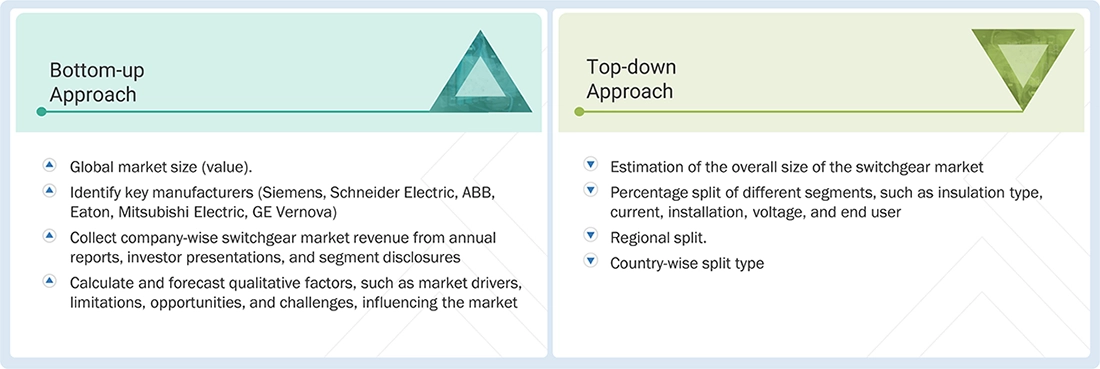
The estimation and validation of switchgear market size have been conducted using a bottom-up approach and top-down approach. These approaches were rigorously employed to ascertain the dimensions of multiple subsegments within the market. The research process comprises the following key stages.
Bottom-up Approach
- Determining the overall value of the switchgear market
- Mapping leading players in the industry, such as Siemens, Schneider Electric, ABB, Eaton, Mitsubishi Electric, GE Vernova, and TOSHIBA CORPORATION
- Gathering segment-specific revenue data for these companies from annual reports, investor presentations, and public disclosures
- Considering key qualitative inputs, including market drivers, restraints, opportunities, and challenges, into the forecasting process
Top-down Approach
- Assessing the total size of the switchgear market
- Breaking this down by segment, covering insulation type, installation, voltage, current, and end user categories
- Allocating market share across regions
- Further refining figures down to individual country-level estimates
Switchgear Market Size: Bottom-up Approach and Top-down Approach
Data Triangulation
The process of determining the overall market size involved the methodologies described earlier, followed by segmenting the market into multiple segments and subsegments. To finalize the comprehensive market analysis and obtain precise statistics for each market segment and subsegment, data triangulation and market segmentation techniques were applied, as appropriate. Data triangulation was accomplished by examining various factors and trends from both the demand and supply perspectives within the ecosystem of the switchgear market.
Market Definition
Switchgear refers to the assembly of electrical disconnect switches, circuit breakers, fuses, relays, and associated control, metering, and protection equipment used to control, protect, isolate, and de-energize electrical equipment within a power system. In simple terms, switchgear acts as the traffic controller of an electrical network, allowing power to be switched on or off, redirected across a network, and, most critically, isolating faulty sections of a circuit during abnormal conditions such as short circuits, overloads, or ground faults. In doing so, it protects expensive upstream and downstream assets, including transformers, generators, motors, and cables, while also safeguarding human operators from the consequences of electrical faults. Functionally, switchgear performs three core roles: control, through routine switching operations that connect or disconnect loads, feeders, or generation sources for operational flexibility and maintenance; protection, by detecting and interrupting fault currents within milliseconds to prevent equipment damage, fire hazards, and cascading outages; and isolation, by providing a visible and safe point of disconnection so equipment can be worked on without risk of accidental re-energization. Switchgear is deployed at virtually every point in the electricity value chain, from the moment power leaves a generating station, through transmission and distribution substations, down to the point of final consumption. This spans generation stations across thermal, nuclear, hydro, and renewable sources, transmission substations handling bulk power transfer at high voltage, and distribution networks stepping down power for end consumers. It is equally critical within industrial facilities for process control and motor protection, commercial and institutional buildings for building-level distribution, data centers for high-reliability redundant power supply to critical IT loads, renewable energy installations for collecting and evacuating power from solar and wind farms, and EV charging infrastructure for managing power distribution at charging stations and hubs. In effect, switchgear is the backbone of electrical safety and reliability, and no modern grid, industrial facility, or building can function without it.
The switchgear market, as covered in this study, encompasses the design, manufacturing, and deployment of switchgear equipment used for the control, protection, and isolation of electrical circuits across power generation, transmission, distribution, and end-use applications globally, and has been segmented and forecast to 2031 across several dimensions. By insulation type, the market covers air-insulated switchgear, which uses ambient air as the insulating and arc-quenching medium and is cost-effective where space is not a constraint; gas-insulated switchgear, which uses SF6 or SF6-alternative gases to offer a compact footprint and higher reliability in space-constrained or harsh environments; and other insulation types, comprising vacuum-insulated, oil-insulated, and fluid-insulated switchgear variants. By installation, the market is segmented into indoor switchgear, deployed within enclosed structures such as substations and industrial or commercial buildings, and outdoor switchgear, built with weatherproof enclosures for open-air deployment at substations and utility yards. By voltage, the market covers low voltage (up to 1 kV) for commercial, residential, and light industrial use; medium voltage (2 kV to 36 kV) for distribution networks, industrial plants, and renewable energy collection systems; and high voltage (above 36 kV) for transmission networks and large-scale power evacuation. By current, the market is segmented into AC, the conventional and dominant current type across the power value chain, and DC, which is gaining relevance with the growth of HVDC transmission, data centers, EV charging, and renewable energy systems. By end user, the market spans power utilities, industrial, commercial, data centers, renewables, EV charging infrastructure, and other end users. By region, the market is geographically assessed across North America, Europe, Asia Pacific, South America, and the Middle East & Africa, capturing regional variations in grid infrastructure investment, industrialization, renewable energy adoption, and regulatory frameworks driving switchgear demand. This scope collectively captures the full breadth of switchgear demand, from utility-scale transmission applications down to distributed, end-use installations, reflecting the equipment's foundational role in enabling safe, reliable, and efficient electricity delivery across the evolving global power landscape.
Key Stakeholders
- Raw Material Suppliers
- Component Manufacturers
- Switchgear Manufacturers/OEMs
- EPC Contractors
- System Integrators/Panel Builders
- Distributors/Electrical Wholesalers
- Transmission & Distribution Utilities
- Renewable Energy Developers
- Power Generation Companies
- Industrial End Users
- Data Center Operators
- Commercial & Residential Users
- Water & Wastewater Operators
- Transportation Sector
- Marine & Offshore Operators
- Standards Organizations
- Testing & Certification Bodies
- Government & Regulatory Authorities
- Environmental Regulators
- Engineering & Technical Consultants
- Digital & Automation Technology Providers
- Service & Maintenance Providers
- Retrofit & Modernization Providers
- Logistics Providers
- Financial Institutions & Project Financiers
- Insurance & Risk Assessment Companies
- Recycling & End-of-Life Providers
- Industry Associations
Report Objectives
- To define, describe, analyze, and forecast the switchgear market based on insulation type, installation, voltage, current, end user, and region
- To describe and forecast the market for five key regions: North America, Europe, Asia Pacific, South America, and the Middle East & Africa, along with their country-level market sizes, in terms of value and volume
- To forecast the switchgear market, by region, in terms of volume
- To give comprehensive details regarding the main factors, obstacles, chances, and sector-specific difficulties impacting the expansion of the switchgear market
- To systematically examine the market for switchgear in terms of each segment's contributions to the market, growth trends, and prospects
- To provide value chain analysis, trends/disruptions impacting customer business, market maps, ecosystem analysis, sustainability and regulatory landscape, pricing analysis, patent analysis, case study analysis, technology analysis, key conferences and events, Porter's five forces analysis, macroeconomic outlook, customer landscape & buyer behavior, regulatory analysis, and AI/Gen AI impact on the market.
- To conduct a strategic analysis of micromarkets1 concerning their respective growth trends, planned expansions, and market share contributions
- To sketch a competitive environment for market participants and assess the potential for stakeholders in the switchgear business
- To benchmark players within the market using the company evaluation quadrant, which analyzes market players on various parameters within the broad categories of business and product strategies
- To compare key market players for the market share, product specifications, and applications
- To strategically profile key players and comprehensively analyze their market ranking and core competencies2
- To track and analyze competitive developments in the switchgear market, such as sales contracts, agreements, investments, expansions, product launches, alliances, mergers, partnerships, joint ventures, collaborations, and acquisitions.
Available customizations:
With the given market data, MarketsandMarkets offers customizations based on the company's specific needs. The following customization options are available for the report:
PRODUCT ANALYSIS
- Product Matrix, which provides a detailed comparison of the product portfolio of each company
COMPANY INFORMATION
- Detailed analyses and profiling of additional market players (up to 5)
Key Questions Addressed by the Report
What was the size of the switchgear market in 2025?
The market size of the global switchgear market was USD 103.71 billion in 2025.
What are the major drivers for the switchgear market?
Modernization of power distribution infrastructure and rising investment in industrial production are significant factors driving the switchgear market.
Which is the largest region during the forecast period in the switchgear market?
The Asia Pacific region is estimated to be the largest market during the forecast period.
By voltage, which is the fastest-growing segment during the forecast period in the switchgear market?
The medium (2–36kV) segment is estimated to be the fastest-growing segment during the forecast period.
What can be restraints for the switchgear market?
Regulatory restrictions on SF6 gas emissions are one of the restraints of the switchgear market.


Personalize This Research
- Triangulate with your Own Data
- Get Data as per your Format and Definition
- Gain a Deeper Dive on a Specific Application, Geography, Customer or Competitor
- Any level of Personalization
Let Us Help You
- What are the Known and Unknown Adjacencies Impacting the Switchgear Market
- What will your New Revenue Sources be?
- Who will be your Top Customer; what will make them switch?
- Defend your Market Share or Win Competitors
- Get a Scorecard for Target Partners

Custom Market Research Services
We Will Customise The Research For You, In Case The Report Listed Above Does Not Meet With Your Requirements
Get 10% Free CustomisationTESTIMONIALS

Kimberly Murphy
GLOBAL MARKETING DIRECTOR
Bently Nevada,
Leading Condition Monitoring & Asset Protectionwww.bakerhughesds.com/bently-nevada

MarketsandMarkets™ showed consistent rigor for success and relentlessly worked with Bently Nevada stakeholders to positively impact go-to-market strategy. Their proactiveness and flexibility has been instrumental in achieving the objectives to grow our sales pipeline in key industrial markets.

DARRICK HUEBER
Business Development Leader
Nexus Controls LLC,
Leading Manufacturer of Automation System & Electrical Panelswww.bakerhughesds.com/nexus-controls

We partnered with MarketsandMarkets to expand our business further by tapping into new industrial segments. It was critical for us to gather crucial business insights about specific markets to achieve this goal. MarketsandMarkets engagement model and client services helped us provide those insights, it was really impressive and valuable for my business. The team was extremely flexible and helpful.

Mike Schoff
Global Industrial Commercial Strategy Leader
Nexus Controls LLC
Leading Manufacturer of Automation System & Electrical Panelswww.bakerhughesds.com/nexus-controls
We consulted MarketsandMarkets for potential Partner Identification. Overall, it was a good experience. The insights provided through interviews conducted by the team helped us put together the questionnaire required for discussion with the selected partners. Their ability to provide insights through interviews with customers in a timely manner was quite impressive.
- China Switchgear Market
- India Switchgear Market
- Japan Switchgear Market
- Australia Switchgear Market
- Germany Switchgear Market
- UK Switchgear Market
- France Switchgear Market
- Italy Switchgear Market
- Canada Switchgear Market
- US Switchgear Market
- Mexico Switchgear Market
- UAE Switchgear Market
- Saudi Arabia Switchgear Market
- Egypt Switchgear Market
- South Africa Switchgear Market
- Brazil Switchgear Market
- Argentina Switchgear Market
- Rest Of Europe Switchgear Market
- Rest Of Apac Switchgear Market
- GCC Switchgear Market
- Rest Of GCC Switchgear Market
- Rest Of South America Switchgear Market
Growth opportunities and latent adjacency in Switchgear Market




Linda
Jun, 2022
We want a Scorecard for Competitors in the switchgear Market projected forecast should be 2022 to 2030..