
Printed Electronics Market Size, Share & Trends

Printed Electronics Market by Printing Technology (Screen, Inkjet, Flexographic, Gravure Printing), Material (Inks, Substrates), Resolution (Below 100 Lines/CM, 100-200 Lines/CM, Above 200 Lines/CM) and Geography - Global Forecast to 2030


OVERVIEW
Source: Secondary Research, Interviews with Experts, MarketsandMarkets Analysis
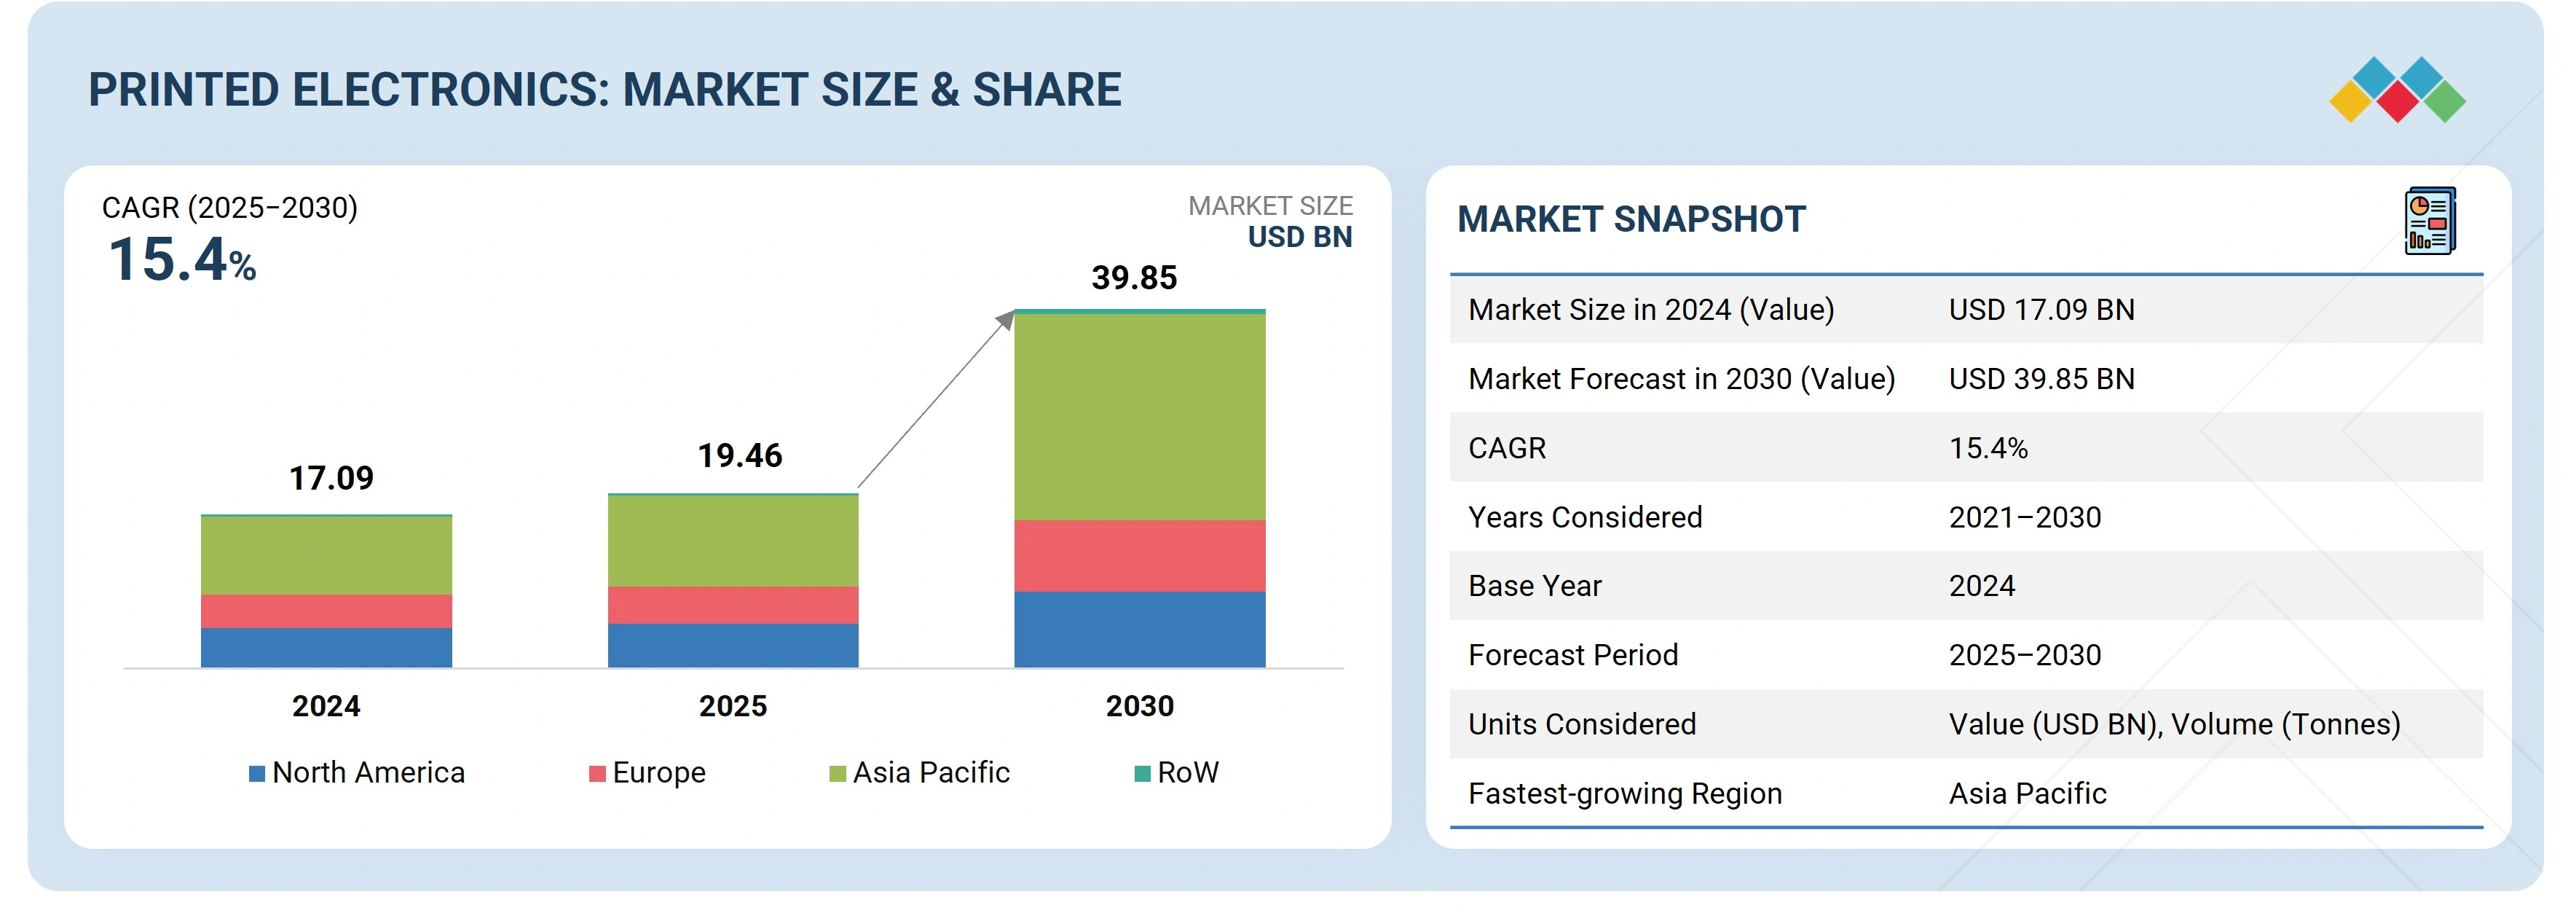
The global printed electronics market is projected to grow from USD 19.46 billion in 2025 to USD 39.85 billion by 2030, at a CAGR of 15.4%. Factors driving the printed electronics market are the rising demand for flexible and lightweight electronic components across industries. Unlike conventional electronics, printed electronics enable thin, bendable, and cost-effective devices that can be integrated into diverse applications such as wearable health monitors, smart packaging, automotive sensors, and flexible displays. This versatility supports miniaturization, energy efficiency, and new product design possibilities. Additionally, the growth of the Internet of Things (IoT) and increasing adoption of connected devices are fueling the need for printed sensors and RFID tags, further accelerating market expansion and attracting investment in advanced materials and technologies.
Market Size & Forecast
KEY TAKEAWAYS
-
BY PRINTNG TECHNOLOGYBy printing technology, the printed electronics market is segmented into inkjet printing, screen printing, flexographic printing, gravure printing, and other printing technologies. The screen printing technology segment is expected to account for the largest share in the market due to its versatility, scalability, and cost-effectiveness.
-
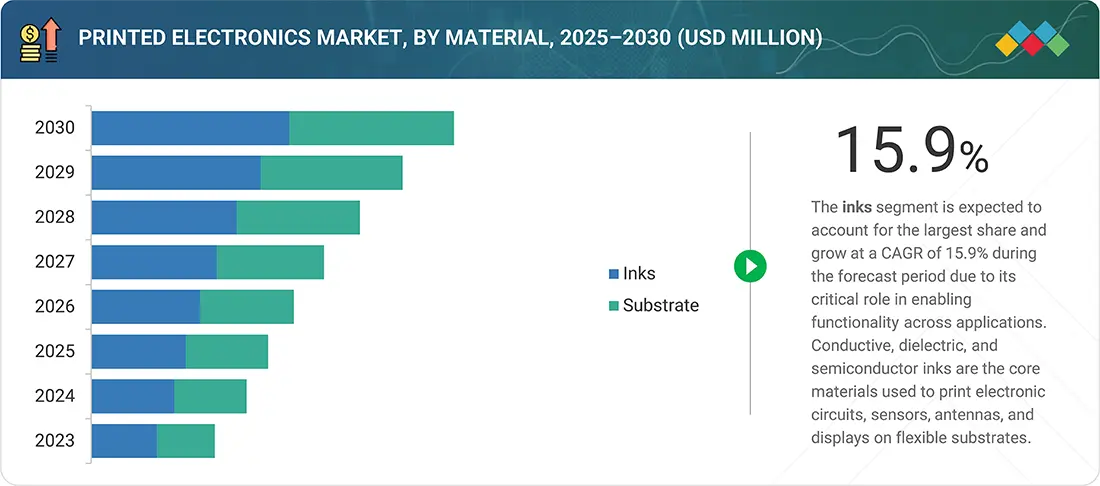
BY MATERIALBy material, the printed electronics material is segmented into inks and substrates. The inks segment is estimated to account for the larger share of the printed electronics market during the forecast period due to its critical role in enabling functionality across applications.
-
BY RESOLUTIONBy resolution, the printed electronics market is segmented into below 100 lines/cm, 100-200 lines/cm, and above 200 lines/cm. The below 100 lines/cm accounts for the largest share due to its cost-effectiveness and suitability for mass-production applications.
-
BY APPLICATIONBy application, the printed electronics market is segmented into displays, RFID tags, batteries, photovoltaic cells, sensors, lighting, and other applications. The displays segment is estimated to account for largest market share by 2030. The widespread adoption of displays across consumer electronics, automotive, retail, and healthcare industries are driving the market for printed electronics.
-
BY END-USE INDUSTRYBy end-use industry, the printed electronics market is segmented into automotive & transportation, healthcare, consumer electronics, aerospace & defense, construction & architecture, retail & packaging, and other end-use industries. The automotive & transportation accounts for the largest market share due to rising adoption of printed sensors, displays, and lighting solutions for advanced vehicle electronics and lightweight designs.
-
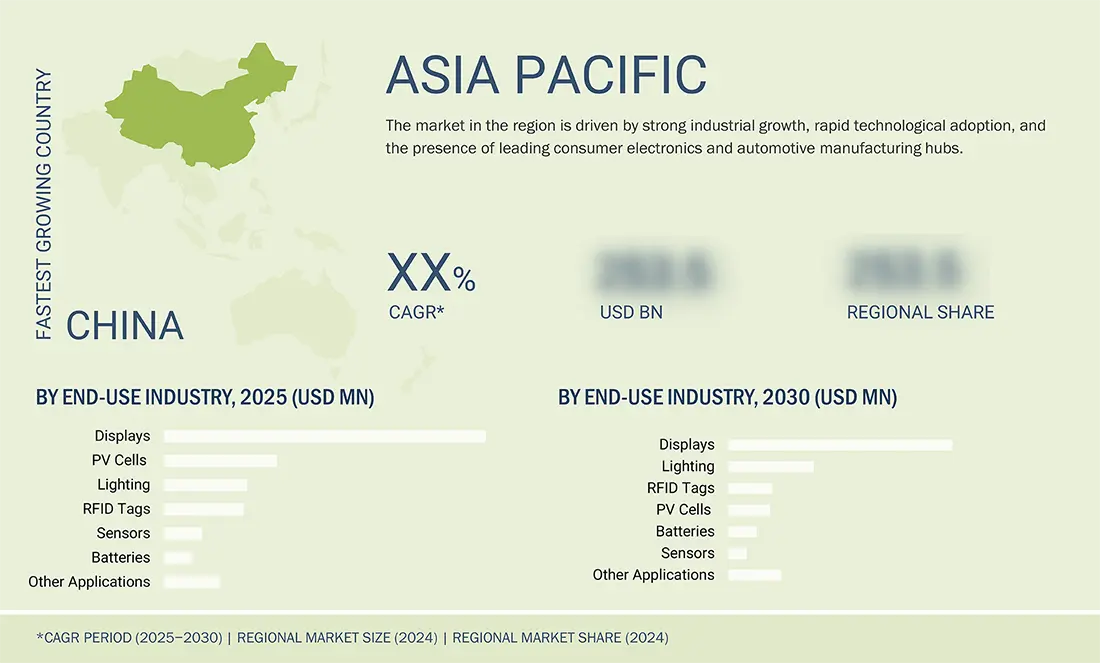
BY REGIONAsia Pacific is projected to register the highest CAGR of 17.8% during the forecast period, fueled by strong industrial growth, rapid technological adoption, and the presence of leading consumer electronics and automotive manufacturing hubs.
-
COMPETITIVE LANDSCAPEThe major market players have adopted both organic and inorganic strategies, including partnerships and investments. For instance, DuPont and Henkel AG & Co. KGaA entered into number of agreements and partnerships to cater to the growing demand for printed electronics across innovative applications.
The printed electronics industry is projected to grow rapidly over the next decade. Printed electronics enable the production of thin, flexible, and lightweight components such as sensors, antennas, and circuits that are essential for IoT applications. Their cost-effectiveness and scalability make them suitable for integration into everyday products, from smart packaging to wearable devices. As industries increasingly focus on connectivity and data-driven solutions, the need for efficient printed electronic components continues to rise.
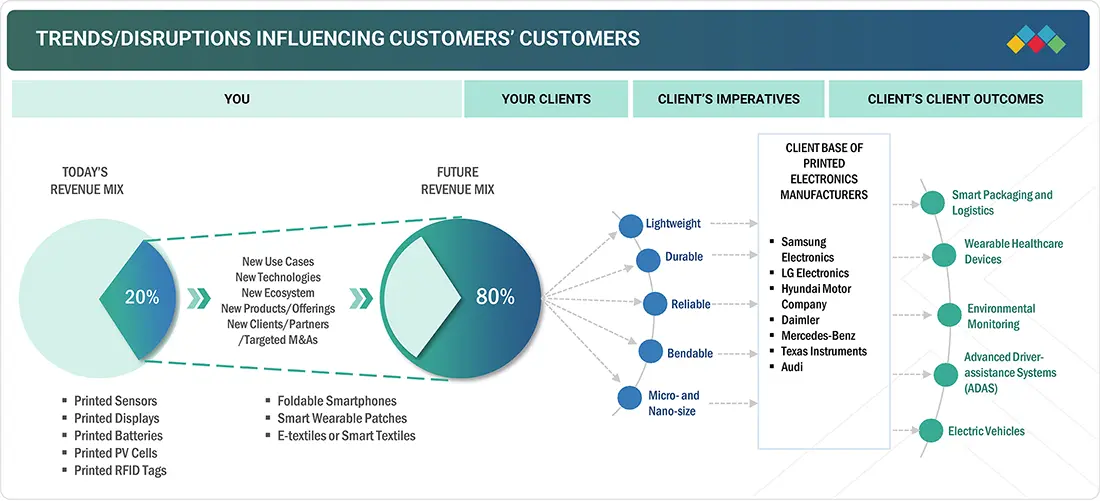
TRENDS & DISRUPTIONS IMPACTING CUSTOMERS' CUSTOMERS
The disruptions and emerging trends impacting customers’ businesses in the printed electronics market include the growing demand for printed electronics in the consumer electronics, healthcare, and automotive & transportation industries.
Source: Secondary Research, Interviews with Experts, MarketsandMarkets Analysis
MARKET DYNAMICS
Level
-
Increased demand in automotive & transportation

-
Increased adoption of IoT in various end-use industries

Level
-
High investment cost

Level
-
Growing adoption of smart and connected devices across industries

-
Increasing adoption of smart packaging

Level
-
Lack of standardization and performance reliability

Source: Secondary Research, Interviews with Experts, MarketsandMarkets Analysis
Driver: Increased demand in automotive & transportation
The automotive & transportation sector is a key growth driver for the printed electronics market, driven by the rising use of smart, lightweight electronic components to enhance functionality while reducing weight and costs. Automakers are adopting printed sensors, flexible circuits, and OLED lighting for dashboards, touch panels, and interiors to improve efficiency and user experience. Conductive ink-based heaters and defoggers are increasingly used in windshields, mirrors, and cameras to enhance safety. In EVs, printed electrodes and sensors optimize battery performance and reliability. The surge in connected and autonomous vehicles is boosting demand for printed RFID tags, antennas, and flexible displays. With growing emphasis on sustainability, safety, and smart mobility, printed electronics adoption in transportation is set to expand rapidly.
Restraint: High investment cost
A key restraint for the printed electronics market is the high initial investment required for technology development, specialized equipment, and production facilities. Advanced materials like conductive inks, substrates, and nanomaterials are expensive to produce at scale, adding to costs. Setting up precision printers, curing systems, and quality-control processes demands substantial capital, posing challenges for SMEs. Moving from prototypes to mass production requires further investment in R&D, testing, and certification to meet industry standards. Customization needs in automotive, healthcare, and electronics add to expenses and delay commercialization. High costs also limit adoption in price-sensitive sectors such as packaging. Until economies of scale and standardized processes are achieved, high investment costs will continue to restrain market growth.
Opportunity: Growing adoption of smart and connected devices across industries
The growing adoption of smart and connected devices, fueled by IoT expansion, is creating major opportunities for the printed electronics market. Printed components like sensors, RFID tags, antennas, and flexible displays offer thin, lightweight, and cost-efficient solutions that integrate easily into everyday products. In healthcare, printed biosensors and wearables enable real-time monitoring, while in retail and packaging, smart labels enhance engagement and supply chain visibility. Automotive applications include lightweight sensors, flexible lighting, and energy-efficient batteries for EVs and autonomous vehicles. Additive manufacturing further supports low-cost, large-scale production, accelerating commercialization. Rising focus on sustainability also boosts demand for eco-friendly, recyclable printed electronics over traditional rigid systems.
Challenge: Lack of standardization and performance reliability
A major challenge for the printed electronics market is the lack of standardization and consistent performance compared to traditional electronics. While offering flexibility and cost benefits, printed components often struggle with conductivity, durability, and precision under harsh conditions like heat, humidity, or mechanical stress. This limits adoption in critical sectors such as aerospace, automotive, and healthcare, where long-term reliability is essential. The absence of universal standards for inks, substrates, and processes also creates compatibility issues, hindering large-scale integration and interoperability. Scaling from lab prototypes to mass production frequently results in variability and higher defect rates. Continuous R&D in nanomaterials and printing technologies is needed, but high costs remain a barrier. Until reliability and standardization improve, adoption in high-performance applications will face significant constraints.
Printed Electronics Market: COMMERCIAL USE CASES ACROSS INDUSTRIES
| COMPANY | USE CASE DESCRIPTION | BENEFITS |
|---|---|---|
 |
Conductive inks, flexible substrates, and advanced materials for printed sensors, OLED displays, photovoltaics, and smart packaging | High conductivity, durability, and scalability for large-area electronics; supports flexible, lightweight, and eco-friendly device manufacturing |
 |
Development of specialty polymers, dispersions, and nanomaterials for printed electronics applications like flexible displays, smart labels, and printed batteries | Enhanced material performance, chemical stability, and sustainability; enables cost-efficient production with improved energy efficiency |
 |
Printed conductive inks and functional materials for OLED lighting, smart packaging, printed sensors, and industrial IoT devices | Cost-effective printing solutions, compatibility with multiple substrates, high print quality, and energy-efficient production processes |
 |
Adhesives, conductive inks, and coatings for printed circuit boards, flexible electronics, and wearable medical devices | Strong adhesion, electrical reliability, and protection; supports miniaturization, durability, and design flexibility for consumer and healthcare applications |
 |
Conductive inks and photonic curing systems for printed sensors, RFID antennas, photovoltaics, and flexible displays | High-speed, low-temperature curing for mass production; cost efficiency, scalability, and support for next-gen IoT and smart device integration |
Logos and trademarks shown above are the property of their respective owners. Their use here is for informational and illustrative purposes only.
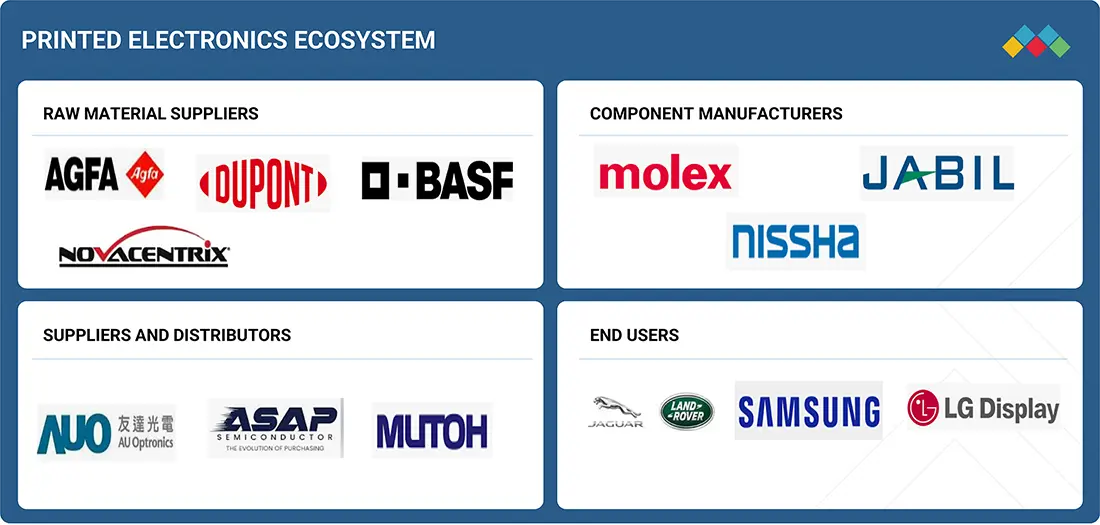
MARKET ECOSYSTEM
The printed electronics ecosystem represents a collaborative network of companies, each fulfilling specialized roles to drive innovation and product delivery in this rapidly advancing industry. From raw material suppliers such as Agfa-Gevaert Group (Belgium), DuPont (US), BASF (Germany), and NovaCentrix (US), to equipment, component, and OEM manufacturers like CERADROP (France), Molex (US), Nissha Co., Ltd. (Japan), Ynvisible Interactive Inc. (Canada), and FUJIFILM Corporation (Japan), the ecosystem integrates diverse technologies and expertise.
Logos and trademarks shown above are the property of their respective owners. Their use here is for informational and illustrative purposes only.
MARKET SEGMENTS
Source: Secondary Research, Interviews with Experts, MarketsandMarkets Analysis
Printed Electronics Market, By Printing Technology
Screen printing technology is expected to account for the largest share in the printed electronics market due to its versatility, scalability, and cost-effectiveness. It is widely used for depositing conductive, dielectric, and functional inks with high precision on a variety of substrates, making it ideal for applications such as RFID tags, sensors, photovoltaics, and displays. The method supports large-area printing and high ink thickness, ensuring durability and conductivity, which are critical for electronic performance. Its long-standing use, compatibility with diverse materials, and ability to deliver consistent, high-volume production make screen printing the dominant technology in the market.
Printed Electronics Market, By Material
The inks segment is expected to account for the larger share of the printed electronics market during the forecast period due to its critical role in enabling functionality across applications. Conductive, dielectric, and semiconductor inks are the core materials used to print electronic circuits, sensors, antennas, and displays on flexible substrates. Among these, conductive inks, often based on silver, copper, or carbon, are witnessing strong demand as they enable high electrical performance in applications such as RFID tags, touch screens, solar cells, and automotive sensors.
Printed Electronics Market, By Resolution
The below 100 lines/cm resolution is estimated to account for the largest share of the printed electronics market due to its low production cost and ease of large-area printing. It is widely used in applications like smart packaging, RFID tags, and basic sensors where ultra-high precision is not essential. This resolution enables faster, scalable manufacturing for mass-market needs. Its compatibility with cost-sensitive industries further drives adoption.
Printed Electronics Market, By Application
Based on application, the lighting segment is expected to grow at the highest CAGR in the printed electronics market during the forecast period. This growth is primarily driven by the increasing adoption of OLED lighting solutions in automotive, consumer electronics, and architectural applications. Printed lighting offers advantages such as flexibility, lightweight design, energy efficiency, and enhanced design freedom, making it ideal for modern, sustainable applications.
Printed Electronics Market, By End-use Industry
Based on end-use industry, the automotive & transportation segment is estimated to account for largest market share by 2030. This growth in the automotive & transportation segment is driven by the increasing integration of advanced electronic components in vehicles, especially electric and autonomous models. Printed electronics are widely used in displays, sensors, heaters, lighting, and RFID tags, offering lightweight, flexible, and cost-effective solutions. The shift towards smart and energy-efficient vehicles is further accelerating adoption.
REGION
Asia Pacific to be fastest-growing region in global printed electronics market during forecast period
Asia Pacific is estimated to account for the largest share in the printed electronics market during the forecast period, driven by strong industrial growth, rapid technological adoption, and the presence of leading consumer electronics and automotive manufacturing hubs. Countries such as China, Japan, and South Korea are global leaders in electronics production, particularly in displays, sensors, and printed circuits, which are core applications of printed electronics.
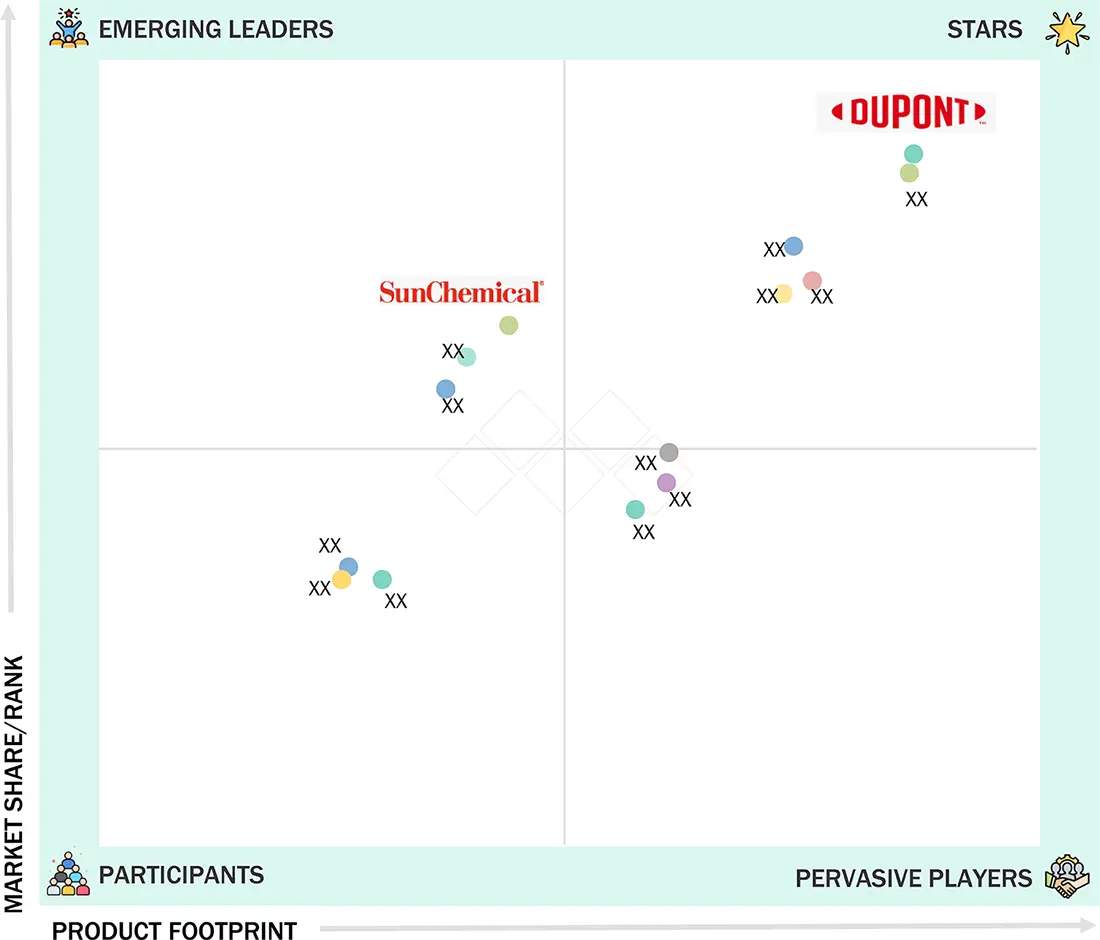
Printed Electronics Market: COMPANY EVALUATION MATRIX
In the printed electronics market matrix, DuPont (US) leads with established product portfolio and a robust market presence. Sun Chemical (US) (Emerging Leader) is steadily gaining traction with focused product portfolios and powerful growth strategies. While DuPont through scale and established customer base, Sun Chemical demonstrates solid growth potential to advance toward the leaders’ quadrant.
Source: Secondary Research, Interviews with Experts, MarketsandMarkets Analysis
KEY MARKET PLAYERS - Top Printed Electronics Companies
MARKET SCOPE
| REPORT METRIC | DETAILS |
|---|---|
| Market Size in 2024 (Value) | USD 17.09 Billion |
| Market Forecast in 2030 (Value) | USD 39.85 Billion |
| Growth Rate | CAGR of 15.4% from 2025-2030 |
| Years Considered | 2021-2030 |
| Base Year | 2024 |
| Forecast Period | 2025-2030 |
| Units Considered | Value (USD Billion) and Volume (Tonnes) |
| Report Coverage | Revenue forecast, company ranking, competitive landscape, growth factors, and trends |
| Segments Covered |
|
| Regions Covered | North America, Europe, Asia Pacific, and RoW |
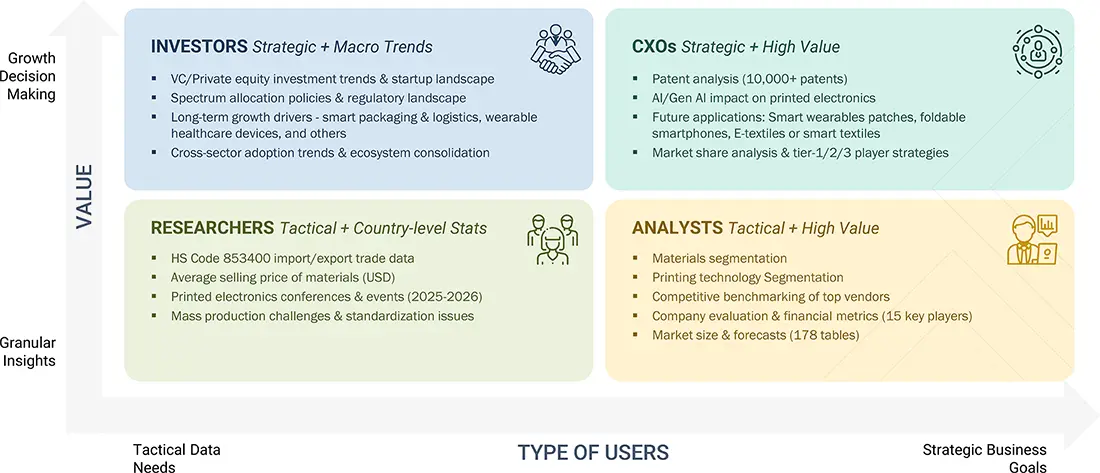
WHAT IS IN IT FOR YOU: Printed Electronics Market REPORT CONTENT GUIDE
DELIVERED CUSTOMIZATIONS
We have successfully delivered the following deep-dive customizations:
| CLIENT REQUEST | CUSTOMIZATION DELIVERED | VALUE ADDS |
|---|---|---|
| Printed Electronics Ink & Substrate Market Breakdown | Deep-dive segmentation: Conductive, dielectric & advanced ink types; substrate categorization (organic, inorganic) | Segment use cases offered by different companies in the market |
RECENT DEVELOPMENTS
- February 2025 : Henkel AG & Co. KGaA (Germany) developed new functional material solutions designed for smart surfaces and connected medical devices, which aim to improve healthcare technology and smart connectivity applications.
- May 2025 : Samsung unveiled advanced R&D achievements at Display Week 2025. The company displayed next-generation display technologies, including its significantly enhanced Electroluminescence Quantum Dot (EL-QD) prototypes, which received the “Distinguished Paper Award” from SID.
- June 2025 : Agfa-Gevaert Group partnered with Technica for distribution of its Orgacon range of printed electronics products across the US. The agreement, effective immediately, marks a significant step in Agfa’s mission to expand its reach and deliver innovative conductive materials to the American market.
- October 2024 : DuPont and Zhen Ding Technology Group signed a strategic cooperation agreement to advance high-end printed circuit board technology development. Through this strategic partnership, DuPont and Zhen Ding will work to enhance end-user applications, advance cutting-edge research and development, improve material performance, and promote the sustainable development of the electronics sector.
- June 2024 : Samsung acquired eMagin Corporation, a US-based developer involved in the design and manufacture of Active-Matrix OLED microdisplays for high-resolution, AR/VR, and other near-eye imaging products. The company announced the completion of its acquisition by Samsung Display Co., Ltd. (“Samsung Display”), a subsidiary of its own i.e. Samsung Electronics Co., Ltd. and manufacturer and distributor of display products, for USD 2.08 per share in an all-cash transaction valued at approximately USD 218 million.
Table of Contents
 Exclusive indicates content/data unique to MarketsandMarkets and not available with any competitors.
Methodology
The study involved major activities in estimating the current size of the printed electronics market. Exhaustive secondary research was done to collect information on printed electronics. The next step was to validate these findings, assumptions, and sizing with industry experts across the value chain using primary research. Different approaches, such as top-down and bottom-up, were employed to estimate the total market size. After that, the market breakup and data triangulation procedures were used to estimate the market size of the segments and subsegments of the printed electronics.
Secondary Research
Revenues from companies offering printed electronics solutions worldwide have been obtained based on the secondary data made available through paid and unpaid sources. They have also been derived by analyzing the product portfolio of key companies, and these companies have been rated according to the performance and quality of their products.
Various sources have been referred to in the secondary research process for identifying and collecting information for this study on the printed electronics market. Secondary sources considered for this research study include government sources; corporate filings (such as annual reports, investor presentations, and financial statements); and trade, business, and professional associations. Secondary data has been collected and analyzed to arrive at the overall market size, which is further validated through primary research.
Secondary research has been mainly used to obtain key information about the supply chain of the printed electronics industry to identify the key players based on their products and identify the prevailing industry trends in the printed electronics market based on the product material, application, and region. It also includes information about the key developments undertaken from both market and technology-oriented perspectives.
Primary Research
In the primary research process, various primary sources from both supply and demand sides have been interviewed to obtain qualitative and quantitative information for this report. The primary sources from the supply side include industry experts such as CEOs, vice presidents, marketing directors, technology and innovation directors, and related key executives from leading companies and organizations operating in the printed electronics markets.
Extensive primary research has been conducted after understanding and analyzing the current scenario of the printed electronics market through secondary research. Several primary interviews have been conducted with key opinion leaders from the demand and supply sides across four main regions—North America, Europe, Asia Pacific, and the RoW. Approximately 25% of the primary interviews were conducted with the demand side, while approximately 75% were conducted with the supply side. This primary data has been collected through questionnaires, emails, and telephonic interviews.

Notes: Other designations include sales & marketing executives and researchers.
The three tiers of the companies are defined based on their total revenue as of 2024; Tier 1: revenue more than or equal to USD 500 million, Tier 2: revenue between USD 100 million and USD 500 million, and Tier 3: revenue less than or equal to USD 100 million.
To know about the assumptions considered for the study, download the pdf brochure
Market Size Estimation
Both the bottom-up and top-down approaches have been adopted to estimate and forecast the size of the printed electronics market.
Bottom-Up Approach
The bottom-up approach has been employed to arrive at the overall size of the printed electronics market. This approach includes estimating the global shipment of printed electronics. This has been followed by the analysis of the average selling prices of global printed electronics. The global market size has been validated through primary interviews with industry stakeholders and subject matter experts.
Approach for obtaining market size using bottom-up analysis (demand side)
- Identifying the companies influencing the entire material market for printed electronics, along with related players
- Analyzing major material manufacturers, studying their portfolios, and understanding the different types of materials offered
- Conducting multiple discussion sessions with key opinion leaders to understand different printed electronic products and their deployment in multiple end-use industries; analyzing the breakup of the work carried out by each key company
- Verifying and cross-checking estimates at every level with key opinion leaders, including chief executive officers (CEO), directors, and operation managers, and then finally with the domain experts of MarketsandMarkets
- Studying various paid and unpaid sources of information, such as annual reports, press releases, white papers, and databases, for the company and region-specific developments undertaken in the printed electronics market
Top-Down Approach
In the top-down approach, the overall size of the printed electronics market has been used to estimate the size of the individual markets (mentioned in the market segmentation) through percentage splits obtained from secondary and primary research. For calculating the size of the specific market segments, the size of the most appropriate and immediate parent market has been used to implement the top-down approach. The bottom-up approach has also been implemented for the data extracted from the secondary research to validate the market size obtained. The sizes of the parent and individual markets have been determined and confirmed in this study by data triangulation and data validation through primaries. The data triangulation procedure used for this study has been explained in the next section.
Approach for obtaining market share using top-down analysis (supply side)
- Focusing initially on top-line investments and expenditures being made in the ecosystem of printed electronics, and listing key developments in key market areas
- Identifying all major players in the printed electronics market by printed electronics-based materials, and their penetration in various end-use industries through secondary research, and verifying through brief discussions with industry experts
- Analyzing revenues, product mix, geographic presence, and key end-use industries for which printed electronics are served by all identified players to estimate and arrive at the percentage splits for all key segments
- Discussing these splits with the industry experts to validate the information and identify key growth pockets across all key segments
- Breaking down the total market based on verified splits and key growth pockets across all segments
Printed Electronics Market : Top-Down and Bottom-Up Approach

Data Triangulation
After arriving at the overall size of the printed electronics market through the process explained above, the total market has been split into several segments and subsegments. Market breakdown and data triangulation procedures have been employed, wherever applicable, to complete the overall market engineering process and arrive at the exact statistics for all segments and subsegments. The data has been triangulated by studying various factors and trends from the demand and supply sides. The market has also been validated using top-down and bottom-up approaches.
Market Definition
Printed electronics is an all-encompassing term referring to the printing method used to create electronic devices by printing on a wide range of substrates. Different technologies, such as screen printing, inkjet printing, or flexographic printing, are used for printing electronic devices on different substrates. Earlier, printed electronics were limited to organic or plastic electronics that used one or more inks made of carbon-based compounds. With the increased demand for compact wearable devices and thinner electronics, printed electronics now form flexible displays, keyboards, antennas, electronic skin patches, and sensors. Printed electronics enable the development of high-quality electronic products, which are thin, flexible, wearable, lightweight, cost-effective, and environmentally friendly.
Key Stakeholders
- Suppliers of raw materials
- Technology investors
- Designers, manufacturers, and suppliers of printed electronic components
- Integrators, suppliers, and service providers of printed electronics equipment
- Government labs
- In-house testing labs
- System integrators
- Distributors, resellers, and traders
- Research institutions and organizations
- Providers of application software
- Printed electronics forums, alliances, consortiums, and associations
- Market research and consulting firms
- End users
Report Objectives
- To describe and forecast the global size of the printed electronics market, in terms of value and volume
- To describe, segment, and forecast the printed electronics market based on printing technology, material, resolution, application, and end-use industry, in terms of value
- To describe and forecast the market for four key regions: North America, Europe, Asia Pacific, and the Rest of the World (RoW), in terms of value
- To describe different substrate transport techniques in printed electronics
- To provide detailed information regarding drivers, restraints, opportunities, and challenges influencing the growth of the printed electronics market
- To provide a detailed overview of the supply chain of the printed electronics ecosystem, along with the average selling prices of printed electronics materials
- To strategically analyze the ecosystem, tariffs & regulations, patent landscape, trade landscape, and case studies pertaining to the market under study
- To strategically analyze micromarkets1 with respect to individual growth trends, prospects, and contributions to the overall market
- To analyze opportunities in the market for stakeholders and provide a competitive landscape of the market
- To analyze competitive developments such as product launches, expansions, partnerships, collaborations, agreements, and acquisitions in the printed electronics market
- To strategically profile the key players in the printed electronics market and comprehensively analyze their market ranking and core competencies2
- To analyze the impact of AI/GenAI, the 2025 US tariff, and the macroeconomic outlook for each region in the printed electronics market
Available Customizations
With the market data given, MarketsandMarkets offers customizations according to the company’s specific needs. The following customization options are available for the report:
Company Information:
- Detailed analysis and profiling of additional market players (up to 7)
Key Questions Addressed by the Report
What are the major driving factors and opportunities for the players in the printed electronics market?
The major factors driving the printed electronics market include increased demand for printed electronic products in automotive & transportation, growth of consumer electronics industry, and increased adoption of IoT by end-use industries. Key opportunities lie in smart packaging, promising newer applications of printed electronics in healthcare, and use of printed electronics to reduce electromagnetic interference associated with 5G technology.
Which region is expected to hold the largest share of the printed electronics market in 2025?
Asia Pacific is projected to capture the largest market share in 2025. This is driven by strong industrial growth, rapid technological adoption, and the presence of leading consumer electronics and automotive manufacturing hubs.
Who are the leading players in the global printed electronics market?
Leading players operating in the global printed electronics market include DuPont (US), BASF (Germany), Agfa-Gevaert Group (Belgium), Henkel AG & Co. KGaA (Germany), and NovaCentrix (US).
Which advanced technologies are expected to drive the printed electronics market?
Nanomaterials & inks, soft lithography, and active-matrix organic light-emitting diodes (AMOLED) are expected to drive the market.
What will the size of the global printed electronics market be in 2025 and 2030?
The global printed electronics market is projected to grow from USD 19.46 billion in 2025 to USD 39.85 billion by 2030, at a CAGR of 15.4%.
Need a Tailored Report?
Customize this report to your needs
Get 10% FREE Customization
Customize This ReportPersonalize This Research
- Triangulate with your Own Data
- Get Data as per your Format and Definition
- Gain a Deeper Dive on a Specific Application, Geography, Customer or Competitor
- Any level of Personalization
Let Us Help You
- What are the Known and Unknown Adjacencies Impacting the Printed Electronics Market
- What will your New Revenue Sources be?
- Who will be your Top Customer; what will make them switch?
- Defend your Market Share or Win Competitors
- Get a Scorecard for Target Partners

Custom Market Research Services
We Will Customise The Research For You, In Case The Report Listed Above Does Not Meet With Your Requirements
Get 10% Free CustomisationGrowth opportunities and latent adjacency in Printed Electronics Market

Still Researching the
Printed Electronics Ecosystem?
See the competitors, opportunity evaluation, and growth signals shaping it - Instantly!
Generate 15+ consulting-grade strategic intelligence outputs - from competitor analysis to board-ready strategy decks, tailored to your Printed Electronics growth question.


Tom
Jan, 2019
I am looking for new investment option and applications pertaining to printed electronics market..
Dr.
Sep, 2019
We are trying to analyse the investment and growth opportunities in printed electronics market. Looking for a complete market forecast and overview of printed electronics market.
Reinhardt
Jun, 2019
I am looking for overall power electronics market ecosystem and overview. Is this a part of your report..
Erhard
Jan, 2019
I would like to know the market overview for global printed electronics market pertaining to end users, suppliers and competitors in the market.
User
Sep, 2019
Printing technology is using different types of inks on target surfaces by mechanical, hydrodynamic, or electromechanical forces.We are into research and development of production technologies and are trying to design printing NFC antenna through different printers. Can you please help us in understand the different types of materials that can be used for this. Also, can you please elaborate the scope of each segment considered in this report?.
Maxim
May, 2016
I am interested in buying this report if it covers data around debt research. Could you please share a sample for this.
girish
Jan, 2015
Could you elaborate on scope of each segment considered in this report.
User
Sep, 2019
Printed electronics make use of metal-based inks to manufacture electronic components. Conductive inks, especially silver conductive inks, have been widely used so far. I am trying to understand the different substrates and inks used in the printed electronics market. Does your report cover this specific interest of mine?.
Yumna
Oct, 2015
We are into research and development of production technologies and are trying to design printing NFC antenna through different printers. Can you please help us in understanding different types of materials that can be used for this..
Chen
May, 2019
We are exploring new start up ideas and are keen to understand printed electronics market..
User
Sep, 2019
Presently, the printed electronics market is experiencing growth at a greater pace since several innovations related to sensors, ICs, batteries, displays, printing technologies, and printing materials are taking place. We are trying to analyze investment and growth opportunities in the printed electronics market, and hence are looking for a complete market forecast and overview of the printed electronics market..
Dr.
Apr, 2021
I am interested in failure rate cause in ink printing and screen printing. I believe direct electroplating of micro/nano features is more dependable. .
Zachary
Dec, 2019
I am trying to understand the different substrate and Inks used in printed electronics market. Does your covers this specific interest of mine..
User
Sep, 2019
Printed electronic devices are increasingly used across verticals such as automotive and transportation, medical, and consumer electronics. Factors such as increasing demand for thin and flexible form factors, especially for the displays of consumer electronic devices can be responsible for this growth. What is the adoption rate of printed electronics in different industries?.
User
May, 2019
There have been various recent developments pertaining to the printed electronics market. Several companies have taken a keen interest in using printed electronics products. We are exploring new start up ideas and are keen to understand the printed electronics market. We would like to know the market overview for the global printed electronics market pertaining to end users, suppliers, and competitors in the market..