
AI in Social Media Market

AI in Social Media Market by Product Type (Social Media Management (Social Media Listening), Content Generation Type (Text, Video, Image, & Content Idea), Influencer Marketing, Reporting & Analytics, Content Strategy), End User - Global Forecast to 2029


OVERVIEW
Source: Secondary Research, Interviews with Experts, MarketsandMarkets Analysis
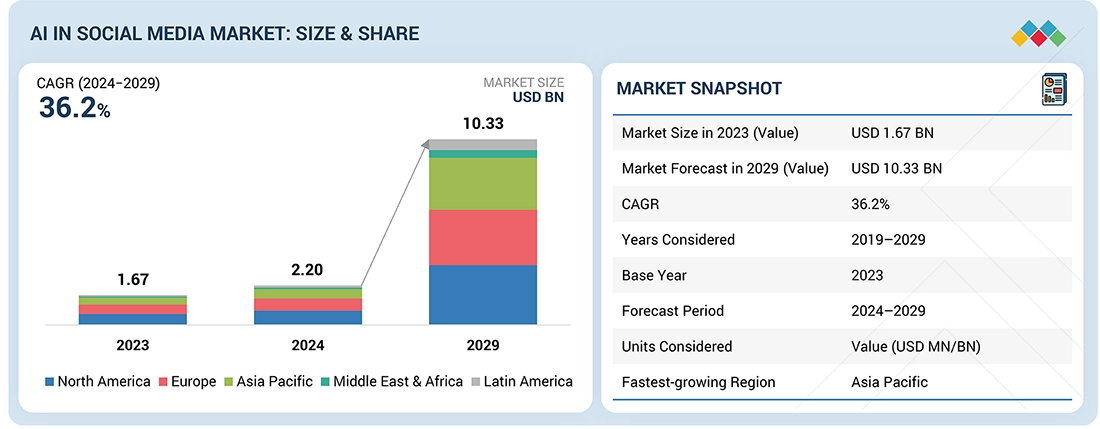
The global AI in social media market size is projected to grow from USD 2.20 billion in 2024 to USD 10.33 billion in 2029, at a CAGR of 36.2%. The growth of the AI in social media market is significantly driven by social media management tools that enhance account management, automate content sharing, and improve user engagement through data analysis and trend identification. These AI-powered solutions optimize scheduling, personalize interactions, and increase marketing efficiency, resulting in accelerated revenue growth and reduced customer conversion and retention costs for businesses. Notably, platforms like Facebook and its subsidiary Instagram leverage advanced machine learning techniques for targeted advertising and content analysis, which streamline operations and elevate customer experiences, ultimately fostering sustainable growth in the digital landscape.
KEY TAKEAWAYS
- By region, North America is estimated to hold largest market share of 36.12% in 2024
- By product type, the social media management segment is projected to account for the largest share during the forecast period.
- Under the product type segment, the social media management segment is projected to account for the largest share, with a CAGR of 32.7% during the forecast period.
- By use case, the marketing segment is estimated to hold the largest market share in 2024.
- By end-user, the healthcare & pharma segment is estimated to grow at highest CAGR of 42.3% during the forecase period.
- Leading players in the AI social media market, such as Google, Meta, IBM, Sprout, and Sprinklr, are strategically utilizing both organic and inorganic methods, including partnerships and investments, to secure a competitive edge.
- Companies like Buffer, Upfluence, and Dash Hudson, among others, have distinguished themselves among startups and SMEs by securing strong footholds in specialized niche areas, underscoring their potential as emerging market leaders.
The AI in social media market is growing steadily with the introduction of AI-powered deepfake detection in social media to identify and flag altered content. The rising demand for highly personalized content and recommendations tailored to individual user preferences and behavior is shaping the social media market.
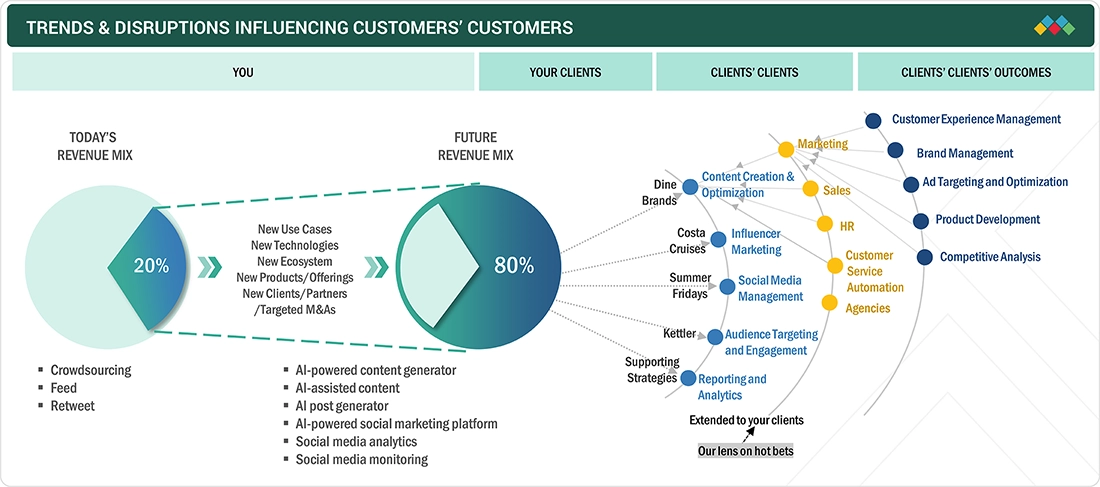
TRENDS & DISRUPTIONS IMPACTING CUSTOMERS' CUSTOMERS
The impact on consumers' businesses is a result of customer trends or disruptions. It shows how a company's revenue mix is expected to change over the next 4-5 years, shifting from its current offerings to new use cases, technologies, and markets.
Source: Secondary Research, Interviews with Experts, MarketsandMarkets Analysis
MARKET DYNAMICS
Level
-
Rising demand for personalization at scale

-
Growth in Gen AI-based content creation tools enables brands to create captivating and unique content.

Level
-
High integration complexity

Level
-
New monetization models

-
AI-driven social media assistants to optimize account management, content sharing, and user engagement for businesses

Level
-
Balancing creativity with compliance

-
Limited creativity and personalization

Source: Secondary Research, Interviews with Experts, MarketsandMarkets Analysis
Driver: Rising demand for personalization at scale
In today's environment, audiences demand personalized, contextually relevant experiences across all social touchpoints. For media organizations, this necessity translates into the delivery of content that adapts dynamically to individual preferences in real time. For brands and agencies, it manifests as the creation of highly targeted campaigns that yield measurable impacts. Artificial intelligence plays a crucial role in facilitating this transformation by integrating predictive analytics, behavioral insights, and creative automation. Buyers increasingly perceive personalization not merely as an advantage but as an essential strategy for maintaining engagement and fostering loyalty within a competitive marketplace.
Restraint: High integration complexity
While AI holds great potential for transformation, its integration into existing marketing infrastructures, legacy media systems, and a variety of social platforms presents significant challenges. Enterprises must navigate the complexities of aligning new AI functionalities with fragmented workflows, data silos, and compliance mandates. The substantial costs associated with customization and ensuring system interoperability further inhibit rapid adoption. For many organizations, the primary challenge lies not in demonstrating the value of AI, but in achieving a seamless implementation that minimally disrupts ongoing operations.
Opportunity: New monetization models
Artificial Intelligence (AI) is paving the way for new revenue opportunities that extend beyond conventional advertising methods. By enhancing influencer matching, facilitating dynamic ad placements, and promoting creator-led commerce, businesses can access previously untapped monetization channels. For entertainment companies, AI-curated fan experiences can significantly boost subscriptions and enhance premium engagement. Advertising agencies can leverage AI for campaign optimization, demonstrating return on investment (ROI) to clients with greater accuracy. Vendors that position AI as a strategic growth engine, rather than merely an efficiency tool, will align more closely with the evolving priorities of buyers.
Challenging: Balancing creativity with compliance
As artificial intelligence increasingly integrates into social media strategies, it is imperative for buyers to strike a balance between innovation and responsibility. Media organizations and agencies are eager to leverage AI for expedited content generation; however, they must remain compliant with stringent regulations surrounding copyright, deepfakes, and data privacy. Excessive or inappropriate use of AI could jeopardize brand reputation and undermine consumer trust. The critical challenge is to develop AI strategies that prioritize authenticity while simultaneously providing creative teams with the agility and scalability necessary for success.
AI in Social Media Market: COMMERCIAL USE CASES ACROSS INDUSTRIES
| COMPANY | USE CASE DESCRIPTION | BENEFITS |
|---|---|---|
 |
Dine Brands struggled to manage social media interactions due to a lack of integration, leading to a high manual workload and slow response times via native platforms. This disconnection made it difficult to accurately measure and prioritize social care, creating a clear need for an efficient and accountable system. | Emplifi delivered a unified workflow by integrating social media DMs into the existing CRM, which reduced case-handling time from five minutes to just one. This allowed for quicker responses, accurate tracking and prioritization of social care efforts, and the capture of valuable, restaurant-specific guest data. |
 |
Supporting Strategies faced challenges managing social media across 179 channels and 90 locations, resulting in workflow complexity and inconsistent messaging. It urgently required a centralized system to streamline content, boost productivity, and ensure compliance. | Lately's Parent Dashboard unified content distribution across all 179 channels, drastically streamlining the workflow and saving the Marketing Director time. This system provided full visibility, empowered local teams, and doubled the company's web traffic within one year. |
 |
Costa Cruises encountered difficulties in managing a large volume of incoming social media messages due to their outdated software, which did not integrate with their CRM or WhatsApp. This absence of a unified system made it challenging to deliver efficient and personalized customer service. | Sprinklr enabled Costa Cruises to respond 25% faster with the same lean team managing a higher volume of inquiries. The platform unified channels for a comprehensive customer view, providing real-time insights that enhanced service efficiency and led to higher customer satisfaction and loyalty scores. |
 |
Summer Fridays needed to create authentic, engaging content in a highly competitive beauty market, balancing polished campaign imagery with relatable UGC. The core challenge was maintaining a consistent voice and staying ahead of trends to effectively strengthen its community connection. | Dash Hudson's AI tool significantly increased engagement by helping Summer Fridays focus on user-generated content. The platform provided real-time insights into community sentiment and visual trends, strengthening the brand's connection with its audience and driving data-informed marketing decisions. |
Logos and trademarks shown above are the property of their respective owners. Their use here is for informational and illustrative purposes only.
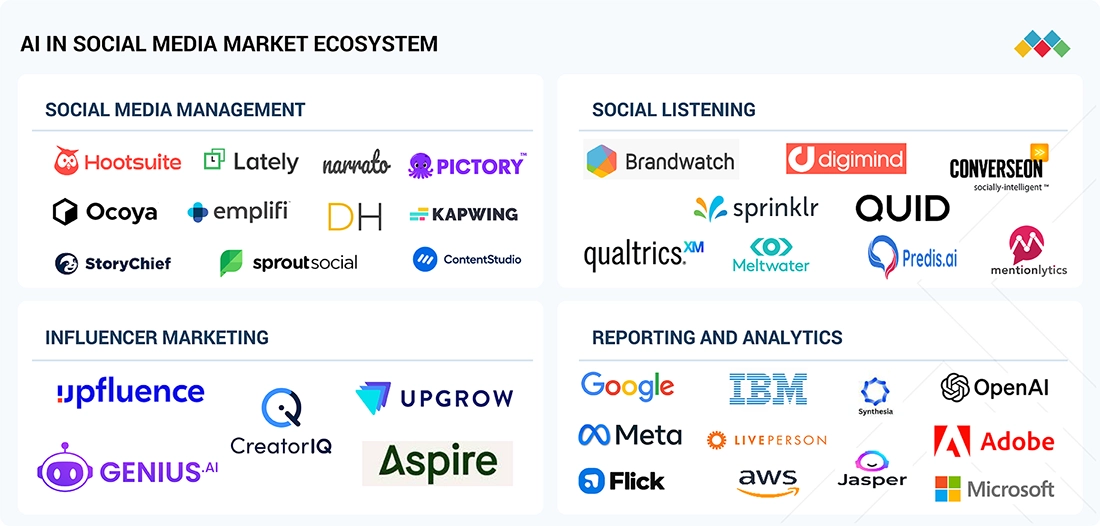
MARKET ECOSYSTEM
The AI in social media ecosystem has four main segments: social media management for content scheduling and campaign optimization; influencer marketing for AI-driven creator matching and impact measurement; reporting and analytics for real-time insights and sentiment tracking; and social listening for monitoring brand reputation and audience sentiment. Together, these segments form an integrated network that enhances personalization, engagement, and enterprise adoption of AI in social media.
Logos and trademarks shown above are the property of their respective owners. Their use here is for informational and illustrative purposes only.
MARKET SEGMENTS
Source: Secondary Research, Interviews with Experts, MarketsandMarkets Analysis
AI in Social Media Market, by Product Type
Social media management is estimated to account for the largest market share in the AI in Social Media market as platforms and businesses increasingly rely on AI for content scheduling, performance tracking, and campaign optimization. AI-powered tools enable real-time monitoring, sentiment analysis, and automated customer engagement at scale. The rising demand for personalized content delivery and efficient audience targeting further drives adoption. These factors position social media management as the leading product type in the market.
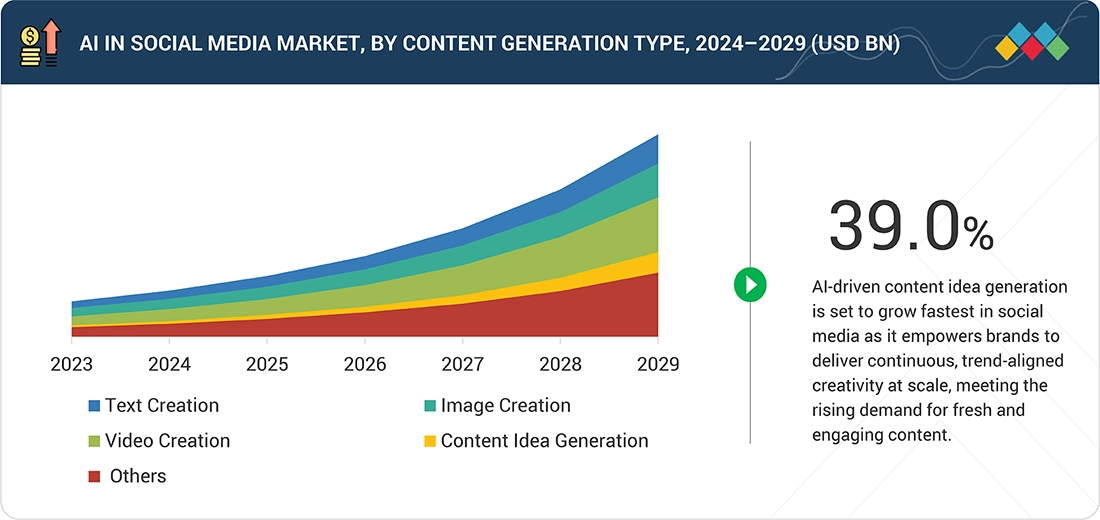
AI in Social Media Market, by Content Generation Type
Text creation is projected to account for the largest share in AI-driven content generation, as brands and platforms increasingly use generative AI to produce personalized posts, ad copy, and real-time responses. AI models enable large-scale, cost-efficient content creation while maintaining relevance and consistency across multiple channels. The rising need for rapid campaign execution and audience-specific messaging further fuels adoption, making text creation the dominant segment in AI content generation.
AI in Social Media Market, by Use Case
Marketing is estimated to capture the largest share among AI in social media use cases, as businesses increasingly leverage AI for ad targeting, customer segmentation, and campaign optimization. AI enables hyper-personalized recommendations, predictive analytics, and performance tracking to maximize RoI. With growing adoption of generative AI for creative content and automated ad placements, marketing remains the dominant driver of value in the AI in social media market.
AI in Social Media Market, by End User
Enterprises represent the largest end-user segment in the AI in social media market, with PR agencies leading adoption. PR firms increasingly rely on AI for sentiment analysis, brand monitoring, crisis management, and automated content generation. AI tools help agencies deliver real-time insights, streamline communication strategies, and enhance audience engagement at scale. This strong dependence positions enterprises, especially PR agencies, as the dominant end-user group in the market.
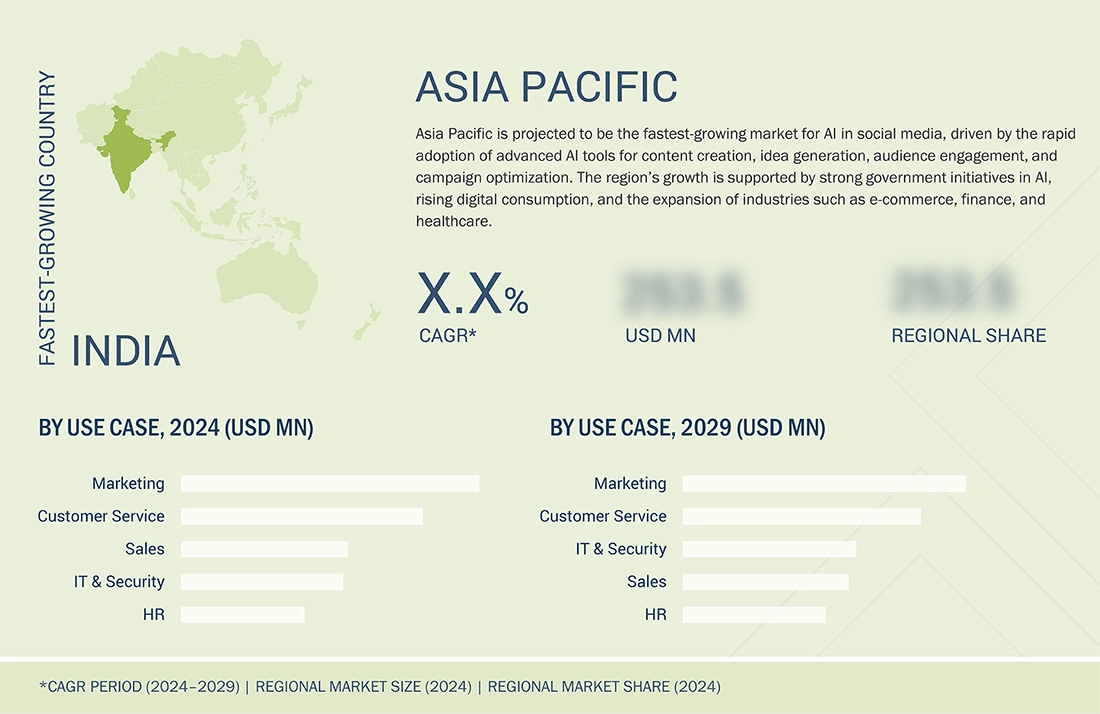
REGION
Asia Pacific to be the fastest-growing region in the global AI in social media market during the forecast period
Asia Pacific is emerging as the fastest-growing region in the AI in social media market, driven by the rapid adoption of generative AI, advanced content moderation tools, and real-time engagement analytics. Governments and enterprises across China, India, Japan, and South Korea are heavily investing in AI ecosystems, enabling large-scale integration of conversational AI, recommendation engines, and influencer marketing automation on social platforms. Strong collaboration between global tech leaders and regional innovators further accelerates innovation, positioning Asia Pacific as the most dynamic growth hub for AI in social media.
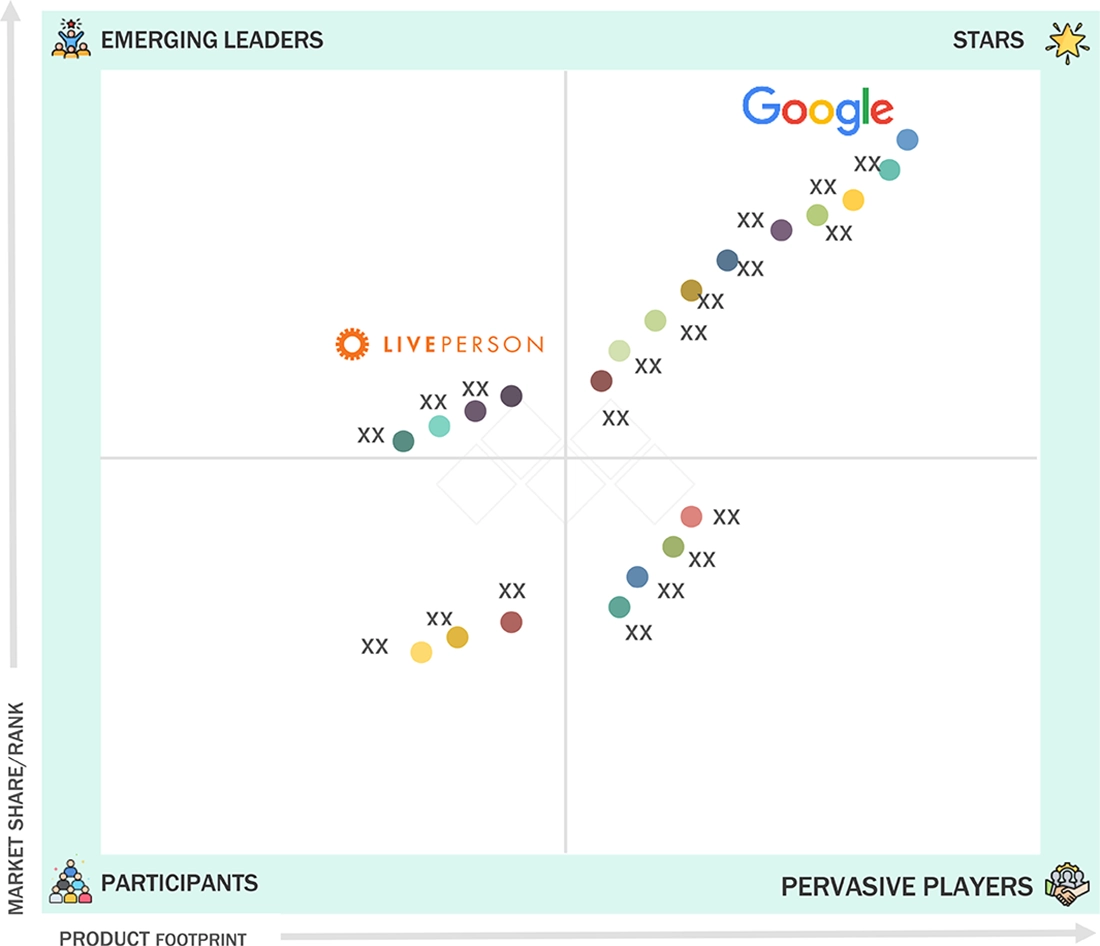
AI in Social Media Market: COMPANY EVALUATION MATRIX
In the AI in social media market matrix, Google (Star) leads with Google AI, DeepMind, Bard, and other advanced solutions, offering comprehensive tools for content personalization, ad optimization, and engagement analytics. Its scalable infrastructure and integrated generative AI capabilities reinforce its leadership. LivePerson (Emerging Leader) is advancing with AI-driven social engagement platforms focused on customer interaction, conversational AI, and lifecycle management.
Source: Secondary Research, Interviews with Experts, MarketsandMarkets Analysis
KEY MARKET PLAYERS
MARKET SCOPE
| REPORT METRIC | DETAILS |
|---|---|
| Market Size in 2023 (Value) | USD 1.67 BN |
| Market Forecast in 2029 (Value) | USD 10.33 BN |
| Growth Rate | 36.20% |
| Years Considered | 2019–2029 |
| Base Year | 2023 |
| Forecast Period | 2024–2029 |
| Units Considered | Value (USD MN/BN) |
| Report Coverage | Revenue forecast, company ranking, competitive landscape, growth factors, and trends |
| Segments Covered |
|
| Regions Covered | North America, Asia Pacific, Europe, Middle East & Africa, Latin America |
WHAT IS IN IT FOR YOU: AI in Social Media Market REPORT CONTENT GUIDE
DELIVERED CUSTOMIZATIONS
We have successfully delivered the following deep-dive customizations:
| CLIENT REQUEST | CUSTOMIZATION DELIVERED | VALUE ADDS |
|---|---|---|
| Leading AI in Social Media Vendor |
|
|
| Leading AI in Social Media Vendor |
|
|
RECENT DEVELOPMENTS
- August 2024 : Wix and Google expanded their strategic partnership to integrate Google's AI tool, Gemini, into Wix's website-building platform. This collaboration will allow Wix users to leverage Gemini's advanced AI capabilities to enhance website design and functionality within the Google Workspace environment. The integration aims to streamline the user experience by providing intelligent, AI-driven tools that simplify content creation, design, and management. This partnership enhances Wix's offerings, giving users access to cutting-edge technology and tools to improve their online presence and streamline workflow.
- May 2024 : IBM announced expanding its partnership with Salesforce to enhance the capabilities of its Watsonx platform, integrating it with Salesforce's Einstein 1. This aimed to provide businesses greater flexibility in AI and data deployment, enabling data-driven decision-making directly within workflows. Key features include bidirectional data integration, customizable large language models (LLMs), and prebuilt actions for CRM solutions. IBM's strategic focus on responsible AI development is central to this initiative. It aligned with its broader goal of promoting generative AI adoption across various sectors through partnerships with companies like Tech Mahindra and Wipro.
- June 2024 : Sprinklr and Reddit expanded their strategic partnership to enhance connections between enterprises and Reddit users. As the first official partner of Reddit's newly launched Ads API, Sprinklr would integrate Reddit's Data API and Advertising API into its platform. This allowed Sprinklr customers to access real-time conversations on Reddit, improving social listening and brand engagement. By leveraging Reddit's unique community-driven insights, Sprinklr aimed to help brands optimize their advertising strategies and enhance customer understanding. This partnership positions Sprinklr as a key player in managing brand presence on Reddit, offering a unified approach to organic and paid content strategies.
- June 2024 : HID announced a collaboration with AWS to integrate its U.ARE.UTM Camera Identification System with Amazon Rekognition for superior identity verification results. HID's technology captures faces across varying conditions and offers built-in liveness detection, making it suitable for self-serve and POS environments in industries like hospitality, healthcare, retail, and banking. This leverages Amazon Rekognition's face detection, comparison, indexing, and search capabilities to enable customers to achieve superior results in challenging environments while providing a seamless customer experience without compromising accuracy and security.
- March 2024 : LivePerson partnered with Infinity, a call analytics platform, to help brands create better personalized digital experiences through customer data and conversational intelligence. The partnership enabled enhanced personalization efforts and measurable ROI by connecting attribution data across voice calls and digital messaging conversations. It provided bidirectional attribution, including AI and automation-handled conversations, to understand the end-to-end, omnichannel customer journey. The integration strengthened visibility into online-to-offline customer service interactions, optimized marketing spend, and improved sales and service outcomes through a more personalized customer experience.
Table of Contents
 Exclusive indicates content/data unique to MarketsandMarkets and not available with any competitors.
Methodology
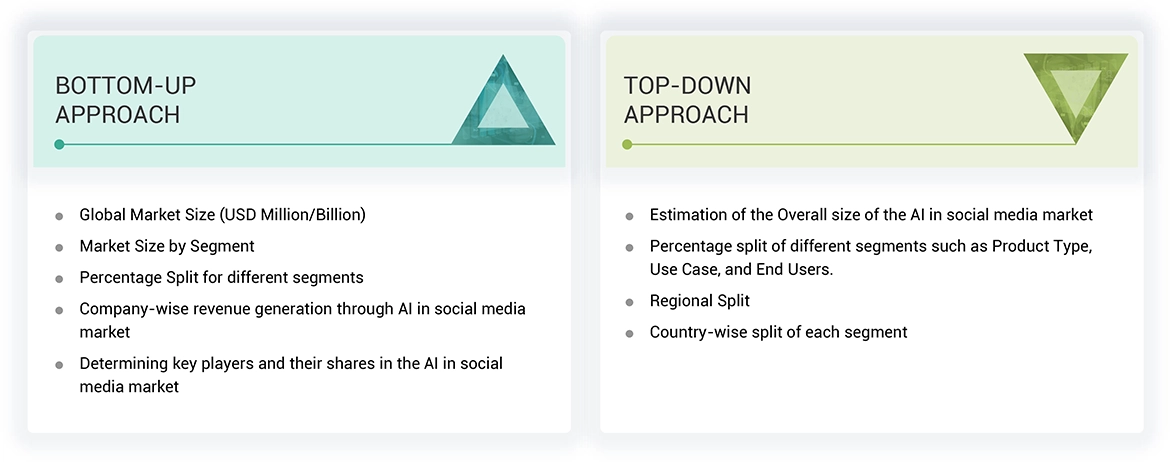
The study involved major activities in estimating the current market size for the AI in social media market. Exhaustive secondary research was done to collect information on the AI in social media market. The next step was to validate these findings, assumptions, and sizing with industry experts across the value chain using primary research. Different approaches, such as top-down and bottom-up, were employed to estimate the total market size. After that, the market breakup and data triangulation procedures were used to estimate the market size of the segments and subsegments of the AI in social media market.
Secondary Research
The market for the companies offering AI in social media solutions is arrived at by secondary data available through paid and unpaid sources, analyzing the product portfolios of the major companies in the ecosystem, and rating the companies by their performance and quality. Various sources were referred to in the secondary research process to identify and collect information for this study. The secondary sources include annual reports, press releases, investor presentations of companies, white papers, journals, certified publications, and articles from recognized authors, directories, and databases.
In the secondary research process, various secondary sources were referred to for identifying and collecting information related to the study. Secondary sources included annual reports, press releases, and investor presentations of AI in social media vendors, forums, certified publications, and whitepapers. The secondary research was used to obtain critical information on the industry’s value chain, the total pool of key players, market classification, and segmentation from the market and technology-oriented perspectives
Primary Research
In the primary research process, various primary sources from both the supply and demand sides were interviewed to obtain qualitative and quantitative information for this report. The primary sources from the supply side included industry experts, such as Chief Executive Officers (CEOs), Vice Presidents (VPs), marketing directors, technology and innovation directors, and related key executives from various key companies and organizations operating in the AI in social media market. After the complete market engineering (calculations for market statistics, market breakdown, market size estimations, market forecasting, and data triangulation), extensive primary research was conducted to gather information and verify and validate the critical numbers arrived at. Primary research was also conducted to identify the segmentation types, industry trends, competitive landscape of AI in social media solutions offered by various market players, and key market dynamics, such as drivers, restraints, opportunities, challenges, industry trends, and key player strategies. In the complete market engineering process, the top-down and bottom-up approaches were extensively used, along with several data triangulation methods, to perform the market estimation and market forecasting for the overall market segments and subsegments listed in this report. Extensive qualitative and quantitative analysis was performed on the complete market engineering process to list the key information/insights throughout the report.

Note: Tier 1 companies account for annual revenue of >USD 10 billion; tier 2 companies’ revenue ranges between USD 1 and 10 billion; and tier 3 companies’ revenue ranges between USD 500 million–USD 1 billion
To know about the assumptions considered for the study, download the pdf brochure
Market Size Estimation
Both top-down and bottom-up approaches were used to estimate and validate the total size of the cell culture market. These methods were also used extensively to estimate the size of various subsegments in the market. The research methodology used to estimate the market size includes the following:
AI in Social Media Market : Top-Down and Bottom-Up Approach
Data Triangulation
After arriving at the overall market size using the market size estimation processes explained above, the market was split into several segments and subsegments. The data triangulation and market breakup procedures were employed, wherever applicable, to complete the overall market engineering process and arrive at the exact statistics of each market segment and subsegment. The data was triangulated by studying various factors and trends from both the demand and supply sides.
Market Definition
AI in social media is a tool designed to upgrade and streamline social media content and target audiences. These tools utilize advanced ML algorithms to automate key processes such as content generation, audience sentiments & engagement, and social media data analysis at lower time periods and effort required by social media teams. With capabilities such as sentiment analysis, predictive analytics, personalized content recommendations, and automated response systems, these social media AI tools support brands in maintaining a dynamic presence on various social media platforms, ensuring they stay pertinent in a rapidly developing digital landscape.
Stakeholders
- Risk Assessment and software developers
- AI in social media software vendors
- Social Media Managers
- AI in Social Media Service Providers
- Marketers
- Business owners
- Distributors and Value-added Resellers (VARs)
- Independent Software Vendors (ISV)
- Managed service providers
- Support & maintenance service providers
- System Integrators (SIs)/migration service providers
- OEMs
- Technology providers
Report Objectives
- To define, describe, and predict the AI in social media market by product (by type and deployment mode), use cases, end users, and region
- To provide detailed information related to major factors (drivers, restraints, opportunities, and industry-specific challenges) influencing the market growth
- To analyze the micro markets with respect to individual growth trends, prospects, and their contributions to the total market
- To analyze the opportunities in the market for stakeholders by identifying the high-growth segments of the AI in social media market
- To analyze opportunities in the market and provide details of the competitive landscape for stakeholders and market leaders
- To forecast the market size of five main regions: North America, Europe, Asia Pacific, the Middle East & Africa, and Latin America
- To profile key players and comprehensively analyze their market rankings and core competencies
- To analyze competitive developments, such as partnerships, new product launches, and mergers & acquisitions, in the AI in social media market
- To analyze the impact of the recession across all regions in the AI in social media market
Available Customizations
With the given market data, MarketsandMarkets offers customizations as per your company’s specific needs. The following customization options are available for the report:
Product analysis
- Product quadrant, which gives a detailed comparison of the product portfolio of each company.
Geographic analysis
- Further breakup of the North American AI in social media market
- Further breakup of the European AI in social media market
- Further breakup of the Asia Pacific AI in social media market
- Further breakup of the Middle Eastern & African AI in social media market
- Further breakup of the Latin America AI in social media market
Company information
- Detailed analysis and profiling of additional market players (up to five)
Key Questions Addressed by the Report
Need a Tailored Report?
Customize this report to your needs
Get 10% FREE Customization
Customize This ReportPersonalize This Research
- Triangulate with your Own Data
- Get Data as per your Format and Definition
- Gain a Deeper Dive on a Specific Application, Geography, Customer or Competitor
- Any level of Personalization
Let Us Help You
- What are the Known and Unknown Adjacencies Impacting the AI in Social Media Market
- What will your New Revenue Sources be?
- Who will be your Top Customer; what will make them switch?
- Defend your Market Share or Win Competitors
- Get a Scorecard for Target Partners

Custom Market Research Services
We Will Customise The Research For You, In Case The Report Listed Above Does Not Meet With Your Requirements
Get 10% Free CustomisationTESTIMONIALS

Still Researching the
AI in Social Media Ecosystem?
See the competitors, opportunity evaluation, and growth signals shaping it - Instantly!
Generate 15+ consulting-grade strategic intelligence outputs - from competitor analysis to board-ready strategy decks, tailored to your AI in Social Media growth question.


Growth opportunities and latent adjacency in AI in Social Media Market