
Diagnostic Imaging Market Size, Growth, Share & Trends Analysis

Diagnostic Imaging Market by Modality (MRI (Very High (7T+), High (3T+), Low (<3T)), Ultrasound (3D/4D, Doppler, Contrast), CT, X-Ray (Digital, Portable), Mammography, SPECT, PET)), Application (OB/Gyn, CVD, Onco, Neuro) & End User-Global Forecast to 2030


OVERVIEW
Source: Secondary Research, Interviews with Experts, MarketsandMarkets Analysis
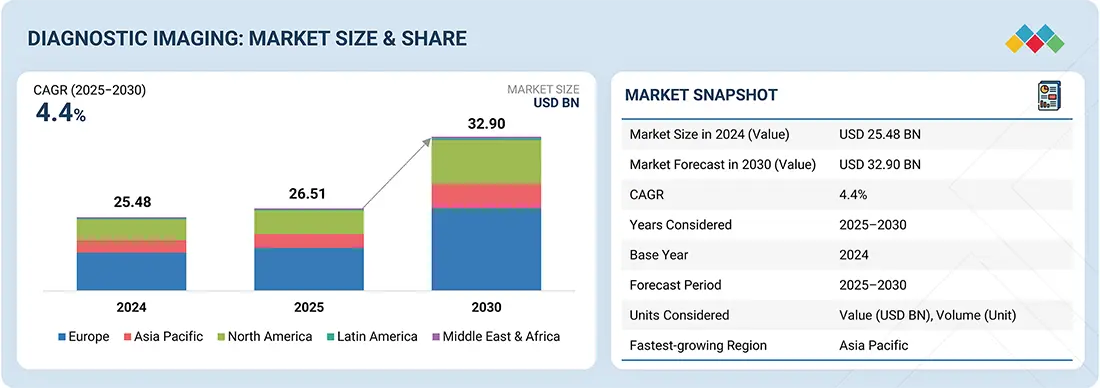
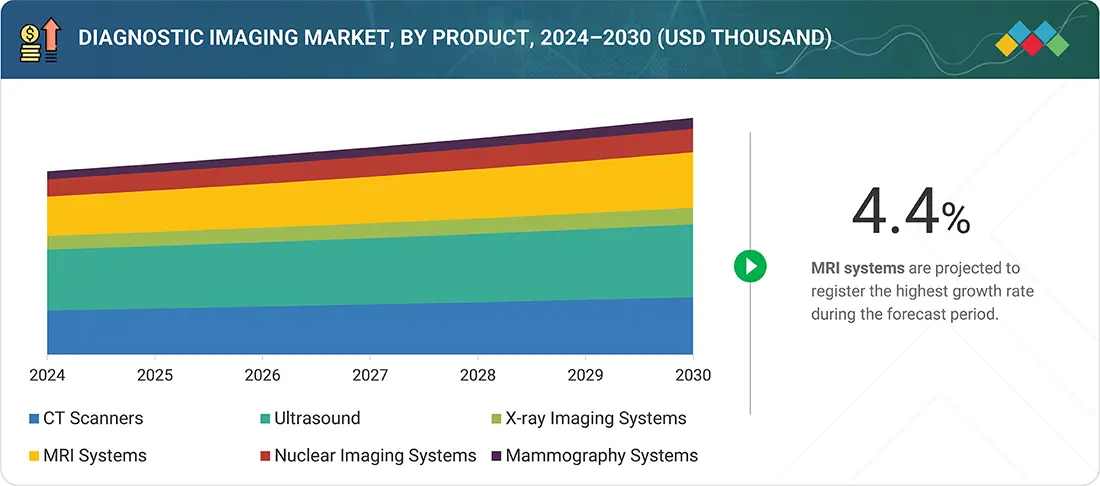
The global diagnostic imaging market is projected to reach USD 32.90 billion by 2030 from USD 26.51 billion in 2025, at a CAGR of 4.4% from 2025 to 2030. The diagnostic imaging market has evolved into one of the most essential segments of modern healthcare, serving as the foundation for early disease detection, treatment planning, and monitoring of therapeutic outcomes across multiple disease areas. Modalities such as X-ray, CT, MRI, ultrasound, PET, and hybrid technologies continue to witness strong demand, driven by rising chronic disease incidence, the global aging population, and the expansion of national screening programs. The market is also being reshaped by digital transformation, where the integration of artificial intelligence, machine learning, and cloud platforms is converting diagnostic imaging from a visualization tool into a critical decision-support enabler. As health systems move toward value-based care and precision medicine, advanced imaging solutions that improve accuracy, reduce misdiagnosis, and enhance throughput are gaining prominence. Growth is further supported by hospital expansions, public–private partnerships, and widening access in emerging economies, making diagnostic imaging a central pillar in healthcare delivery worldwide.
KEY TAKEAWAYS
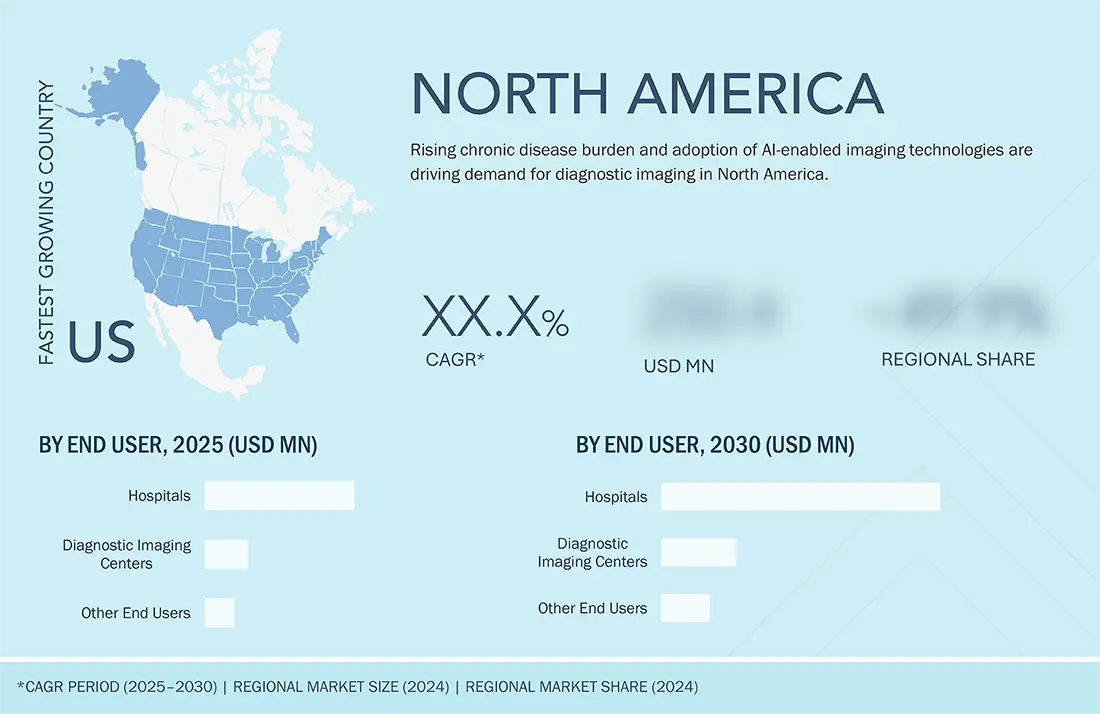
- The North America diagnostic imaging market accounted for a 37.9% revenue share in 2024.
- By modality, the MRI systems segment is expected to register the highest CAGR of 6.4%.
- By application, the cardiology segment in CT scanners is projected to grow at the fastest rate of 4.7% from 2025 to 2030.
- By end-user, the hospitals segment is expected to dominate the market with 66.9% revenue share in 2024.
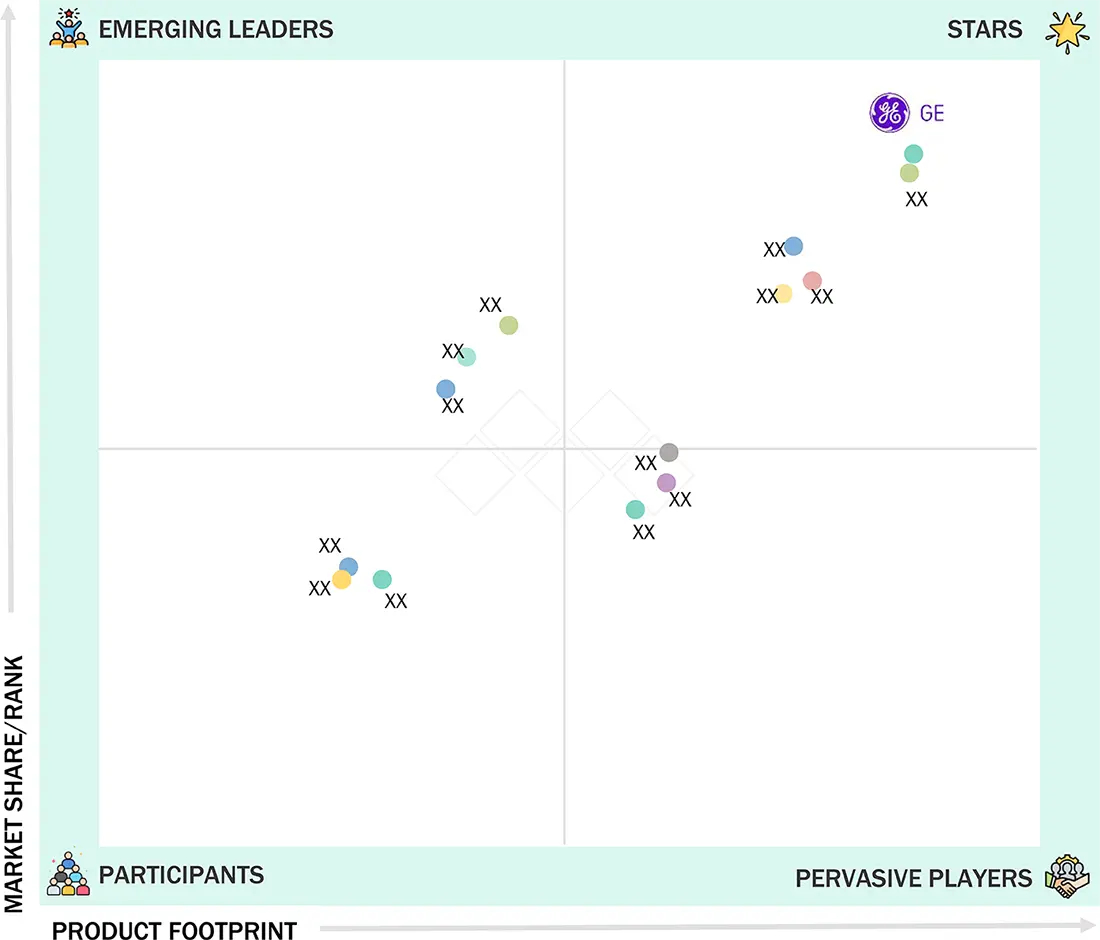
- Company GE Healthcare (US), Siemens Healthineers (Germany), Philips Healthcare (Netherlands), FUJIFILM Corporation (Japan), Canon Medical Systems (Japan), Mindray (China), Esaote SpA (US), Samsung Electronics Co., Ltd. (South Korea), Shimadzu Medical Systems (US), Carestream Health (US), Planmed Oy (Finland), Hologic, Inc. (US), Agfa-Gevaert Group (Belgium), CurveBeam LLC (US), and SternMed GmbH (Germany) were identified as some of the star players in the diagnostic imaging market (global), given their strong market share and product footprint.
- Companies Allengers Medical Systems Ltd.(India), Analogic Corporation(US), Aspect Imaging Ltd.(US), Beijing Wandong Medical Technology Co., Ltd.(China), Konica Minolta, Inc.(Japan), Clarius(Canada) among others, have distinguished themselves among startups and SMEs by securing strong footholds in specialized niche areas, underscoring their potential as emerging market leaders
A defining trend in diagnostic imaging is the growing digitalization of workflows, with AI-powered image analysis tools significantly reducing interpretation times while enhancing radiologist accuracy in identifying subtle abnormalities. Cloud-based enterprise imaging and picture archiving solutions are enabling seamless integration across health systems, while miniaturization of devices is fueling the adoption of portable and handheld systems, particularly in ultrasound and X-ray. Hybrid modalities such as PET/CT and PET/MRI are gaining popularity in oncology and neurology, while innovations such as spectral CT and 3D ultrasound are advancing precision diagnostics. Furthermore, there is a gradual shift toward subscription-based and imaging-as-a-service models that provide cost flexibility and enable healthcare providers to access cutting-edge technologies without the burden of large capital investments.
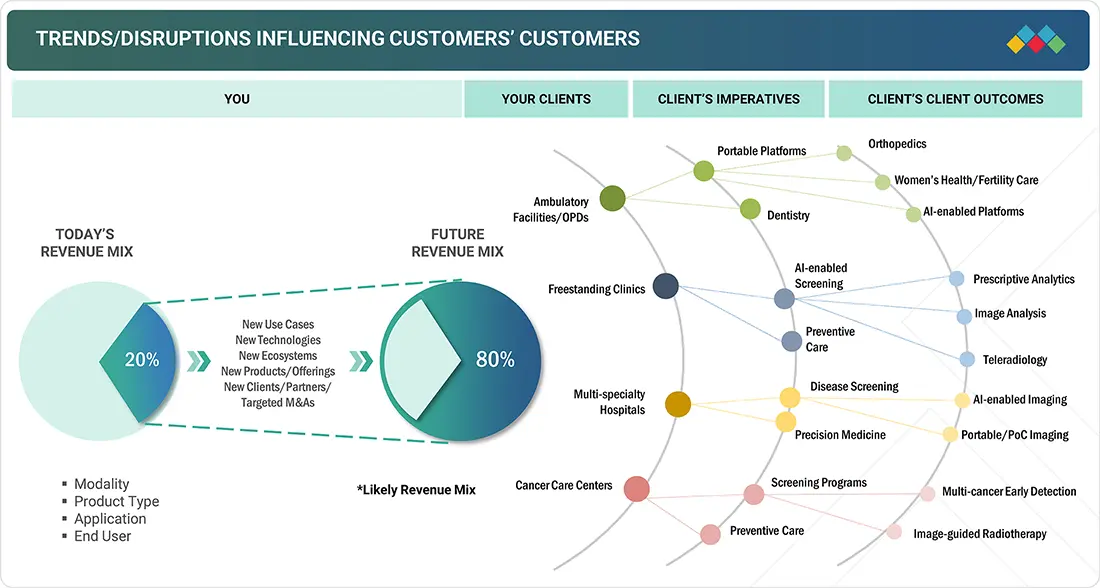
TRENDS & DISRUPTIONS IMPACTING CUSTOMERS' CUSTOMERS
Healthcare providers are increasingly grappling with the dual challenge of adopting advanced imaging systems while managing financial and operational constraints. The integration of AI into imaging workflows is transforming radiology practices, altering staffing requirements, and compelling radiologists to adapt to machine-augmented diagnostics. Simultaneously, reimbursement hurdles and regulatory delays for AI algorithms are slowing down widespread adoption, creating uncertainty for customers. The digital connectivity of imaging systems is also amplifying cybersecurity risks, requiring stronger data protection strategies. Moreover, the ongoing migration from on-premises PACS to enterprise cloud-based platforms is shifting customer priorities from pure hardware performance to integrated solutions that combine imaging devices, software, analytics, and long-term service commitments.
Source: Secondary Research, Interviews with Experts, MarketsandMarkets Analysis
MARKET DYNAMICS
Level
-
Rising prevalence of chronic diseases and growing number of national screening programs

Level
-
Premium pricing and high TCO expenditure

Level
-
Growth opportunities in emerging countries

Level
-
Shortage of trained professionals

Source: Secondary Research, Interviews with Experts, MarketsandMarkets Analysis
Driver: Rising prevalence of chronic diseases and growing number of national screening programs
Growth in the diagnostic imaging market is primarily driven by the rising prevalence of chronic and lifestyle-related diseases, the global focus on minimally invasive diagnostics, and the increasing demand for personalized and precision medicine. Advancements in imaging technologies, particularly AI integration, 3D and 4D imaging, and hybrid modalities, are fueling clinical adoption. Expanding healthcare infrastructure in emerging economies, coupled with government funding and initiatives to improve access to imaging, further accelerates market growth and strengthens the role of imaging in healthcare ecosystems.
Restraint: Premium pricing and high TCO expenditure
Despite these advancements, the market faces notable restraints, including the high capital and maintenance costs associated with advanced imaging systems, which limit adoption in resource-constrained settings. A global shortage of radiologists and trained imaging professionals is creating bottlenecks in service delivery. Regulatory complexities, particularly in approving AI-based diagnostic solutions, are delaying market uptake. Reimbursement variability across regions adds another layer of challenge, while growing concerns around data privacy and cybersecurity pose significant barriers in an era of increasing digital integration. Additionally, the demand for cost-effective medical imaging equipment is increasing the popularity of refurbished medical devices, which further restricts market expansion in the forecast period. Continuous reductions in reimbursements for diagnostic imaging scans, coupled with the rising costs of advanced diagnostic imaging systems, are preventing medium-sized and small healthcare facilities from investing in the latest imaging technologies.
Opportunity: Growth opportunities in emerging countries
Opportunities in diagnostic imaging are vast and expanding, particularly with the integration of AI-driven decision-support systems into daily imaging workflows, which promise to improve diagnostic accuracy and efficiency. The rapid growth of portable and point-of-care imaging devices is enabling access in rural, emergency, and outpatient settings. Innovative business models such as imaging-as-a-service and subscription-based leasing are lowering barriers for adoption among smaller hospitals and diagnostic centers. Molecular imaging, particularly in oncology and neurology, is opening new diagnostic frontiers, while partnerships with IT and cloud providers are enhancing the development of enterprise imaging platforms capable of handling large data volumes with improved interoperability. Additionally, the growth in emerging economies is supported by favorable government and private policies aimed at enhancing access to diagnostic imaging, including the availability of reimbursement options.
Challenge: Shortage of trained professionals
Technical proficiency is vital for handling advanced diagnostic imaging systems, as poorly taken images can lead to inaccurate interpretations. There is a significant shortage of qualified sonographers in key markets like the US, UK, Canada, and Australia, with demand expected to rise by 10% between 2021 and 2031, per the US Bureau of Labor Statistics. By 2029, Canada’s bio-economy is projected to need 65,000 more skilled workers. Additionally, India has an average of four full-time researchers for every 10,000 people in its labor force, highlighting a global skills gap that could hinder market growth. High stress levels among radiographers—over 90% in Germany and more than 50% in the UK, France, and the US—contribute to attrition rates, with many experienced technicians leaving the field. The UK faces a 30% nationwide shortage of clinical radiologists, leading to outsourcing to meet an 8% rise in CT and MRI demand. The 2024 AAPPR Benchmarking Report states that nearly half of radiology job searches in 2023 remain unfilled. Moreover, the diagnostic imaging sector faces pressing challenges such as ensuring seamless interoperability across modalities, hospital information systems, and cloud networks, which is critical for data continuity. Managing the ever-increasing imaging data volumes and associated storage requirements is creating cost and infrastructure burdens. Low- and middle-income countries face unique obstacles, where cost pressures limit the adoption of advanced modalities. Clinician resistance to AI adoption, often driven by concerns about trust, liability, and workflow disruption, further slows integration. Rapid technology obsolescence, with new software and hardware iterations being released frequently, forces providers to make repeated investments, creating hesitancy in long-term procurement decisions.
diagnostic Imaging market: COMMERCIAL USE CASES ACROSS INDUSTRIES
| COMPANY | USE CASE DESCRIPTION | BENEFITS |
|---|---|---|
 |
Integrated hospital-based diagnostic imaging centers offering CT, MRI, PET/CT, X-ray, mammography, and advanced AI-assisted reporting across India | Strong referral network from Apollo’s multi-specialty hospitals |
|
|
Hub-and-spoke diagnostic imaging model with centers in hospitals and standalone clinics across India, GCC, and other regions | Efficient resource utilization through centralized radiology reporting |
 |
Outpatient diagnostic imaging centers specializing in MRI, CT, ultrasound, mammography, and pain management imaging services | Lower cost alternative to hospital-based imaging |
 |
Large-scale network of freestanding diagnostic imaging centers offering MRI, CT, PET/CT, mammography, ultrasound, and AI-powered analytics | Economies of scale leading to cost-efficient operations |
Logos and trademarks shown above are the property of their respective owners. Their use here is for informational and illustrative purposes only.
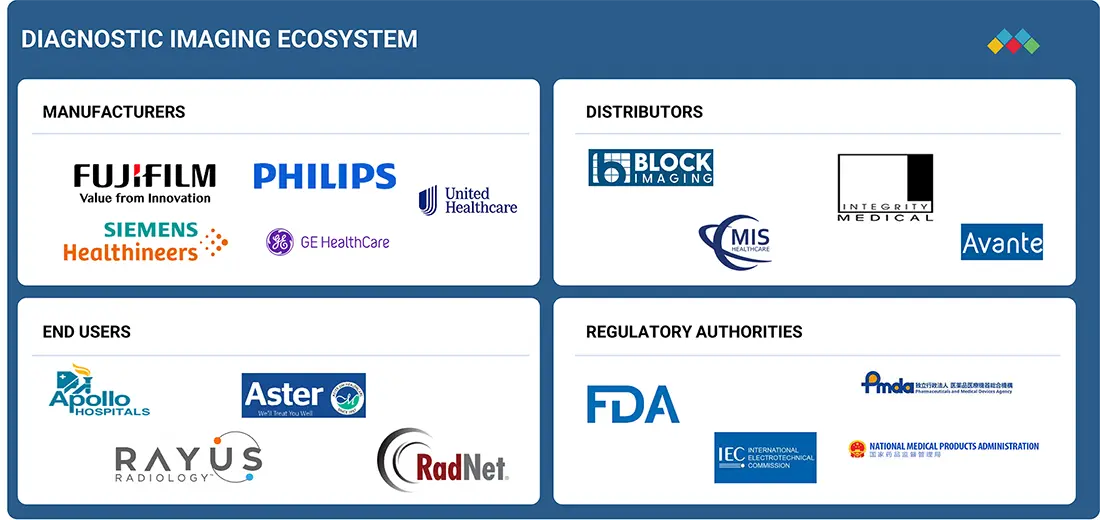
MARKET ECOSYSTEM
The diagnostic imaging ecosystem is highly dynamic, involving equipment manufacturers, AI and software innovators, contrast agent suppliers, IT and cloud vendors, distributors, and service providers. Large OEMs such as Siemens Healthineers, GE Healthcare, Philips, Canon Medical, and FUJIFILM dominate the equipment space, while specialized AI startups are carving niches in image analysis and workflow automation. PACS and RIS vendors form a critical IT layer that integrates imaging data into broader clinical workflows, and distributors play a vital role in expanding market penetration in emerging regions. Regulatory bodies, reimbursement authorities, and cybersecurity frameworks heavily influence technology adoption, underscoring the complex interplay of technology, regulation, and end-user needs in this market.
Logos and trademarks shown above are the property of their respective owners. Their use here is for informational and illustrative purposes only.
MARKET SEGMENTS
Source: Secondary Research, Interviews with Experts, MarketsandMarkets Analysis
Diagnostic Imaging Market, by Modality
Based on modality, the global diagnostic imaging market is segmented into CT scanners, X-ray imaging systems, ultrasound systems, MRI systems, nuclear imaging systems, and mammography systems. Within product categories, MRI is progressing toward higher field strengths and advanced functional capabilities, particularly for neurology and oncology. CT is evolving with dual-energy and spectral imaging, offering improved tissue characterization and reduced radiation exposure. Ultrasound is rapidly shifting toward portable and handheld solutions, driven by point-of-care demand, while X-ray systems are experiencing a full transition to digital radiography. Nuclear imaging is being revitalized through the integration of PET with MRI and CT, enhancing diagnostic accuracy in cancer and neurological disorders.
Diagnostic Imaging Market, by Application
The application landscape is diversifying rapidly, with oncology continuing to dominate adoption through molecular imaging and hybrid PET technologies for tumor detection and monitoring. Cardiology is emerging as a strong growth area, supported by advanced echocardiography and cardiac MRI for early risk assessment. Neurology benefits from PET imaging for dementia and Alzheimer’s disease detection. Orthopedics is leveraging CT and MRI to improve pre-surgical planning and implant design, while emergency medicine is increasingly relying on portable ultrasound and CT systems for immediate trauma assessment.
Diagnostic Imaging Market, by End User
Based on end users, the global diagnostic imaging market is segmented into hospitals, diagnostic imaging centers, and other end users. Hospitals remain the largest adopters of imaging technologies, prioritizing enterprise-level imaging platforms with AI integration for comprehensive care delivery. Diagnostic imaging centers focus heavily on throughput, cost efficiency, and service quality, often seeking mid-tier systems with balanced performance. Outpatient clinics and specialty centers are increasingly adopting portable imaging systems to expand their service offerings. Academic and research institutes continue to represent niche demand, with investments in high-end imaging technologies to support clinical trials and translational research.
REGION
North America is expected to be the largest market during the forecast period
Regional dynamics in diagnostic imaging are shaped by healthcare maturity and investment priorities. North America leads with strong reimbursement systems and advanced infrastructure, making it a hub for AI-enabled imaging innovation. Europe emphasizes enterprise imaging integration and compliance with strict data protection laws such as GDPR. The Asia Pacific is the fastest-growing region, fueled by rapid healthcare infrastructure development in China, India, and Southeast Asia. Latin America is witnessing steady growth supported by government initiatives, although adoption remains constrained by budgetary pressures. The Middle East & Africa are experiencing growth through private hospital investments and the expansion of medical tourism, which is driving demand for advanced imaging technologies.
diagnostic Imaging market: COMPANY EVALUATION MATRIX
The competitive landscape in diagnostic imaging is anchored by global leaders such as Siemens Healthineers, GE Healthcare, Philips, Canon Medical, and FUJIFILM, all of whom are investing heavily in AI integration, hybrid modalities, and enterprise imaging platforms. These players are shifting their positioning from pure hardware providers to end-to-end solution partners that combine imaging devices, software, analytics, and service offerings. At the same time, startups like Butterfly Network in handheld ultrasound and AI firms such as AIDOC and Zebra Medical Vision are introducing disruptive innovations. Strategic partnerships between imaging OEMs and cloud providers such as Microsoft, Google, and AWS are becoming increasingly influential, as competition now extends beyond hardware superiority to the ability to deliver integrated ecosystems of hardware, software, and long-term service models.
Source: Secondary Research, Interviews with Experts, MarketsandMarkets Analysis
KEY MARKET PLAYERS
- Siemens Healthineers (Germany)
- GE HealthCare (US)
- Philips Healthcare (Netherlands)
- FUJIFILM Corporation (Japan)
- Canon Medical (Japan)
- Hologic, Inc. (US)
- Samsung Healthcare (South Korea)
- Shimadzu Corporation (Japan)
- United Imaging (China)
- Mindray Medical (China)
- Carestream Health (US)
- Esaote (Italy)
- Planmed Oy (Finland)
MARKET SCOPE
| REPORT METRIC | DETAILS |
|---|---|
| Market Size in 2024 (Value) | USD 25.48 BN |
| Market Forecast in 2030 (Value) | USD 32.90 BN |
| Growth Rate | 4.4% |
| Years Considered | 2023–2030 |
| Base Year | 2024 |
| Forecast Period | 2025–2030 |
| Units Considered | Value (USD BN), Volume (Unit) |
| Report Coverage | Revenue forecast, company ranking, competitive landscape, growth factors, and trends |
| Segments Covered | By Modality [CT Scanners (High-slice, mid-slice, low-slice, Cone Beam CT), Ultrasound Systems (2D, 3D/4D, Doppler, Contrast-enhanced, Trolley-based, Cart-based), X-ray Imaging Systems (Digital, Analog, Stationary, Portable), MRI Systems (Closed, Open, Hig |
| Regions Covered | North America, Asia Pacific, Europe, Latin America, and the Middle East & Africa |
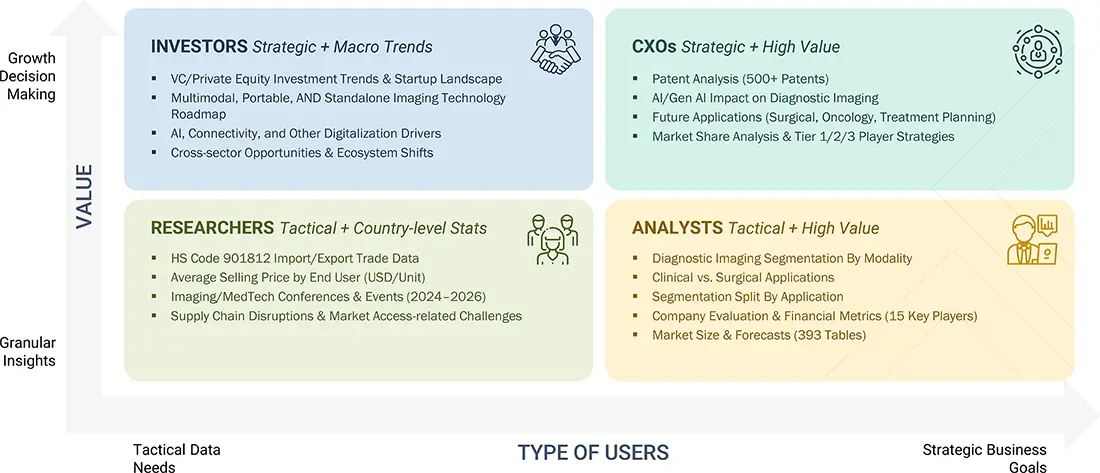
WHAT IS IN IT FOR YOU: diagnostic Imaging market REPORT CONTENT GUIDE
DELIVERED CUSTOMIZATIONS
We have successfully delivered the following deep-dive customizations:
| CLIENT REQUEST | CUSTOMIZATION DELIVERED | VALUE ADDS |
|---|---|---|
| Leading OEM |
|
|
| Software Provider |
|
|
RECENT DEVELOPMENTS
- 5/1/2025 12:00:00 AM : NVIDIA and Philips collaborated to create a fundamental AI model for MRI with the goals of improving diagnostic accuracy across clinical applications, speeding up scans, and improving image quality.
- 2/1/2025 12:00:00 AM : GE Healthcare unveiled Freelium, a next-generation sealed magnet platform MRI platform that operates without helium, making it a sustainable option.
- 1/1/2025 12:00:00 AM : Siemens Healthineers entered into a technology licensing agreement with Kromek Group's technology to produce cadmium zinc telluride (CZT) material in-house, enabling future development of gamma ray detectors for multi-modal SPECT systems while continuing to innovate its sodium iodide (Nal) SPECT technologies.
- 1/1/2025 12:00:00 AM : Philips launched the Flash Ultrasound System 5100 POC, a portable, high-clarity ultrasound designed for fast-paced point-of-care use in anesthesia, emergency, and critical care settings.
- 12/1/2024 12:00:00 AM : Siemens Healthineers received FDA clearance for Magnetom Terra. X, a 7T MRI system with first-in-category eight-channel parallel transmission.
Table of Contents
 Exclusive indicates content/data unique to MarketsandMarkets and not available with any competitors.
Methodology
The study involved four major activities in estimating the current size of the diagnostic imaging market. Exhaustive secondary research was done to collect information on the peer and parent markets. The next step was to validate these findings, assumptions, and sizing with industry experts across the value chain through primary research. Both top-down and bottom-up approaches were employed to estimate the complete market size. After that, market breakdown and data triangulation were used to estimate the market size of segments and subsegments.
Secondary Research
The secondary research process involves the widespread use of secondary sources, directories, databases (such as Bloomberg Businessweek, Factiva, and D&B Hoovers), white papers, annual reports, company house documents, investor presentations, and SEC filings of companies. Secondary research was used to identify and collect information useful for the extensive, technical, market-oriented, and commercial diagnostic imaging market study. It was also used to obtain important information about the key players and market classification & segmentation according to industry trends to the bottom-most level, and key developments related to market and technology perspectives. A database of the key industry leaders was also prepared using secondary research.
Primary Research
In the primary research process, various supply and demand sources were interviewed to obtain qualitative and quantitative information for this report. The primary sources from the supply side include industry experts such as CEOs, vice presidents, marketing and sales directors, technology & innovation directors, and related key executives from various key companies and organizations in the diagnostic imaging market. The primary sources from the demand side include medical OEMs, CDMOs, and service providers. Primary research was conducted to validate the market segmentation, identify key players, and gather insights on key industry trends & key market dynamics.
A breakdown of the primary respondents is provided below:

Note 1: Others include sales managers, marketing managers, business development managers, product managers, distributors, and suppliers.
Note 2: D-level executives include directors of operations, directors of finance, directors of marketing, and directors of product management
Note 3: C-level executives include chief executive officers, chief financial officers, chief operating officers, and chief marketing officers.
Note 4: Companies are classified into tiers based on their total revenue. As of 2024, Tier 1 = >USD 2 billion, Tier 2 = USD 50 million to USD 2 billion, and Tier 3 = < USD 50 million.
To know about the assumptions considered for the study, download the pdf brochure
Market Size Estimation
In this report, the size of the diagnostic imaging market was determined using the revenue share analysis of leading players. For this purpose, key players in the market were identified, and their revenues from the market business were determined through various insights gathered during the primary and secondary research phases. Secondary research included studying the annual and financial reports of the top market players. In contrast, primary research included extensive interviews with key opinion leaders, such as CEOs, directors, and key marketing executives.
Segmental revenues were calculated based on the revenue mapping of major product providers to calculate the global market value. This process involves the following steps:
- Generating a list of major global players operating in the diagnostic imaging market
- Mapping annual revenues generated by major global players from the product segment (or nearest reported business unit/category)
- Mapping the revenues of major players to cover a major share of the global market, as of 2024
- Extrapolating the global value of the diagnostic imaging market industry

Data Triangulation
After arriving at the overall market size from the market size estimation process explained above, the global diagnostic imaging market was split into segments and subsegments. Data triangulation and market breakdown procedures were employed to complete the overall market engineering process and arrive at the exact statistics for all segments and subsegments. The data was triangulated by studying various factors and trends from both the demand and supply sides. Additionally, the diagnostic imaging market was validated using top-down and bottom-up approaches.
Market Definition
Diagnostic imaging involves the use of various diagnostic modalities to visualize a patient’s anatomy. This market addresses the industry focusing on various technologies used for the detection, monitoring, and diagnosis of different medical conditions. Different imaging modalities include computed tomography (CT), ultrasound, X-ray imaging, MRI, nuclear imaging, and mammography technologies. These modalities help healthcare professionals to visualize the internal structure and other surrounding tissues. Diagnostic imaging equipment is primarily used in hospitals, diagnostic imaging centers, and ambulatory imaging centers.
Stakeholders
- Senior Management
- End Users
- R&D Department
- Finance/Procurement Department
Report Objectives
- To define, describe, and forecast the size of the diagnostic imaging market based on modality, application, end user, and region
- To provide detailed information regarding the major factors influencing the growth potential of the global diagnostic imaging market (drivers, restraints, opportunities, challenges, and trends)
- To analyze the micromarkets with respect to individual growth trends, prospects, and contributions to the global diagnostic imaging market
- To analyze key growth opportunities in the global diagnostic imaging market for key stakeholders and provide details of the competitive landscape for market leaders
- To forecast the size of market segments and/or subsegments with respect to five major regions: North America (US and Canada), Europe (Germany, France, the UK, Spain, Italy, and the Rest of Europe), Asia Pacific (Japan, China, India, Australia, South Korea, and the Rest of Asia Pacific), Latin America (Brazil, Mexico, and the Rest of Latin America), and the Middle East & Africa
- To profile the key players in the diagnostic imaging market and comprehensively analyze their market shares and core competencies
- To track and analyze the competitive developments undertaken in the global diagnostic imaging market, such as product launches, agreements, expansions, alliances, and mergers & acquisitions
Key Questions Addressed by the Report
What is the expected addressable market value of the global diagnostic imaging market over the forecast period (2025–2030)?
The market is expected to reach USD 32.9 billion by 2030 from USD 26.5 billion in 2025, growing at a CAGR of 4.4% from 2025 to 2030.
Which modality segment is expected to garner the highest traction within the diagnostic imaging market?
The ultrasound systems segment is expected to grow at the highest rate.
What strategies are top market players adopting to penetrate emerging regions?
Strategies include establishing localized manufacturing facilities, collaborating with local healthcare providers, offering portable or low-cost imaging technologies, and expanding training and service networks.
What are the major factors expected to limit the growth of the diagnostic imaging market?
Key restraints include the adoption of refurbished systems, infrastructure limitations, lack of imaging centers in underserved areas, and a shortage of skilled professionals.
Which are the major companies in the diagnostic imaging market?
Major companies include GE HealthCare (US), Siemens Healthineers (Germany), and Koninklijke Philips N.V. (Netherlands).
Need a Tailored Report?
Customize this report to your needs
Get 10% FREE Customization
Customize This ReportPersonalize This Research
- Triangulate with your Own Data
- Get Data as per your Format and Definition
- Gain a Deeper Dive on a Specific Application, Geography, Customer or Competitor
- Any level of Personalization
Let Us Help You
- What are the Known and Unknown Adjacencies Impacting the Diagnostic Imaging Market
- What will your New Revenue Sources be?
- Who will be your Top Customer; what will make them switch?
- Defend your Market Share or Win Competitors
- Get a Scorecard for Target Partners

Custom Market Research Services
We Will Customise The Research For You, In Case The Report Listed Above Does Not Meet With Your Requirements
Get 10% Free CustomisationTESTIMONIALS

JAYANT RAJPUROHIT
Director of Market Insights, Data and Analytics
SFI Health,
Leading Pharmaceutical Companywww.sfihealth.com/

We at SFI Health approached MarketsandMarkets for an Opportunity Assessment on "Incidence and Prevalence of Focus Indications" as we wanted to know the most attractive HCPs like Physician, Functional MD, Naturopath and Pharmacist. The project was critical for us to ensure our focus on the right target which would enable sustainable growth and profitability for SFI Health. The business insights provided exceeded our expectations and we were extremely impressed. The team at MarketsandMarkets is highly professional and detail oriented and very well understood our business needs. MarketsandMarkets offers a unique combination of expertise and dedicated engagement model. We identified 2 new products to be launched in coming months, based on the research findings provided by MarketsandMarkets. We are happy with the services and would strongly recommend MarketsandMarkets to my peers in the industry.

BEATRIZ DE LA CALLE
Head of Commercial Analytics
Qualicaps,
Leading Pharmaceutical Companywww.qualicaps.com/

We partnered with MarketsandMarkets for an assessment study on hard empty capsules. The team was extremely professional in understanding our business requirements and we received timely responses to all our queries. The market intelligence and the recommendations has met our business requirements. We were extremely impressed to see the final study results; it really exceeded our expectations. The market intelligence offered by MarketsandMarkets, and clarity on next steps will help us achieve our business objective for the Year 2021. We are happy with the services and would strongly recommend MarketsandMarkets to my peers in the industry.

Bob Williams,
Senior Director Business Development & Innovation
Bracco Diagnostics Inc.,
Italian Multinational in life sciences sector and a World Leader in imaging diagnosticsimaging.bracco.com/us-en
We were pleased with targeted insights that MarketsandMarkets identified from a custom study on the 'Radiation Dose Management Solutions Market'. Your team identified and characterized the market participants as well as underlying trends accurately. This study was useful to Bracco in formulating business strategies for our dose monitoring product lines and we thank MarketsandMarkets for the job well done.
Cody Coonradt,
Market Development and Strategy Manager
3M Health Information Systems,
Leader in Health care Coding, Payment & Analytics Solutions.www.3m.com/3M/en_US/health-information-systems-us
The value for our organization comes from three things: depth of research, specificity of segments and being easy to work with. As important as the first two are, the third can't be underestimated. MarketsandMarkets, maybe more than any other research vendor, wants to know what is top of mind for our team and what big questions we are grappling to answer.
Their customer first approach and high value engagement model, have given us great analysis and excellent value for money
Growth opportunities and latent adjacency in Diagnostic Imaging Market

Still Researching the
Diagnostic Imaging Ecosystem?
See the competitors, opportunities, and growth signals shaping it - instantly.
Generate 15+ consulting-grade strategic insights tailored to your growth question.


Alex
May, 2022
What are the countries across major regions globally covered into the Diagnostic Imaging Market Report ?.
John
May, 2022
Which is the fastest growing market of Diagnostic Imaging Market ?.
Kahlill
Nov, 2022
Can you elaborate on some of the recent major developments the diagnostic imaging market has witnessed?.
Olive
Nov, 2022
According to this report, what are some significant growth factors that drive the adoption of diagnostic imaging devices?.