
Home Healthcare Market Size, Growth, Share & Trends Analysis
Home Healthcare Market by Product (Therapeutic, Testing, Screening, Monitoring, Mobility Care), Service (Nursing, Infusion Therapy, Rehabilitation, Palliative Care), Indication (Cancer, Diabetes, CVD, Respiratory, Wound Care) - Global Forecast to 2030


OVERVIEW
Source: Secondary Research, Interviews with Experts, MarketsandMarkets Analysis
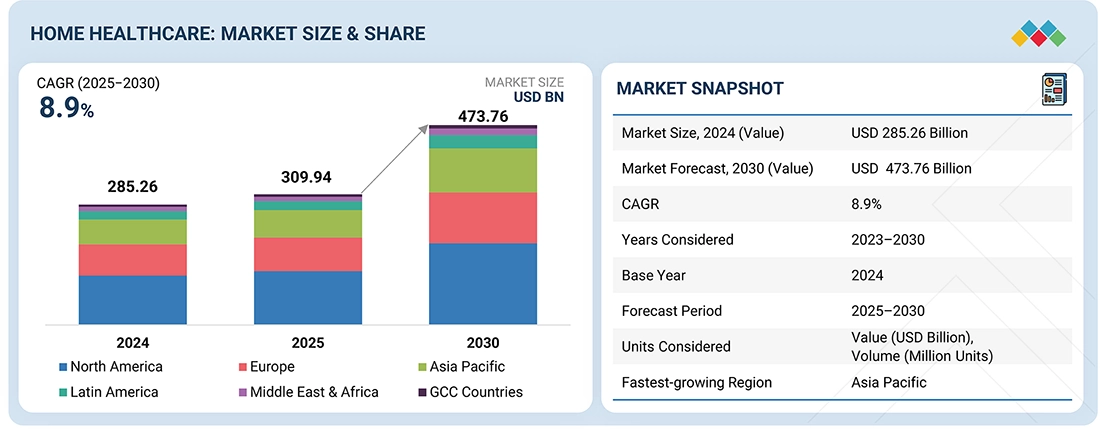
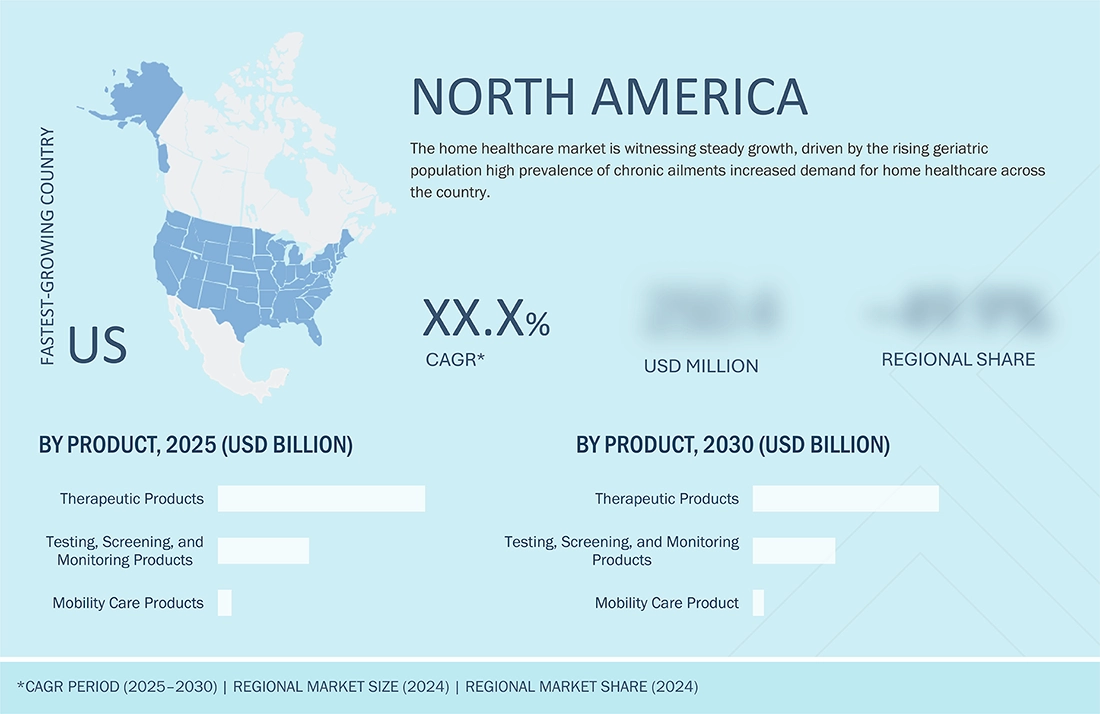
The global home healthcare market is projected to grow from USD 309.94 billion in 2025 to USD 473.76 billion by 2030, registering a strong CAGR of 8.9% during the forecast period. This growth is primarily driven by the expanding elderly population, which is at higher risk for chronic conditions such as hypertension, diabetes, and cardiovascular diseases, thereby increasing the demand for continuous care at home. The widespread adoption of telehealth and remote patient monitoring solutions is enhancing accessibility and convenience, while rising awareness of the importance of early diagnosis and preventive care is further fueling market demand. Moreover, innovations in home healthcare devices are improving ease of use and affordability, supporting greater adoption across both developed and emerging markets.
KEY TAKEAWAYS
-
BY REGIONThe Asia Pacific region is projected to register the highest CAGR during the forecast period. This growth is fueled by a rising prevalence of chronic diseases, an aging population, and increasing healthcare costs, which make home-based care a more practical and cost-effective option.
-
BY PRODUCTThe therapeutic products segment dominates, driven by the rising prevalence of chronic conditions such as kidney disease, sleep disorders, and respiratory illnesses like COPD.
-
BY SERVICESkilled nursing is estimated to account for the largest share, driven by growing demand for professional medical care at home.
-
BY indicationCancer is estimated to account for the largest share, driven by the increasing number of patients needing long-term treatment, palliative care, and symptom management at home.
-
COMPETITIVE LANDSCAPEKey market players have adopted a combination of organic and inorganic strategies, including product launches, partnerships, and acquisitions. Leading companies, such as Fresenius, Abbott, and Linde PLC, have expanded their service offerings and formed strategic collaborations to enhance home healthcare solutions and meet the growing demand for advanced, patient-centric care at home.
The home healthcare market is estimated to experience substantial growth over the coming decade, driven by the increasing elderly population and the rising incidence of chronic diseases. Older adults are particularly vulnerable to conditions such as heart disease, diabetes, arthritis, and respiratory disorders, which often necessitate continuous care and routine monitoring. Moreover, lifestyle changes, poor nutrition, and insufficient physical activity are contributing to a growing prevalence of chronic health issues across all age groups. These factors are fueling demand for personalized, cost-efficient healthcare that can be provided in the comfort of patients’ homes. As a result, home healthcare is becoming a favored solution, delivering convenience, affordability, and an improved quality of life for individuals managing long-term health conditions.
TRENDS & DISRUPTIONS IMPACTING CUSTOMERS' CUSTOMERS
The impact on service providers arises from evolving customer trends and market disruptions. Home healthcare service providers/individuals are the primary clients of home healthcare solution manufacturers. Changes in healthcare delivery models, patient preferences, and technological adoption can directly influence the revenues of both end users and home healthcare product and service providers.
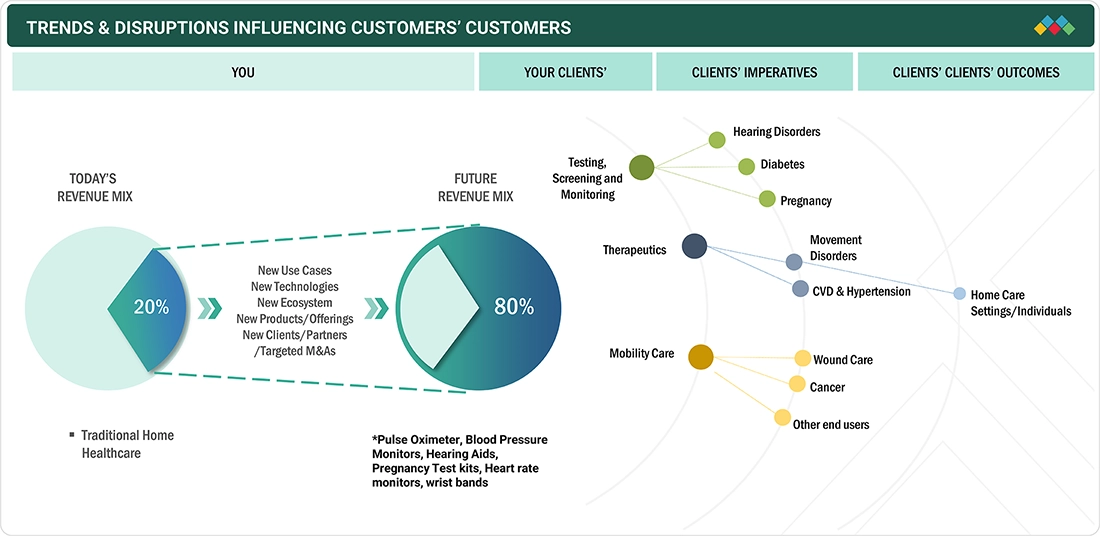
Source: Secondary Research, Interviews with Experts, MarketsandMarkets Analysis
MARKET DYNAMICS
Level
-
Growing elderly population and rising incidence of chronic disease

-
Rapid technological advancements

Level
-
Changing reimbursement policies

-
Limited insurance Coverage

Level
-
Rising focus on telehealth

-
Growing preference for home-based treatments

Level
-
Shortage of home care workers

-
Lack of supporting infrastructure

Source: Secondary Research, Interviews with Experts, MarketsandMarkets Analysis
Driver: Growing elderly population and rising incidence of chronic disease
The global elderly population, especially those over 85, is set to more than double, driving demand for healthcare services. Home healthcare is increasingly preferred for its ability to reduce hospital visits, lower costs, and provide care at home. Chronic diseases like cardiovascular conditions, cancer, diabetes, and respiratory disorders affect many patients, and home-based care helps manage these illnesses, improve quality of life, and ease the burden on hospitals. Rising geriatric populations and chronic disease prevalence are expected to accelerate global demand for home healthcare and continuous monitoring.
Restraint: Changing reimbursement policies
CMS has revised home healthcare reimbursement through the Patient-Driven Groupings Model, focusing on patient acuity and clinical needs while reducing payment rates, which can impact smaller and rural providers. Value-based programs now emphasize outcomes, social factors, and discharge planning. Durable medical equipment, like home ventilators, is reimbursed on a rental basis, but gaps remain between actual costs and coverage. Reduced reimbursement for diagnostic testing has also slowed technology adoption and delayed accurate diagnoses, creating challenges for patient care.
Opportunity: Rising focus on telehealth
Telehealth is reshaping home healthcare by enabling remote patient monitoring, virtual consultations, and early interventions. Tools like mHealth apps, video consultations, and connected devices allow providers to assess conditions, prescribe treatments, and follow up without in-person visits, improving convenience and reducing costs by shifting care from expensive settings to virtual platforms. Globally, supportive policies and digital infrastructure—such as 5G, high-resolution devices, and electronic health records—are accelerating telehealth adoption, creating new opportunities for providers to enhance care and expand services.
Challenge: Shortage of home care workers
The home healthcare industry is expanding rapidly, driving strong demand for personal care and home health aides. Despite this growth, attracting and retaining workers remains a challenge due to low compensation, making the profession less appealing, especially to younger job seekers. As a result, the supply of qualified home care workers often falls short of demand, posing challenges for providers in delivering consistent, high-quality care.
Home Healthcare Market: COMMERCIAL USE CASES ACROSS INDUSTRIES
| COMPANY | USE CASE DESCRIPTION | BENEFITS |
|---|---|---|
 |
Home dialysis systems (peritoneal dialysis and home hemodialysis) | Improves patient convenience, reduces hospital visits, enhances quality of life, and lowers long-term treatment costs |
 |
Remote cardiac monitoring and glucose monitoring devices for home use | Enables continuous monitoring, supports early detection, empowers self-management of chronic conditions, and improves clinical outcomes |
 |
Home oxygen therapy and respiratory support solutions | Provides reliable long-term respiratory care, increases mobility and independence for patients, and reduces hospital readmissions |
 |
Home-based diagnostic tests (e.g., diabetes and infectious disease self-testing kits) | Facilitates early diagnosis, expands patient access to testing, enhances treatment adherence, and reduces pressure on healthcare facilities |
 |
Home sleep apnea therapy devices, including CPAP and BiPAP systems | Improves sleep quality, reduces cardiovascular risks, enhances patient compliance, and delivers real-time data for remote clinician monitoring |
Logos and trademarks shown above are the property of their respective owners. Their use here is for informational and illustrative purposes only.
MARKET ECOSYSTEM
The home healthcare market ecosystem comprises raw material suppliers (DuPont, Qmed, Avantor), device and equipment manufacturers (Fresenius Medical Care AG, Abbott, Linde PLC), and end users (Care UK, LHC Group). Raw materials, including plastics, electronic components, and specialized medical-grade materials, are processed into reliable, high-performance home healthcare devices. End users drive demand for safety, durability, and ease of use, while manufacturers deliver precision-engineered solutions that meet these needs. Collaboration across the value chain is crucial for fostering innovation and driving market growth.
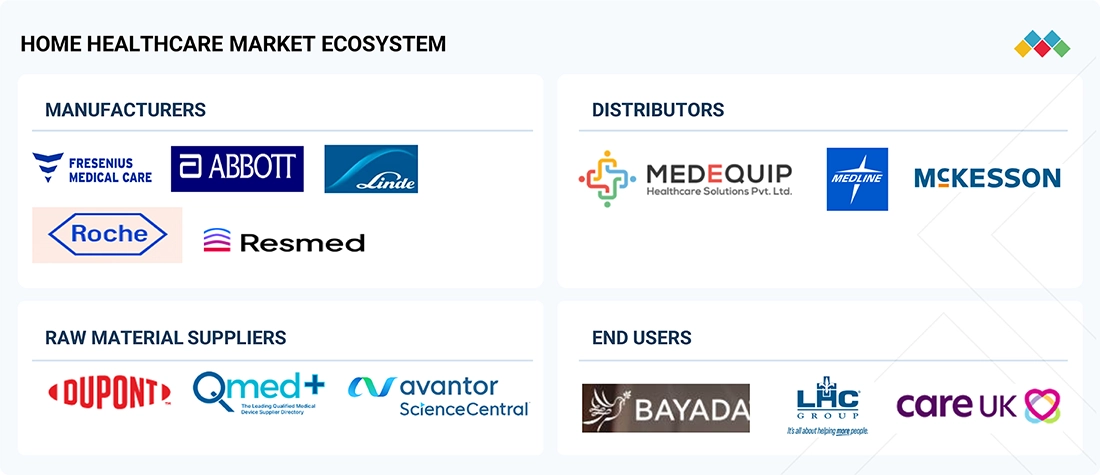
Logos and trademarks shown above are the property of their respective owners. Their use here is for informational and illustrative purposes only.
MARKET SEGMENTS
Source: Secondary Research, Interviews with Experts, MarketsandMarkets Analysis
Home Healthcare Market, by Product
The therapeutic products segment leads, driven by the growing prevalence of chronic diseases like kidney failure, respiratory disorders, cardiovascular conditions, and diabetes. Home-based therapeutic equipment reduces hospital visits, improves patient comfort and compliance, and enhances quality of life. Advances in compact, user-friendly medical devices, along with supportive reimbursement policies, are further boosting adoption, making this segment a key growth driver in the home healthcare market.
Home Healthcare Market, by Service
Skilled nursing services hold the largest share of the home healthcare market, driven by the growing need for professional medical care at home. Licensed nurses provide services such as medication administration, wound care, chronic condition monitoring, and post-surgical support. Rising elderly populations and an increasing number of patients with complex health needs are fueling demand. As healthcare systems emphasize cost-effective, patient-centered care, the shift toward home-based services is accelerating, making skilled nursing a central component of the expanding home healthcare industry.
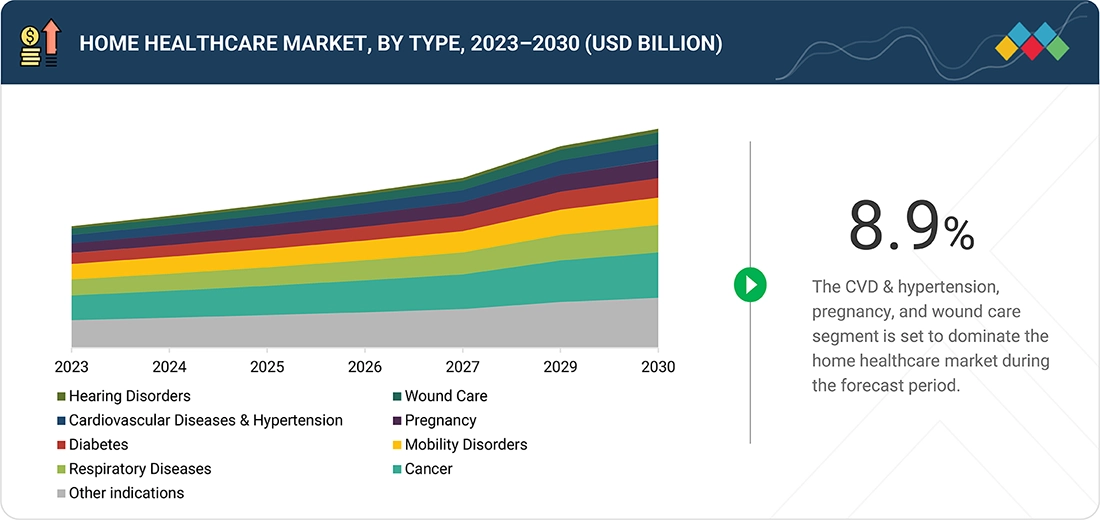
Home Healthcare Market, by Indication
Among various medical indications, the cancer segment held the largest share of the home healthcare market in 2024, driven by the rising global cancer burden and increasing preference for home-based care. Home oncology services are particularly important for patients in advanced stages or those recovering after treatment. Growing awareness of palliative and supportive care is also encouraging families to opt for at-home services, providing a more personalized and dignified experience for patients.
REGION
Asia Pacific to be fastest-growing region in global home healthcare market during forecast period
During the forecast period, Asia Pacific is projected to experience the fastest growth in home healthcare, driven by a surge in chronic illnesses, an aging demographic, and escalating healthcare costs, which favor home-based care solutions. Enhanced government initiatives, improved access to rural healthcare, and rising investments in healthcare infrastructure and digital technologies are further boosting the uptake of home healthcare across nations.
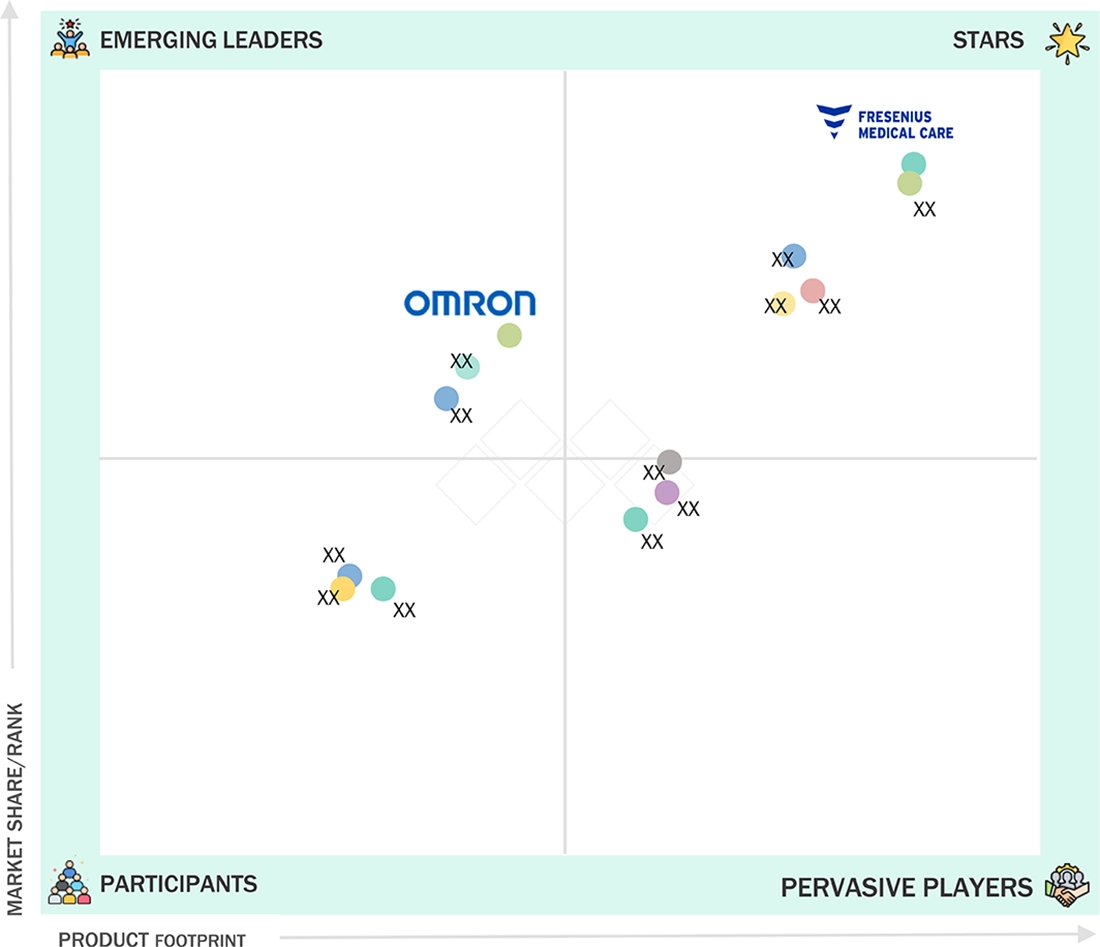
Home Healthcare Market: COMPANY EVALUATION MATRIX
In the home healthcare market matrix, Fresenius Medical Care (Star) leads with a strong market share and a wide-ranging product portfolio, driven by its advanced and reliable home healthcare devices widely adopted in hospitals and home care settings. Omron (Emerging Leader) is gaining recognition with its innovative and specialized home healthcare solutions, strengthening its position through targeted product offerings and technology advancements. While Fresenius dominates through scale and a diverse portfolio, Omron shows significant potential to move toward the leaders’ quadrant as demand for high-quality, user-friendly home healthcare devices continues to grow.
Source: Secondary Research, Interviews with Experts, MarketsandMarkets Analysis
KEY MARKET PLAYERS
- Fresenius Medical Care AG (Germany)
- Abbott (US)
- Linde plc (Ireland)
- F. Hoffmann-La Roche, Ltd. (Switzerland)
- ResMed (US)
- Koninklijke Philips N.V. (Netherlands)
- GE Healthcare (US)
- A&D HOLON Holdings Company, Limited (Japan)
- Convatec Group PLC (UK)
- Amedisys (US)
- OMRON Healthcare Co., Ltd. (Japan)
- Invacare Corporation (US)
- BAYADA Home Health Care (US)
- Drive DeVilbiss Healthcare (UK)
- Sunrise Medical (Germany)
MARKET SCOPE
| REPORT METRIC | DETAILS |
|---|---|
| Market Size, 2024 (Value) | USD 285.26 Billion |
| Market Forecast, 2030 (Value) | USD 473.76 Billion |
| Growth Rate | CAGR of 8.9% from 2025 to 2030 |
| Years Considered | 2023–2030 |
| Base Year | 2024 |
| Forecast Period | 2025–2030 |
| Units Considered | Value (USD Billion), Volume (Million Units) |
| Report Coverage | Revenue Forecast, Company Ranking, Competitive Landscape, Growth Factors, and Trends |
| Segments Covered |
|
| Regional Scope | North America, Europe, Asia Pacific, Latin America, Middle East & Africa, GCC Countries |
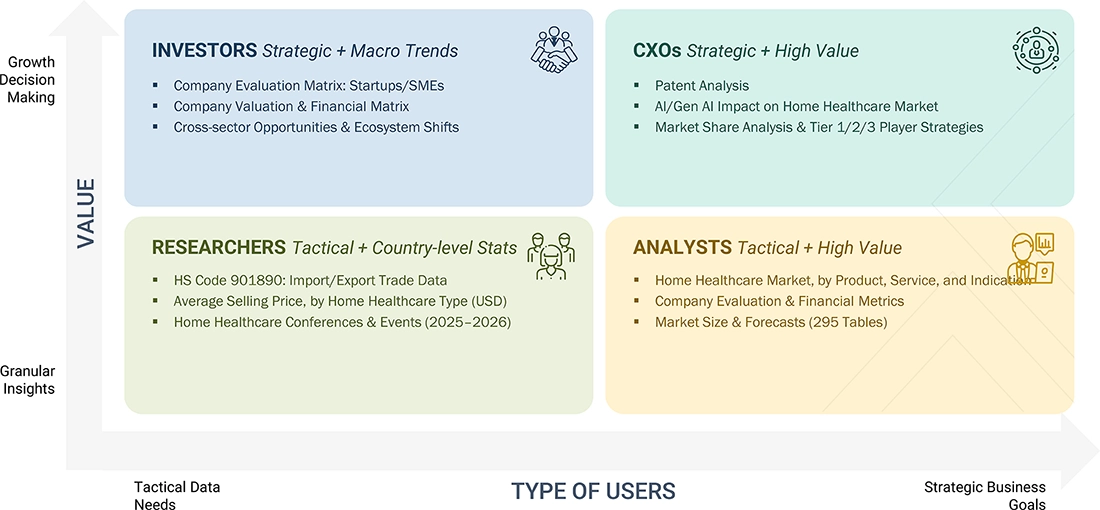
WHAT IS IN IT FOR YOU: Home Healthcare Market REPORT CONTENT GUIDE
DELIVERED CUSTOMIZATIONS
We have successfully delivered the following deep-dive customizations:
| CLIENT REQUEST | CUSTOMIZATION DELIVERED | VALUE ADDS |
|---|---|---|
| Healthcare Leader |
|
|
| Major Player in Home Healthcare |
|
Highlight adoption patterns of home healthcare technologies, end-user preferences, and regulatory impacts on product deployment |
RECENT DEVELOPMENTS
- August 2024 : Abbott (US) announced a global partnership with Medtronic (Ireland) to develop an integrated continuous glucose monitoring (CGM) system, strengthening home diabetes care solutions.
- May 2024 : Liberty Dialysis Hawaii, an affiliate of Fresenius Medical Care AG (Germany), opened its first home hemodialysis patient training center in Windward O'ahu, Hawai'i, expanding home care services.
- April 2024 : Fresenius Medical Care AG (Germany) launched the latest generation of its home dialysis system, NxStage Versi HD with GuideMe Software, enhancing patient convenience and monitoring capabilities.
- May 2023 : ResMed (US) acquired Somnoware Software (US), a provider of sleep and respiratory care diagnostics software, to enhance its home care technology offerings.
Table of Contents
 Exclusive indicates content/data unique to MarketsandMarkets and not available with any competitors.
Methodology
This study involved the extensive use of both primary and secondary sources. The research process involved the study of various factors affecting the industry to identify the segmentation types, industry trends, key players, competitive landscape, fundamental market dynamics, and key player strategies.
Secondary Research
The secondary research process involves the widespread use of secondary sources, directories, databases (such as Bloomberg Businessweek, Factiva, and D&B Hoovers), white papers, annual reports, investor presentations, SEC filings of companies and publications from government sources [such as National Institutes of Health (NIH), US FDA, US Census Bureau, World Health Organization (WHO), , Global Burden of Disease Study, and Centers for Medicare and Medicaid Services (CMS) were referred to identify and collect information for the global home healthcare market study. It was also used to obtain important information about the key players and market classification & segmentation according to industry trends to the bottom-most level, and key developments related to market and technology perspectives. A database of the key industry leaders was also prepared using secondary research.
Primary Research
In the primary research process, various sources from both the supply and demand sides were interviewed to obtain qualitative and quantitative information for this report. The primary sources from the supply side include industry experts such as CEOs, vice presidents, marketing and sales directors, technology & innovation directors, and related key executives from various key companies and organizations in the home healthcare market. The primary sources from the demand side include home healthcare service providers and home users. Primary research was conducted to validate the market segmentation, identify key players in the market, and gather insights on key industry trends & key market dynamics.
A breakdown of the primary respondents is provided below:

*C-level primaries include CEOs, CFOs, COOs, and VPs.
*Other designations include sales managers, marketing managers, business development managers, product managers, distributors, and suppliers.
Note: Companies are classified into tiers based on their total revenue. As of 2023, Tier 1 = >USD 10.00 billion, Tier 2 = USD 1.00 billion to USD 10.00 billion, and Tier 3 = < USD 1.00 billion.
Source: MarketsandMarkets Analysis
To know about the assumptions considered for the study, download the pdf brochure
Market Size Estimation
For the global market value, annual revenues were calculated based on the revenue mapping of major product manufacturers and OEMs active in the global home healthcare market. All the major service providers were identified at the global and/or country/regional level. Revenue mapping for the respective business segments/subsegments was done for the major players. Also, the global home healthcare market was split into various segments and sub-segments based on:
- List of major players operating in the product market at the regional and/or country level
- Product mapping of home healthcare providers at the regional and/or country level
- Mapping of annual revenue generated by listed major players from home healthcare (or the nearest reported business unit/product category)
- Extrapolation of the revenue mapping of the listed major players to derive the global market value of the respective segments/subsegments
- Summation of the market value of all segments/subsegments to arrive at the global home healthcare market
The above-mentioned data was consolidated and added with detailed inputs and analysis from MarketsandMarkets and presented in this report.
Market Size Estimation (Bottom-up Approach & Top-down Approach)

Data Triangulation
After arriving at the overall size of the global home healthcare market through the above-mentioned methodology, this market was split into several segments and subsegments. The data triangulation and market breakdown procedures were employed, wherever applicable, to complete the overall market engineering process and arrive at the exact market value data for the key segments and subsegments. The extrapolated market data was triangulated by studying various macro indicators and regional trends from both demand- and supply-side participants.
Market Definition
Home healthcare refers to the medical attention, care, and support provided to patients at their residences by licensed healthcare workers, such as nurses, home health aides, and personal care aides. The home healthcare market includes products and services that can be set up remotely at a patient’s home.
Stakeholders
- Home Healthcare Equipment Manufacturers
- Home Healthcare Service Providers
- Home Health Software Vendors
- Nursing Service Providers
- Wound Care Product Manufacturers
- Pregnancy Care Product Manufacturers and Service Providers
- Supportive Care Product Manufacturers and Service Providers
- Diagnostic Companies
- Research & Development (R&D) Companies
- Business Research and Consulting Service Providers
- Medical Research Laboratories
- Venture Capitalists
Report Objectives
- To define, describe, segment, and forecast the global home healthcare market by product, service, indication, and region
- To provide detailed information regarding the major factors influencing the market growth (such as drivers, restraints, opportunities, and challenges)
- To analyze the micromarkets with respect to individual growth trends, prospects, and contributions to the overall home healthcare market
- To analyze market opportunities for stakeholders and provide details of the competitive landscape for key players
- To forecast the size of the market segments with respect to five regions: North America, Europe, the Asia Pacific, Latin America, Middle East & Africa, and GCC Countries
- To profile the key players and comprehensively analyze their product portfolios, market positions, and core competencies
- To track and analyze company developments such as acquisitions, product launches & approvals, and expansions
- To benchmark players within the market using the proprietary “Competitive Leadership Mapping” framework, which analyzes market players on various parameters within the broad categories of business and product strategy
Key Questions Addressed by the Report
Which are the top industry players in the home healthcare market?
The key players in this market are Fresenius Medical Care AG (Germany), Abbott (US), Linde plc (Ireland), F. Hoffmann-La Roche, Ltd. (Switzerland), ResMed (US), Koninklijke Philips N.V. (Netherlands), GE Healthcare (US), A&D HOLON Holdings Company, Limited, Convatec Group PLC (UK), Amedisys (US), OMRON Healthcare Co., Ltd. (Japan).
What are some of the major drivers for this market?
Recent trends significantly shaping the home healthcare market include the rapid growth of the aging population, the increasing prevalence of chronic diseases, and the rising demand for affordable and accessible healthcare solutions. As the global elderly population expands, there is a greater need for continuous medical support to manage age-related health conditions such as heart disease, arthritis, diabetes, and respiratory disorders. At the same time, healthcare systems worldwide are under pressure to reduce costs without compromising the quality of care. Home healthcare has emerged as a practical solution, offering personalized medical services in the comfort of patients' homes, helping reduce hospital visits, lower treatment costs, and improve patient outcomes. These trends are collectively driving the demand for home-based medical care, technologies, and professional support services.
What are the major products used in home healthcare?
The home healthcare market is segmented into testing, screening, and monitoring products; therapeutic products; and mobility care products. The therapeutic products accounted for the largest share of the home healthcare market in 2024.
What are the major indications of the home healthcare market?
This report contains the following indication segments: cancer, respiratory diseases, mobility disorders, cardiovascular diseases and hypertension, pregnancy, wound care, diabetes, hearing disorders, and other indications.
Which region is lucrative for the global home healthcare market?
The Asia Pacific region is anticipated to experience the fastest growth in the home healthcare market during the forecast period. The growing demand for high-quality, patient-centered healthcare services is encouraging the adoption of home-based care solutions. In addition, increasing healthcare expenditures, favorable government policies, and greater public awareness about the benefits of home monitoring and early intervention are further accelerating market expansion. These factors are collectively boosting the demand for a wide range of home healthcare products and services across the region.
Need a Tailored Report?
Customize this report to your needs
Get 10% FREE Customization
Customize This ReportPersonalize This Research
- Triangulate with your Own Data
- Get Data as per your Format and Definition
- Gain a Deeper Dive on a Specific Application, Geography, Customer or Competitor
- Any level of Personalization
Let Us Help You
- What are the Known and Unknown Adjacencies Impacting the Home Healthcare Market
- What will your New Revenue Sources be?
- Who will be your Top Customer; what will make them switch?
- Defend your Market Share or Win Competitors
- Get a Scorecard for Target Partners

Custom Market Research Services
We Will Customise The Research For You, In Case The Report Listed Above Does Not Meet With Your Requirements
Get 10% Free CustomisationTESTIMONIALS

JAYANT RAJPUROHIT
Director of Market Insights, Data and Analytics
SFI Health,
Leading Pharmaceutical Companywww.sfihealth.com/

We at SFI Health approached MarketsandMarkets for an Opportunity Assessment on "Incidence and Prevalence of Focus Indications" as we wanted to know the most attractive HCPs like Physician, Functional MD, Naturopath and Pharmacist. The project was critical for us to ensure our focus on the right target which would enable sustainable growth and profitability for SFI Health. The business insights provided exceeded our expectations and we were extremely impressed. The team at MarketsandMarkets is highly professional and detail oriented and very well understood our business needs. MarketsandMarkets offers a unique combination of expertise and dedicated engagement model. We identified 2 new products to be launched in coming months, based on the research findings provided by MarketsandMarkets. We are happy with the services and would strongly recommend MarketsandMarkets to my peers in the industry.

BEATRIZ DE LA CALLE
Head of Commercial Analytics
Qualicaps,
Leading Pharmaceutical Companywww.qualicaps.com/

We partnered with MarketsandMarkets for an assessment study on hard empty capsules. The team was extremely professional in understanding our business requirements and we received timely responses to all our queries. The market intelligence and the recommendations has met our business requirements. We were extremely impressed to see the final study results; it really exceeded our expectations. The market intelligence offered by MarketsandMarkets, and clarity on next steps will help us achieve our business objective for the Year 2021. We are happy with the services and would strongly recommend MarketsandMarkets to my peers in the industry.

Bob Williams,
Senior Director Business Development & Innovation
Bracco Diagnostics Inc.,
Italian Multinational in life sciences sector and a World Leader in imaging diagnosticsimaging.bracco.com/us-en
We were pleased with targeted insights that MarketsandMarkets identified from a custom study on the 'Radiation Dose Management Solutions Market'. Your team identified and characterized the market participants as well as underlying trends accurately. This study was useful to Bracco in formulating business strategies for our dose monitoring product lines and we thank MarketsandMarkets for the job well done.
Cody Coonradt,
Market Development and Strategy Manager
3M Health Information Systems,
Leader in Health care Coding, Payment & Analytics Solutions.www.3m.com/3M/en_US/health-information-systems-us
The value for our organization comes from three things: depth of research, specificity of segments and being easy to work with. As important as the first two are, the third can't be underestimated. MarketsandMarkets, maybe more than any other research vendor, wants to know what is top of mind for our team and what big questions we are grappling to answer.
Their customer first approach and high value engagement model, have given us great analysis and excellent value for money
- US Home Healthcare Market
- Canada Home Healthcare Market
- UK Home Healthcare Market
- Germany Home Healthcare Market
- France Home Healthcare Market
- Italy Home Healthcare Market
- Spain Home Healthcare Market
- China Home Healthcare Market
- Japan Home Healthcare Market
- India Home Healthcare Market
- GCC Countries Home Healthcare Market
Growth opportunities and latent adjacency in Home Healthcare Market


Olivia
Jun, 2026
After reviewing the Home Healthcare Market insights, I see a strong business case for providers to expand decentralized care models as aging populations and cost pressures continue to shift demand away from traditional hospital settings..
Ethan
Jun, 2026
From a strategic standpoint, the Home Healthcare Market highlights how technology integration, especially remote monitoring and digital health platforms, is becoming essential for improving patient outcomes while maintaining operational efficiency..
Sophia
Jun, 2026
Looking at the broader landscape, my takeaway from the Home Healthcare Market is that reimbursement frameworks and regional policy variations will play a decisive role in how quickly service providers can scale sustainably..
Matthew
Mar, 2022
Which is the fastest growing market of Home Healthcare Market?.
Mark
Mar, 2022
Can you enlighten us with your market intelligence to grow and sustain in Home Healthcare Market?.
Donald
Mar, 2022
What are the growth estimates for Home Healthcare Market till 2026?.