4
MARKET OVERVIEW
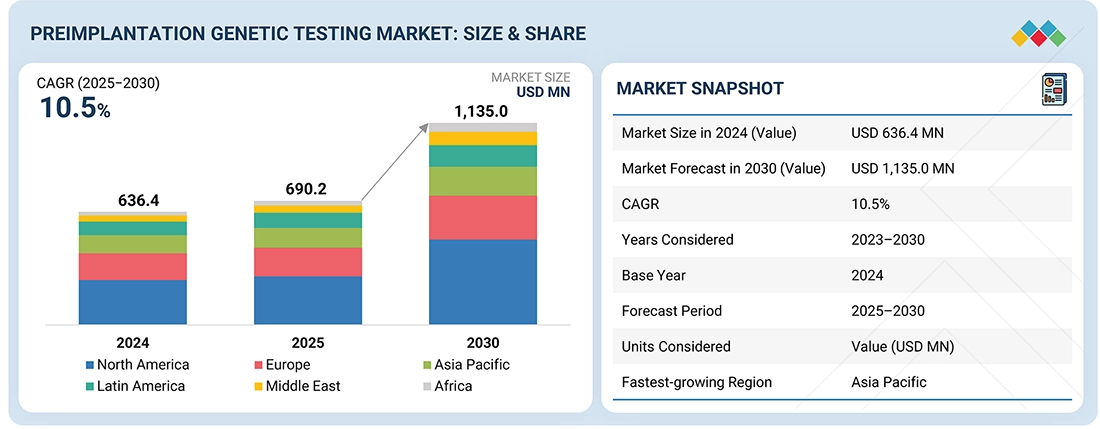
Fertility market thrives on clinic expansion, despite high costs and ethical challenges.
54
4.2.1.1
DECLINE IN FERTILITY RATES
4.2.1.2
EXPANDING NETWORK OF FERTILITY CLINICS AND IVF CENTERS
4.2.1.3
RISING INCIDENCE OF CHROMOSOMAL ABNORMALITIES ASSOCIATED WITH ADVANCING MATERNAL AGE
4.2.2.1
HIGH PROCEDURAL COST
4.2.2.2
STRINGENT REGULATORY FRAMEWORKS GOVERNING IVF AND GENETIC TESTING PROCEDURES
4.2.3.1
EXPANDING ACCEPTANCE OF FERTILITY TREATMENTS AMONG SINGLE PARENTS AND SAME-SEX COUPLES
4.2.4.1
SOCIO-ETHICAL CONCERNS REGARDING EMBRYO SCREENING AND SELECTION
4.3
UNMET NEEDS & WHITE SPACES
4.4
INTERCONNECTED MARKETS & CROSS-SECTOR OPPORTUNITIES
4.5
STRATEGIC MOVIES BY TIER-1/2/3 PLAYERS
5
INDUSTRY TRENDS
Emerging genetic testing innovations redefine competitive landscapes amid shifting economic and pricing dynamics.
62
5.1
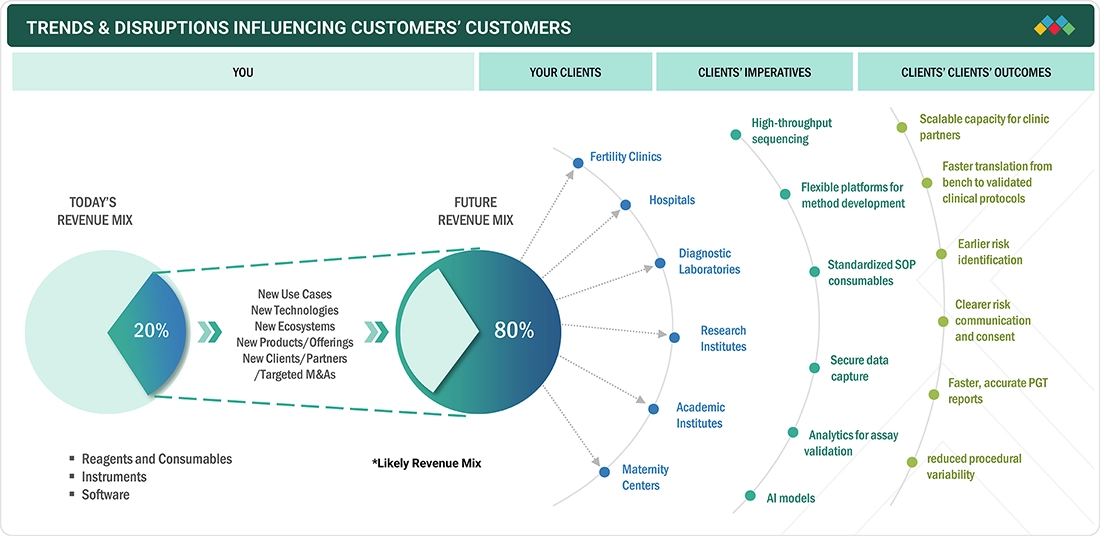
TRENDS/DISRUPTIONS IMPACTING CUSTOMER’S BUSINESS
5.2
MACROECONOMIC OUTLOOK
5.2.1
GDP TRENDS & FORECAST
5.2.2
R&D TRENDS IN GLOBAL HEALTHCARE INDUSTRY
5.2.3
R&D TRENDS IN GLOBAL PHARMA INDUSTRY
5.3.1
PGT-M FOR RPGRIP1L VARIANT-ENABLED BY MINIGENE ASSAY
5.3.2
PERSISTENT FETAL MOSAICISM AFTER TRANSFER OF PGT-A MOSAIC EMBRYO
5.3.3
CRYPTIC REARRANGEMENTS RESOLVED BY OGM TO GUIDE PGT-SR
5.4.1
AVERAGE SELLING PRICE TREND OF PREIMPLANTATION GENETIC TESTING PRODUCTS, BY END USER, 2022−2024
5.4.2
AVERAGE SELLING PRICE TREND OF PREIMPLANTATION GENETIC TESTING PRODUCTS, BY KEY PLAYER, 2022–2024
5.4.3
AVERAGE SELLING PRICE TREND OF PREIMPLANTATION GENETIC TESTING PRODUCTS, BY PROCEDURE TYPE, 2022−2024
5.4.4
AVERAGE SELLING PRICE TREND OF PREIMPLANTATION GENETIC TESTING INSTRUMENTS AND CONSUMABLES, BY REGION, 2022–2024
5.5.1
IMPORT DATA FOR HS CODE 3822, 2020–2024
5.5.2
EXPORT DATA FOR HS CODE 3822, 2020–2024
5.5.3
IMPORT DATA FOR HS CODE 9018, 2020–2024
5.5.4
EXPORT DATA FOR HS CODE 9018, 2020–2024
5.8
PORTER’S FIVE FORCES ANALYSIS
5.8.1
INTENSITY OF COMPETITIVE RIVALRY
5.8.2
BARGAINING POWER OF SUPPLIERS
5.8.3
BARGAINING POWER OF BUYERS
5.8.4
THREAT OF SUBSTITUTES
5.8.5
THREAT OF NEW ENTRANTS
5.9
KEY CONFERENCES & EVENTS, 2025–2026
5.10
INVESTMENT & FUNDING SCENARIO
5.11
IMPACT OF 2025 US TARIFF ON PREIMPLANTATION GENETIC TESTING MARKET
5.11.2
PRICE IMPACT ANALYSIS
5.11.3
KEY IMPACTS ON VARIOUS REGIONS
5.11.4
END-USE INDUSTRY IMPACT
5.11.4.1
FERTILITY CLINICS
5.11.4.3
DIAGNOSTIC LABORATORIES
6
TECHNOLOGICAL ADVANCEMENTS, AI-DRIVEN IMPACT, PATENTS, INNOVATIONS, AND FUTURE APPLICATIONS
AI-driven innovations redefine genetic testing with cutting-edge patents and future-ready applications.
87
6.1.1.1
LASER-ASSISTED TE BIOPSY
6.1.1.2
WHOLE GENOME AMPLIFICATION
6.1.2
COMPLEMENTARY TECHNOLOGIES
6.1.2.1
MICROMANIPULATION
6.3.2
NUMBER OF PATENTS FILED, BY DOCUMENT TYPE
6.3.3
LIST OF KEY PATENTS
6.5
IMPACT OF AI/GEN AI ON PREIMPLANTATION GENETIC TESTING MARKET
6.5.1
TOP USE CASES AND MARKET POTENTIAL
6.5.2
BEST PRACTICES IN AI-ENABLED EMBRYO SELECTION AND GENETIC SCREENING
6.5.3
CASE STUDIES OF AI IMPLEMENTATION IN PREIMPLANTATION GENETIC TESTING MARKET
6.5.4
INTERCONNECTED ADJACENT ECOSYSTEM AND IMPACT ON MARKET PLAYERS
6.5.5
CLIENTS’ READINESS TO ADOPT GENERATIVE AI IN PREIMPLANTATION GENETIC TESTING MARKET
7
SUSTAINABILITY & REGULATORY LANDSCAPE
Navigate global regulatory dynamics to enhance sustainability and compliance in diverse markets.
96
7.1
REGIONAL REGULATIONS & COMPLIANCE
7.1.1
REGULATORY BODIES, GOVERNMENT AGENCIES & OTHER ORGANIZATIONS
7.2
SUSTAINABILITY IMPACT & REGULATORY POLICY INITIATIVES
7.3
CERTIFICATIONS, LABELING, AND ECO-STANDARDS
8
CUSTOMER LANDSCAPE & BUYER BEHAVIOUR
Unlock buyer insights by understanding decision influencers, unmet needs, and critical purchasing criteria.
110
8.1
DECISION-MAKING PROCESS
8.2
BUYER STAKEHOLDERS & BUYING EVALUATION CRITERIA
8.2.1
KEY STAKEHOLDERS IN BUYING PROCESS
8.2.2
KEY BUYING CRITERIA
8.3
ADOPTION BARRIERS & INTERNAL CHALLENGES
8.4
UNMET NEEDS FROM VARIOUS END-USE INDUSTRIES
9
PREIMPLANTATION GENETIC TESTING MARKET, BY PRODUCT & SERVICE
Market Size & Growth Rate Forecast Analysis to 2030 in USD Million | 22 Data Tables
114
9.2
REAGENTS & CONSUMABLES
9.2.1
EXPANSION OF ADVANCED GENOMIC TECHNOLOGIES TO PROMOTE MARKET GROWTH
9.3.1
ONGOING TECHNOLOGICAL ADVANCEMENTS AND INCREASING FERTILITY CLINICS TO PROPEL MARKET GROWTH
9.4.1
RISING AWARENESS ABOUT DATA ANALYSIS TO DRIVE MARKET
10
PREIMPLANTATION GENETIC TESTING MARKET, BY PROCEDURE TYPE
Market Size & Growth Rate Forecast Analysis to 2030 in USD Million | 15 Data Tables
128
10.2
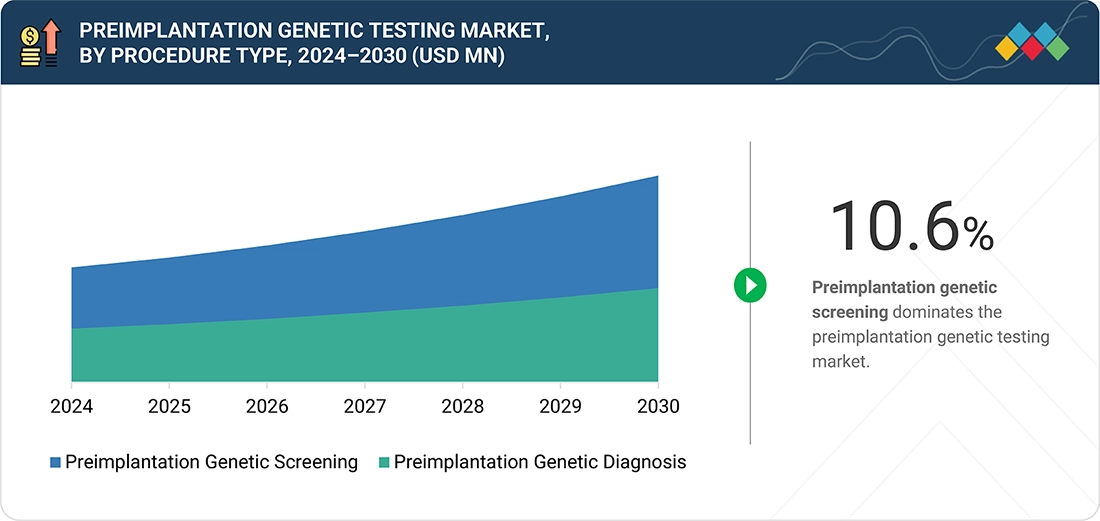
PREIMPLANTATION GENETIC SCREENING
10.2.1
INCREASING MATERNAL AGE TO AID MARKET GROWTH
10.3
PREIMPLANTATION GENETIC DIAGNOSIS
10.3.1
RISING AWARENESS ABOUT CHROMOSOMAL ABNORMALITIES IN FETUSES TO SUPPORT MARKET GROWTH
11
PREIMPLANTATION GENETIC TESTING MARKET, BY TECHNOLOGY
Market Size & Growth Rate Forecast Analysis to 2030 in USD Million | 36 Data Tables
138
11.2
NEXT-GENERATION SEQUENCING
11.2.1
IMPROVED TECHNOLOGY FOR DETECTING STRUCTURAL ABNORMALITIES TO FUEL MARKET GROWTH
11.3
POLYMERASE CHAIN REACTION
11.3.1
INCREASED USAGE IN CLINICAL AND RESEARCH APPLICATIONS AND HIGH PREVALENCE OF GENETIC DISEASES TO SUPPORT MARKET
11.4
FLUORESCENCE IN SITU HYBRIDIZATION
11.4.1
ADVANCES IN FLUORESCENCE MICROSCOPY AND DIGITAL IMAGING TO AUGMENT MARKET GROWTH
11.5
COMPARATIVE GENOMIC HYBRIDIZATION
11.5.1
LOW COST, LESS LABOR REQUIREMENT, AND ONGOING TECHNOLOGICAL ADVANCEMENTS TO DRIVE MARKET
11.6
SINGLE-NUCLEOTIDE POLYMORPHISM
11.6.1
HIGH-RESOLUTION ACCURACY AND VALIDATED CLINICAL PERFORMANCE TO BOOST MARKET GROWTH
12
PREIMPLANTATION GENETIC TESTING MARKET, BY APPLICATION
Market Size & Growth Rate Forecast Analysis to 2030 in USD Million | 72 Data Tables
160
12.2.1
HIGH ANEUPLOIDY INCIDENCE AND RAPID INNOVATION TO ACCELERATE MARKET GROWTH
12.3
STRUCTURAL CHROMOSOMAL ABNORMALITIES
12.3.1.1
RISING INCIDENCE OF TRANSLOCATION CHROMOSOMAL ABNORMALITIES DURING IVF TREATMENTS TO DRIVE SEGMENT
12.3.2.1
ADVANCEMENTS IN GENETIC TESTING TO BOOST SEGMENT GROWTH
12.3.3.1
RISING CASES OF DUPLICATION OF CHROMOSOMAL ABNORMALITIES AND INCREASING MATERNAL AGE TO DRIVE SEGMENT
12.3.4.1
RISK OF UNEXPLAINED MALE-FACTOR INFERTILITY AND MULTIPLE MISCARRIAGES TO LIMIT SEGMENT GROWTH
12.4
SINGLE GENE DISORDERS
12.4.1
INCREASING AWARENESS ABOUT GENETIC TESTING TO PROPEL MARKET GROWTH
12.5.1
MEDICAL ADVANCEMENTS AND INCREASED RESEARCH ON GENETIC DISORDERS TO AUGMENT MARKET GROWTH
12.6.1
RISING NUMBER OF COUPLES WITH CHILDREN AFFECTED BY HEMATOLOGICAL DISEASES TO DRIVE MARKET
12.7
GENDER IDENTIFICATION
12.7.1
INCREASED FOCUS ON SEX DISCRIMINATION TO LIMIT MARKET GROWTH
13
PREIMPLANTATION GENETIC TESTING MARKET, BY TYPE OF CYCLE
Market Size & Growth Rate Forecast Analysis to 2030 in USD Million | 29 Data Tables
202
13.2.1
HIGH RATES OF SUCCESSFUL PREGNANCY AMONG YOUNG WOMEN TO DRIVE MARKET GROWTH
13.3.1
LONG-TERM STORAGE OF FROZEN EGGS AND EASY SCHEDULING TO PROPEL MARKET GROWTH
13.4.1
HIGH-QUALITY FRESH DONOR OOCYTES AND EXPANDING PGT-DRIVEN RISK REDUCTION TO PROMOTE MARKET GROWTH
13.5.1
RISING USE OF ADVANCED AND NON-INVASIVE PGT TECHNOLOGIES TO AID MARKET GROWTH
14
PREIMPLANTATION GENETIC TESTING MARKET, BY END USER
Market Size & Growth Rate Forecast Analysis to 2030 in USD Million | 29 Data Tables
220
14.2.1
HIGH SUCCESS RATE OF FERTILITY TREATMENT TO DRIVE MARKET
14.3
DIAGNOSTIC LABORATORIES
14.3.1
IMPROVED CLINICAL EFFICACY AND INCREASED RESEARCH FUNDING TO FUEL MARKET
14.4.1
RISING NUMBER OF HOSPITALS AND INCREASING HEALTHCARE AWARENESS TO DRIVE GROWTH
15
PREIMPLANTATION GENETIC TESTING MARKET, BY REGION
Comprehensive coverage of 7 Regions with country-level deep-dive of 16 Countries | 204 Data Tables.
238
15.2.1.1
US TO DOMINATE NORTH AMERICAN PREIMPLANTATION GENETIC TESTING MARKET DURING FORECAST PERIOD
15.2.2.1
WHOLE-GENOME EMBRYO TESTING AND PUBLIC-PRIVATE R&D INVESTMENT TO PROPEL MARKET GROWTH
15.3.1.1
GLOBAL CLINICAL ADOPTION OF PRECISION MEDICINES TO BOOST MARKET GROWTH
15.3.2.1
DEMOGRAPHIC PRESSURES AND EVIDENCE-BASED CLINICAL INNOVATION TO SUPPORT MARKET GROWTH
15.3.3.1
ETHICAL REGULATION AND ADOPTION OF PATIENT-CENTERED PRECISION MEDICINES TO FUEL MARKET GROWTH
15.3.4.1
REGULATORY REFORMS AND CLINICAL-GENETIC PARTNERSHIPS TO BOOST MARKET GROWTH
15.3.5.1
WELL-ESTABLISHED NETWORK OF RESEARCH CENTERS AND UNIVERSITIES TO AUGMENT MARKET GROWTH
15.4.1.1
ADVANCING NEXT-GENERATION GENOMIC INFRASTRUCTURE AND CROSS-BORDER FERTILITY CAPACITY TO PROPEL MARKET GROWTH
15.4.2.1
REINFORCING GLOBAL PGT STANDARDS AND RIGOROUS CLINICAL GOVERNANCE TO FAVOR MARKET GROWTH
15.4.3.1
EXPANDING GENETIC-DIAGNOSTIC ACCESS TO DRIVE MARKET GROWTH
15.4.4.1
STANDARDIZED REGULATION AND EXPANDING CLINICAL ADOPTION TO FUEL MARKET GROWTH
15.4.5.1
CLINICALLY VALIDATED PGT-A INTEGRATION AND IMPROVED IVF OUTCOMES TO SUPPORT MARKET GROWTH
15.4.6
REST OF ASIA PACIFIC
15.5.1.1
GLOBAL GENOMIC INNOVATION AND REGULATORY MODERNIZATION TO BOOST MARKET GROWTH
15.5.2.1
ADOPTION OF ADVANCED NGS-BASED PGT SERVICES TO SUPPORT GROWTH
15.5.3
REST OF LATIN AMERICA
15.6.1.1
KINGDOM OF SAUDI ARABIA
15.6.1.1.1
RISING GLOBAL EMPHASIS ON PREVENTIVE GENOMIC MEDICINE AND ADVANCED EMBRYO-SCREENING TECHNOLOGIES TO DRIVE MARKET
15.6.1.2.1
RISING GLOBAL DEMAND FOR SAFER AND TECHNOLOGICALLY ADVANCED EMBRYO SCREENING TO AID MARKET GROWTH
15.6.1.3
REST OF GCC COUNTRIES
15.6.2
REST OF MIDDLE EAST
15.7.1
REGIONAL ART REGISTRY EXPANSION AND RISING IVF INFRASTRUCTURE TO PROPEL MARKET GROWTH
16
COMPETITIVE LANDSCAPE
Discover market leaders and emerging challengers shaping the preimplantation genetic testing landscape.
354
16.2
OVERVIEW OF STRATEGIES ADOPTED BY KEY PLAYERS IN PREIMPLANTATION GENETIC TESTING MARKET
16.3
REVENUE ANALYSIS, 2020–2024
16.4
MARKET SHARE ANALYSIS, 2024
16.5
COMPANY VALUATION & FINANCIAL METRICS
16.6
BRAND/PRODUCT COMPARISON
16.6.2
THERMO FISHER SCIENTIFIC INC.
16.6.3
AGILENT TECHNOLOGIES, INC.
16.7
COMPANY EVALUATION MATRIX: KEY PLAYERS, 2024
16.7.5
COMPANY FOOTPRINT: KEY PLAYERS, 2024
16.7.5.1
COMPANY FOOTPRINT
16.7.5.2
REGION FOOTPRINT
16.7.5.3
PRODUCT & SERVICE FOOTPRINT
16.7.5.4
TECHNOLOGY FOOTPRINT
16.7.5.5
APPLICATION FOOTPRINT
16.8
COMPANY EVALUATION MATRIX: STARTUPS/SMES, 2024
16.8.1
PROGRESSIVE COMPANIES
16.8.2
RESPONSIVE COMPANIES
16.8.5
COMPETITIVE BENCHMARKING
16.8.5.1
DETAILED LIST OF KEY STARTUPS/SMES
16.8.5.2
COMPETITIVE BENCHMARKING OF KEY STARTUPS/SMES
16.9
COMPETITIVE SCENARIO
17
COMPANY PROFILES
In-depth Company Profiles of Leading Market Players with detailed Business Overview, Product and Service Portfolio, Recent Developments, and Unique Analyst Perspective (MnM View)
373
17.1.1.1
BUSINESS OVERVIEW
17.1.1.2
PRODUCTS/SERVICES/SOLUTIONS OFFERED
17.1.1.3
RECENT DEVELOPMENTS
17.1.1.4.2
STRATEGIC CHOICES
17.1.1.4.3
WEAKNESSES & COMPETITIVE THREATS
17.1.2
THERMO FISHER SCIENTIFIC INC.
17.1.3
AGILENT TECHNOLOGIES, INC.
17.1.10
OXFORD NANOPORE TECHNOLOGIES PLC
17.2.1
OXFORD GENE TECHNOLOGY IP LIMITED
17.2.4
NANJING SUPERYEARS GENE TECHNOLOGY CO., LTD.
17.2.5
MEDICOVER GENETICS
17.2.8
INVICTA SP. Z O.O.
17.2.10
SCIGENE CORPORATION
17.2.12
UNIMED BIOTECH (SHANGHAI) CO., LTD.
17.2.13
GENEMIND BIOSCIENCES CO., LTD.
17.2.15
BANGKOK GENOMICS INNOVATION
18.2
KNOWLEDGESTORE: MARKETSANDMARKETS’ SUBSCRIPTION PORTAL
18.3
CUSTOMIZATION OPTIONS
TABLE 1
PREIMPLANTATION GENETIC TESTING MARKET: INCLUSIONS & EXCLUSIONS
TABLE 2
PREIMPLANTATION GENETIC TESTING MARKET: IMPACT ANALYSIS OF MARKET DYNAMICS
TABLE 3
AVERAGE SELLING PRICE TREND OF PREIMPLANTATION GENETIC TESTING PRODUCTS, BY END USER, 2022−2024 (USD)
TABLE 4
AVERAGE SELLING PRICE TREND OF PREIMPLANTATION GENETIC TESTING PRODUCTS, BY KEY PLAYER, 2022–2024 (USD)
TABLE 5
AVERAGE SELLING PRICE TREND OF PREIMPLANTATION GENETIC TESTING PRODUCTS, BY PROCEDURE TYPE, 2022−2024 (USD)
TABLE 6
AVERAGE SELLING PRICE TREND OF PREIMPLANTATION GENETIC TESTING INSTRUMENTS, BY REGION, 2022–2024 (USD MILLION)
TABLE 7
AVERAGE SELLING PRICE MEAN TREND OF PREIMPLANTATION GENETIC TESTING CONSUMABLES, BY REGION, 2022–2024 (USD)
TABLE 8
IMPORT DATA FOR HS CODE 3822, BY COUNTRY, 2020–2024 (USD THOUSAND)
TABLE 9
EXPORT DATA FOR HS CODE 3822, BY COUNTRY, 2020–2024 (USD THOUSAND)
TABLE 10
IMPORT DATA FOR HS CODE 9018, BY COUNTRY, 2020–2024 (USD THOUSAND)
TABLE 11
EXPORT DATA FOR HS CODE 9018, BY COUNTRY, 2020–2024 (USD THOUSAND)
TABLE 12
PREIMPLANTATION GENETIC TESTING MARKET: ROLE IN ECOSYSTEM
TABLE 13
PREIMPLANTATION GENETIC TESTING MARKET: PORTER’S FIVE FORCES
TABLE 14
KEY CONFERENCES & EVENTS IN PREIMPLANTATION GENETIC TESTING MARKET: JANUARY 2025–DECEMBER 2026
TABLE 15
US-ADJUSTED RECIPROCAL TARIFF RATES
TABLE 16
NUMBER OF EXPORTS AND IMPORTS, BY REGION, 2024–2025 (USD MILLION)
TABLE 17
KEY PRODUCT-RELATED TARIFF: HS CODES FOR PRODUCTS RELEVANT TO PREIMPLANTATION GENETIC TESTING
TABLE 18
CRITICAL COMPONENTS LIKELY EXPOSED TO TARIFF CHANGES
TABLE 19
NUMBER OF PATENTS FILED, BY DOCUMENT TYPE, 2014–2024
TABLE 20
LIST OF KEY PATENTS IN PREIMPLANTATION GENETIC TESTING MARKET, 2023–2025
TABLE 21
KEY PLAYERS IMPLEMENTING AI/GEN AI IN PREIMPLANTATION GENETIC TESTING MARKET
TABLE 22
NORTH AMERICA: REGULATORY BODIES, GOVERNMENT AGENCIES, AND OTHER ORGANIZATIONS
TABLE 23
EUROPE: REGULATORY BODIES, GOVERNMENT AGENCIES, AND OTHER ORGANIZATIONS
TABLE 24
ASIA PACIFIC: REGULATORY BODIES, GOVERNMENT AGENCIES, AND OTHER ORGANIZATIONS
TABLE 25
REST OF THE WORLD: REGULATORY BODIES, GOVERNMENT AGENCIES, AND OTHER ORGANIZATIONS
TABLE 26
US: CLASSIFICATION OF IN VITRO DIAGNOSTIC DEVICES
TABLE 27
EUROPE: CLASSIFICATION OF IN VITRO DIAGNOSTIC DEVICES
TABLE 28
JAPAN: CLASSIFICATION OF IN VITRO DIAGNOSTIC REAGENTS
TABLE 29
JAPAN: TIME, COST, AND COMPLEXITY OF REGISTRATION PROCESS
TABLE 30
CHINA: TIME, COST, AND COMPLEXITY OF REGISTRATION PROCESS
TABLE 31
VENDOR CERTIFICATIONS: PREIMPLANTATION GENETIC TESTING MARKET
TABLE 32
INFLUENCE OF KEY STAKEHOLDERS ON BUYING PROCESS, BY PRODUCT & SERVICE
TABLE 33
KEY BUYING CRITERIA FOR MAJOR END USERS
TABLE 34
PREIMPLANTATION GENETIC TESTING MARKET, BY PRODUCT & SERVICE, 2023–2030 (USD MILLION)
TABLE 35
PREIMPLANTATION GENETIC TESTING REAGENTS & CONSUMABLES MARKET, BY REGION, 2023–2030 (USD MILLION)
TABLE 36
NORTH AMERICA: PREIMPLANTATION GENETIC TESTING REAGENTS & CONSUMABLES MARKET, BY COUNTRY, 2023–2030 (USD MILLION)
TABLE 37
EUROPE: PREIMPLANTATION GENETIC TESTING REAGENTS & CONSUMABLES MARKET, BY COUNTRY, 2023–2030 (USD MILLION)
TABLE 38
ASIA PACIFIC: PREIMPLANTATION GENETIC TESTING REAGENTS & CONSUMABLES MARKET, BY COUNTRY, 2023–2030 (USD MILLION)
TABLE 39
LATIN AMERICA: PREIMPLANTATION GENETIC TESTING REAGENTS & CONSUMABLES MARKET, BY COUNTRY, 2023–2030 (USD MILLION)
TABLE 40
MIDDLE EAST: PREIMPLANTATION GENETIC TESTING REAGENTS & CONSUMABLES MARKET, BY REGION, 2023–2030 (USD MILLION)
TABLE 41
GCC COUNTRIES: PREIMPLANTATION GENETIC TESTING REAGENTS & CONSUMABLES MARKET, BY COUNTRY, 2023–2030 (USD MILLION)
TABLE 42
PREIMPLANTATION GENETIC TESTING INSTRUMENTS MARKET, BY REGION, 2023–2030 (USD MILLION)
TABLE 43
NORTH AMERICA: PREIMPLANTATION GENETIC TESTING INSTRUMENTS MARKET, BY COUNTRY, 2023–2030 (USD MILLION)
TABLE 44
EUROPE: PREIMPLANTATION GENETIC TESTING INSTRUMENTS MARKET, BY COUNTRY, 2023–2030 (USD MILLION)
TABLE 45
ASIA PACIFIC: PREIMPLANTATION GENETIC TESTING INSTRUMENTS MARKET, BY COUNTRY, 2023–2030 (USD MILLION)
TABLE 46
LATIN AMERICA: PREIMPLANTATION GENETIC TESTING INSTRUMENTS MARKET, BY COUNTRY, 2023–2030 (USD MILLION)
TABLE 47
MIDDLE EAST: PREIMPLANTATION GENETIC TESTING INSTRUMENTS MARKET, BY REGION, 2023–2030 (USD MILLION)
TABLE 48
GCC COUNTRIES: PREIMPLANTATION GENETIC TESTING INSTRUMENTS MARKET, BY COUNTRY, 2023–2030 (USD MILLION)
TABLE 49
PREIMPLANTATION GENETIC TESTING SOFTWARE & SERVICES MARKET, BY REGION, 2023–2030 (USD MILLION)
TABLE 50
NORTH AMERICA: PREIMPLANTATION GENETIC TESTING SOFTWARE & SERVICES MARKET, BY COUNTRY, 2023–2030 (USD MILLION)
TABLE 51
EUROPE: PREIMPLANTATION GENETIC TESTING SOFTWARE & SERVICES MARKET, BY COUNTRY, 2023–2030 (USD MILLION)
TABLE 52
ASIA PACIFIC: PREIMPLANTATION GENETIC TESTING SOFTWARE & SERVICES MARKET, BY COUNTRY, 2023–2030 (USD MILLION)
TABLE 53
LATIN AMERICA: PREIMPLANTATION GENETIC TESTING SOFTWARE & SERVICES MARKET, BY COUNTRY, 2023–2030 (USD MILLION)
TABLE 54
MIDDLE EAST: PREIMPLANTATION GENETIC TESTING SOFTWARE & SERVICES MARKET, BY REGION, 2023–2030 (USD MILLION)
TABLE 55
GCC COUNTRIES: PREIMPLANTATION GENETIC TESTING SOFTWARE & SERVICES MARKET, BY COUNTRY, 2023–2030 (USD MILLION)
TABLE 56
PREIMPLANTATION GENETIC TESTING MARKET, BY PROCEDURE TYPE, 2023–2030 (USD MILLION)
TABLE 57
PREIMPLANTATION GENETIC SCREENING MARKET, BY REGION, 2023–2030 (USD MILLION)
TABLE 58
NORTH AMERICA: PREIMPLANTATION GENETIC SCREENING MARKET, BY COUNTRY, 2023–2030 (USD MILLION)
TABLE 59
EUROPE: PREIMPLANTATION GENETIC SCREENING MARKET, BY COUNTRY, 2023–2030 (USD MILLION)
TABLE 60
ASIA PACIFIC: PREIMPLANTATION GENETIC SCREENING MARKET, BY COUNTRY, 2023–2030 (USD MILLION)
TABLE 61
LATIN AMERICA: PREIMPLANTATION GENETIC SCREENING MARKET, BY COUNTRY, 2023–2030 (USD MILLION)
TABLE 62
MIDDLE EAST: PREIMPLANTATION GENETIC SCREENING MARKET, BY REGION, 2023–2030 (USD MILLION)
TABLE 63
GCC COUNTRIES: PREIMPLANTATION GENETIC SCREENING MARKET, BY COUNTRY, 2023–2030 (USD MILLION)
TABLE 64
PREIMPLANTATION GENETIC DIAGNOSIS MARKET, BY REGION, 2023–2030 (USD MILLION)
TABLE 65
NORTH AMERICA: PREIMPLANTATION GENETIC DIAGNOSIS MARKET, BY COUNTRY, 2023–2030 (USD MILLION)
TABLE 66
EUROPE: PREIMPLANTATION GENETIC DIAGNOSIS MARKET, BY COUNTRY, 2023–2030 (USD MILLION)
TABLE 67
ASIA PACIFIC: PREIMPLANTATION GENETIC DIAGNOSIS MARKET, BY COUNTRY, 2023–2030 (USD MILLION)
TABLE 68
LATIN AMERICA: PREIMPLANTATION GENETIC DIAGNOSIS MARKET, BY COUNTRY, 2023–2030 (USD MILLION)
TABLE 69
MIDDLE EAST: PREIMPLANTATION GENETIC DIAGNOSIS MARKET, BY REGION, 2023–2030 (USD MILLION)
TABLE 70
GCC COUNTRIES: PREIMPLANTATION GENETIC DIAGNOSIS MARKET, BY COUNTRY, 2023–2030 (USD MILLION)
TABLE 71
PREIMPLANTATION GENETIC TESTING MARKET, BY TECHNOLOGY, 2023–2030 (USD MILLION)
TABLE 72
PREIMPLANTATION GENETIC TESTING MARKET FOR NEXT-GENERATION SEQUENCING, BY REGION, 2023–2030 (USD MILLION)
TABLE 73
NORTH AMERICA: PREIMPLANTATION GENETIC TESTING MARKET FOR NEXT-GENERATION SEQUENCING, BY COUNTRY, 2023–2030 (USD MILLION)
TABLE 74
EUROPE: PREIMPLANTATION GENETIC TESTING MARKET FOR NEXT-GENERATION SEQUENCING, BY COUNTRY, 2023–2030 (USD MILLION)
TABLE 75
ASIA PACIFIC: PREIMPLANTATION GENETIC TESTING MARKET FOR NEXT-GENERATION SEQUENCING, BY COUNTRY, 2023–2030 (USD MILLION)
TABLE 76
LATIN AMERICA: PREIMPLANTATION GENETIC TESTING MARKET FOR NEXT-GENERATION SEQUENCING, BY COUNTRY, 2023–2030 (USD MILLION)
TABLE 77
MIDDLE EAST: PREIMPLANTATION GENETIC TESTING MARKET FOR NEXT-GENERATION SEQUENCING, BY REGION, 2023–2030 (USD MILLION)
TABLE 78
GCC COUNTRIES: PREIMPLANTATION GENETIC TESTING MARKET FOR NEXT-GENERATION SEQUENCING, BY COUNTRY, 2023–2030 (USD MILLION)
TABLE 79
PREIMPLANTATION GENETIC TESTING MARKET FOR POLYMERASE CHAIN REACTION, BY REGION, 2023–2030 (USD MILLION)
TABLE 80
NORTH AMERICA: PREIMPLANTATION GENETIC TESTING MARKET FOR POLYMERASE CHAIN REACTION, BY COUNTRY, 2023–2030 (USD MILLION)
TABLE 81
EUROPE: PREIMPLANTATION GENETIC TESTING MARKET FOR POLYMERASE CHAIN REACTION, BY COUNTRY, 2023–2030 (USD MILLION)
TABLE 82
ASIA PACIFIC: PREIMPLANTATION GENETIC TESTING MARKET FOR POLYMERASE CHAIN REACTION, BY COUNTRY, 2023–2030 (USD MILLION)
TABLE 83
LATIN AMERICA: PREIMPLANTATION GENETIC TESTING MARKET FOR POLYMERASE CHAIN REACTION, BY COUNTRY, 2023–2030 (USD MILLION)
TABLE 84
MIDDLE EAST: PREIMPLANTATION GENETIC TESTING MARKET FOR POLYMERASE CHAIN REACTION, BY REGION, 2023–2030 (USD MILLION)
TABLE 85
GCC COUNTRIES: PREIMPLANTATION GENETIC TESTING MARKET FOR POLYMERASE CHAIN REACTION, BY COUNTRY, 2023–2030 (USD MILLION)
TABLE 86
PREIMPLANTATION GENETIC TESTING MARKET FOR FLUORESCENCE IN SITU HYBRIDIZATION, BY REGION, 2023–2030 (USD MILLION)
TABLE 87
NORTH AMERICA: PREIMPLANTATION GENETIC TESTING MARKET FOR FLUORESCENCE IN SITU HYBRIDIZATION, BY COUNTRY, 2023–2030 (USD MILLION)
TABLE 88
EUROPE: PREIMPLANTATION GENETIC TESTING MARKET FOR FLUORESCENCE IN SITU HYBRIDIZATION, BY COUNTRY, 2023–2030 (USD MILLION)
TABLE 89
ASIA PACIFIC: PREIMPLANTATION GENETIC TESTING MARKET FOR FLUORESCENCE IN SITU HYBRIDIZATION, BY COUNTRY, 2023–2030 (USD MILLION)
TABLE 90
LATIN AMERICA: PREIMPLANTATION GENETIC TESTING MARKET FOR FLUORESCENCE IN SITU HYBRIDIZATION, BY COUNTRY, 2023–2030 (USD MILLION)
TABLE 91
MIDDLE EAST: PREIMPLANTATION GENETIC TESTING MARKET FOR FLUORESCENCE IN SITU HYBRIDIZATION, BY REGION, 2023–2030 (USD MILLION)
TABLE 92
GCC COUNTRIES: PREIMPLANTATION GENETIC TESTING MARKET FOR FLUORESCENCE IN SITU HYBRIDIZATION, BY COUNTRY, 2023–2030 (USD MILLION)
TABLE 93
PREIMPLANTATION GENETIC TESTING MARKET FOR COMPARATIVE GENOMIC HYBRIDIZATION, BY REGION, 2023–2030 (USD MILLION)
TABLE 94
NORTH AMERICA: PREIMPLANTATION GENETIC TESTING MARKET FOR COMPARATIVE GENOMIC HYBRIDIZATION, BY COUNTRY, 2023–2030 (USD MILLION)
TABLE 95
EUROPE: PREIMPLANTATION GENETIC TESTING MARKET FOR COMPARATIVE GENOMIC HYBRIDIZATION, BY COUNTRY, 2023–2030 (USD MILLION)
TABLE 96
ASIA PACIFIC: PREIMPLANTATION GENETIC TESTING MARKET FOR COMPARATIVE GENOMIC HYBRIDIZATION, BY COUNTRY, 2023–2030 (USD MILLION)
TABLE 97
LATIN AMERICA: PREIMPLANTATION GENETIC TESTING MARKET FOR COMPARATIVE GENOMIC HYBRIDIZATION, BY COUNTRY, 2023–2030 (USD MILLION)
TABLE 98
MIDDLE EAST: PREIMPLANTATION GENETIC TESTING MARKET FOR COMPARATIVE GENOMIC HYBRIDIZATION, BY REGION, 2023–2030 (USD MILLION)
TABLE 99
GCC COUNTRIES: PREIMPLANTATION GENETIC TESTING MARKET FOR COMPARATIVE GENOMIC HYBRIDIZATION, BY COUNTRY, 2023–2030 (USD MILLION)
TABLE 100
PREIMPLANTATION GENETIC TESTING MARKET FOR SINGLE-NUCLEOTIDE POLYMORPHISM, BY REGION, 2023–2030 (USD MILLION)
TABLE 101
NORTH AMERICA: PREIMPLANTATION GENETIC TESTING MARKET FOR SINGLE-NUCLEOTIDE POLYMORPHISM, BY COUNTRY, 2023–2030 (USD MILLION)
TABLE 102
EUROPE: PREIMPLANTATION GENETIC TESTING MARKET FOR SINGLE-NUCLEOTIDE POLYMORPHISM, BY COUNTRY, 2023–2030 (USD MILLION)
TABLE 103
ASIA PACIFIC: PREIMPLANTATION GENETIC TESTING MARKET FOR SINGLE-NUCLEOTIDE POLYMORPHISM, BY COUNTRY, 2023–2030 (USD MILLION)
TABLE 104
LATIN AMERICA: PREIMPLANTATION GENETIC TESTING MARKET FOR SINGLE-NUCLEOTIDE POLYMORPHISM, BY COUNTRY, 2023–2030 (USD MILLION)
TABLE 105
MIDDLE EAST: PREIMPLANTATION GENETIC TESTING MARKET FOR SINGLE-NUCLEOTIDE POLYMORPHISM, BY REGION, 2023–2030 (USD MILLION)
TABLE 106
GCC COUNTRIES: PREIMPLANTATION GENETIC TESTING MARKET FOR SINGLE-NUCLEOTIDE POLYMORPHISM, BY COUNTRY, 2023–2030 (USD MILLION)
TABLE 107
PREIMPLANTATION GENETIC TESTING MARKET, BY APPLICATION, 2023–2030 (USD MILLION)
TABLE 108
PREIMPLANTATION GENETIC TESTING MARKET FOR ANEUPLOIDY, BY REGION, 2023–2030 (USD MILLION)
TABLE 109
NORTH AMERICA: PREIMPLANTATION GENETIC TESTING MARKET FOR ANEUPLOIDY, BY COUNTRY, 2023–2030 (USD MILLION)
TABLE 110
EUROPE: PREIMPLANTATION GENETIC TESTING MARKET FOR ANEUPLOIDY, BY COUNTRY, 2023–2030 (USD MILLION)
TABLE 111
ASIA PACIFIC: PREIMPLANTATION GENETIC TESTING MARKET FOR ANEUPLOIDY, BY COUNTRY, 2023–2030 (USD MILLION)
TABLE 112
LATIN AMERICA: PREIMPLANTATION GENETIC TESTING MARKET FOR ANEUPLOIDY, BY COUNTRY, 2023–2030 (USD MILLION)
TABLE 113
MIDDLE EAST: PREIMPLANTATION GENETIC TESTING MARKET FOR ANEUPLOIDY, BY REGION, 2023–2030 (USD MILLION)
TABLE 114
GCC COUNTRIES: PREIMPLANTATION GENETIC TESTING MARKET FOR ANEUPLOIDY, BY COUNTRY, 2023–2030 (USD MILLION)
TABLE 115
PREIMPLANTATION GENETIC TESTING MARKET FOR STRUCTURAL CHROMOSOMAL ABNORMALITIES, BY TYPE, 2023–2030 (USD MILLION)
TABLE 116
PREIMPLANTATION GENETIC TESTING MARKET FOR STRUCTURAL CHROMOSOMAL ABNORMALITIES, BY REGION, 2023–2030 (USD MILLION)
TABLE 117
NORTH AMERICA: PREIMPLANTATION GENETIC TESTING MARKET FOR STRUCTURAL CHROMOSOMAL ABNORMALITIES, BY COUNTRY, 2023–2030 (USD MILLION)
TABLE 118
EUROPE: PREIMPLANTATION GENETIC TESTING MARKET FOR STRUCTURAL CHROMOSOMAL ABNORMALITIES, BY COUNTRY, 2023–2030 (USD MILLION)
TABLE 119
ASIA PACIFIC: PREIMPLANTATION GENETIC TESTING MARKET FOR STRUCTURAL CHROMOSOMAL ABNORMALITIES, BY COUNTRY, 2023–2030 (USD MILLION)
TABLE 120
LATIN AMERICA: PREIMPLANTATION GENETIC TESTING MARKET FOR STRUCTURAL CHROMOSOMAL ABNORMALITIES, BY COUNTRY, 2023–2030 (USD MILLION)
TABLE 121
MIDDLE EAST: PREIMPLANTATION GENETIC TESTING MARKET FOR STRUCTURAL CHROMOSOMAL ABNORMALITIES, BY COUNTRY, 2023–2030 (USD MILLION)
TABLE 122
GCC COUNTRIES: PREIMPLANTATION GENETIC TESTING MARKET FOR STRUCTURAL CHROMOSOMAL ABNORMALITIES, BY COUNTRY, 2023–2030 (USD MILLION)
TABLE 123
STRUCTURAL CHROMOSOMAL ABNORMALITIES MARKET FOR TRANSLOCATIONS, BY REGION, 2023–2030 (USD MILLION)
TABLE 124
NORTH AMERICA: STRUCTURAL CHROMOSOMAL ABNORMALITIES MARKET FOR TRANSLOCATIONS, BY COUNTRY, 2023–2030 (USD MILLION)
TABLE 125
EUROPE: STRUCTURAL CHROMOSOMAL ABNORMALITIES MARKET FOR TRANSLOCATIONS, BY COUNTRY, 2023–2030 (USD MILLION)
TABLE 126
ASIA PACIFIC: STRUCTURAL CHROMOSOMAL ABNORMALITIES MARKET FOR TRANSLOCATIONS, BY COUNTRY, 2023–2030 (USD MILLION)
TABLE 127
LATIN AMERICA: STRUCTURAL CHROMOSOMAL ABNORMALITIES MARKET FOR TRANSLOCATIONS, BY COUNTRY, 2023–2030 (USD MILLION)
TABLE 128
MIDDLE EAST: STRUCTURAL CHROMOSOMAL ABNORMALITIES MARKET FOR TRANSLOCATIONS, BY COUNTRY, 2023–2030 (USD MILLION)
TABLE 129
GCC COUNTRIES: STRUCTURAL CHROMOSOMAL ABNORMALITIES MARKET FOR TRANSLOCATIONS, BY COUNTRY, 2023–2030 (USD MILLION)
TABLE 130
STRUCTURAL CHROMOSOMAL ABNORMALITIES MARKET FOR DELETIONS, BY REGION, 2023–2030 (USD MILLION)
TABLE 131
NORTH AMERICA: STRUCTURAL CHROMOSOMAL ABNORMALITIES MARKET FOR DELETIONS, BY COUNTRY, 2023–2030 (USD MILLION)
TABLE 132
EUROPE: STRUCTURAL CHROMOSOMAL ABNORMALITIES MARKET FOR DELETIONS, BY COUNTRY, 2023–2030 (USD MILLION)
TABLE 133
ASIA PACIFIC: STRUCTURAL CHROMOSOMAL ABNORMALITIES MARKET FOR DELETIONS, BY COUNTRY, 2023–2030 (USD MILLION)
TABLE 134
LATIN AMERICA: STRUCTURAL CHROMOSOMAL ABNORMALITIES MARKET FOR DELETIONS, BY COUNTRY, 2023–2030 (USD MILLION)
TABLE 135
MIDDLE EAST: STRUCTURAL CHROMOSOMAL ABNORMALITIES MARKET FOR DELETIONS, BY COUNTRY, 2023–2030 (USD MILLION)
TABLE 136
GCC COUNTRIES: STRUCTURAL CHROMOSOMAL ABNORMALITIES MARKET FOR DELETIONS, BY COUNTRY, 2023–2030 (USD MILLION)
TABLE 137
STRUCTURAL CHROMOSOMAL ABNORMALITIES MARKET FOR DUPLICATIONS, BY REGION, 2023–2030 (USD MILLION)
TABLE 138
NORTH AMERICA: STRUCTURAL CHROMOSOMAL ABNORMALITIES MARKET FOR DUPLICATIONS, BY COUNTRY, 2023–2030 (USD MILLION)
TABLE 139
EUROPE: STRUCTURAL CHROMOSOMAL ABNORMALITIES MARKET FOR DUPLICATIONS, BY COUNTRY, 2023–2030 (USD MILLION)
TABLE 140
ASIA PACIFIC: STRUCTURAL CHROMOSOMAL ABNORMALITIES MARKET FOR DUPLICATIONS, BY COUNTRY, 2023–2030 (USD MILLION)
TABLE 141
LATIN AMERICA: STRUCTURAL CHROMOSOMAL ABNORMALITIES MARKET FOR DUPLICATIONS, BY COUNTRY, 2023–2030 (USD MILLION)
TABLE 142
MIDDLE EAST: STRUCTURAL CHROMOSOMAL ABNORMALITIES MARKET FOR DUPLICATIONS, BY COUNTRY, 2023–2030 (USD MILLION)
TABLE 143
GCC COUNTRIES: STRUCTURAL CHROMOSOMAL ABNORMALITIES MARKET FOR DUPLICATIONS, BY COUNTRY, 2023–2030 (USD MILLION)
TABLE 144
STRUCTURAL CHROMOSOMAL ABNORMALITIES MARKET FOR INVERSIONS, BY REGION, 2023–2030 (USD MILLION)
TABLE 145
NORTH AMERICA: STRUCTURAL CHROMOSOMAL ABNORMALITIES MARKET FOR INVERSIONS, BY COUNTRY, 2023–2030 (USD MILLION)
TABLE 146
EUROPE: STRUCTURAL CHROMOSOMAL ABNORMALITIES MARKET FOR INVERSIONS, BY COUNTRY, 2023–2030 (USD MILLION)
TABLE 147
ASIA PACIFIC: STRUCTURAL CHROMOSOMAL ABNORMALITIES MARKET FOR INVERSIONS, BY COUNTRY, 2023–2030 (USD MILLION)
TABLE 148
LATIN AMERICA: STRUCTURAL CHROMOSOMAL ABNORMALITIES MARKET INVERSIONS, BY COUNTRY, 2023–2030 (USD MILLION)
TABLE 149
MIDDLE EAST: STRUCTURAL CHROMOSOMAL ABNORMALITIES MARKET FOR INVERSIONS, BY COUNTRY, 2023–2030 (USD MILLION)
TABLE 150
GCC COUNTRIES: STRUCTURAL CHROMOSOMAL ABNORMALITIES MARKET FOR INVERSIONS, BY COUNTRY, 2023–2030 (USD MILLION)
TABLE 151
PREIMPLANTATION GENETIC TESTING MARKET FOR SINGLE GENE DISORDERS, BY REGION, 2023–2030 (USD MILLION)
TABLE 152
NORTH AMERICA: PREIMPLANTATION GENETIC TESTING MARKET FOR SINGLE GENE DISORDERS, BY COUNTRY, 2023–2030 (USD MILLION)
TABLE 153
EUROPE: PREIMPLANTATION GENETIC TESTING MARKET FOR SINGLE GENE DISORDERS, BY COUNTRY, 2023–2030 (USD MILLION)
TABLE 154
ASIA PACIFIC: PREIMPLANTATION GENETIC TESTING MARKET FOR SINGLE GENE DISORDERS, BY COUNTRY, 2023–2030 (USD MILLION)
TABLE 155
LATIN AMERICA: PREIMPLANTATION GENETIC TESTING MARKET FOR SINGLE GENE DISORDERS, BY COUNTRY, 2023–2030 (USD MILLION)
TABLE 156
MIDDLE EAST: PREIMPLANTATION GENETIC TESTING MARKET FOR SINGLE GENE DISORDERS, BY REGION, 2023–2030 (USD MILLION)
TABLE 157
GCC COUNTRIES: PREIMPLANTATION GENETIC TESTING MARKET FOR SINGLE GENE DISORDERS, BY COUNTRY, 2023–2030 (USD MILLION)
TABLE 158
PREIMPLANTATION GENETIC TESTING MARKET FOR X-LINKED DISORDERS, BY REGION, 2023–2030 (USD MILLION)
TABLE 159
NORTH AMERICA: PREIMPLANTATION GENETIC TESTING MARKET FOR X-LINKED DISORDERS, BY COUNTRY, 2023–2030 (USD MILLION)
TABLE 160
EUROPE: PREIMPLANTATION GENETIC TESTING MARKET FOR X-LINKED DISORDERS, BY COUNTRY, 2023–2030 (USD MILLION)
TABLE 161
ASIA PACIFIC: PREIMPLANTATION GENETIC TESTING MARKET FOR X-LINKED DISORDERS, BY COUNTRY, 2023–2030 (USD MILLION)
TABLE 162
LATIN AMERICA: PREIMPLANTATION GENETIC TESTING MARKET FOR X-LINKED DISORDERS, BY COUNTRY, 2023–2030 (USD MILLION)
TABLE 163
MIDDLE EAST: PREIMPLANTATION GENETIC TESTING MARKET FOR X-LINKED DISORDERS, BY COUNTRY, 2023–2030 (USD MILLION)
TABLE 164
GCC COUNTRIES: PREIMPLANTATION GENETIC TESTING MARKET FOR X-LINKED DISORDERS, BY COUNTRY, 2023–2030 (USD MILLION)
TABLE 165
PREIMPLANTATION GENETIC TESTING MARKET FOR HLA TYPING, BY REGION, 2023–2030 (USD MILLION)
TABLE 166
NORTH AMERICA: PREIMPLANTATION GENETIC TESTING MARKET FOR HLA TYPING, BY COUNTRY, 2023–2030 (USD MILLION)
TABLE 167
EUROPE: PREIMPLANTATION GENETIC TESTING MARKET FOR HLA TYPING, BY COUNTRY, 2023–2030 (USD MILLION)
TABLE 168
ASIA PACIFIC: PREIMPLANTATION GENETIC TESTING MARKET FOR HLA TYPING, BY COUNTRY, 2023–2030 (USD MILLION)
TABLE 169
LATIN AMERICA: PREIMPLANTATION GENETIC TESTING MARKET FOR HLA TYPING, BY COUNTRY, 2023–2030 (USD MILLION)
TABLE 170
MIDDLE EAST: PREIMPLANTATION GENETIC TESTING MARKET FOR HLA TYPING, BY COUNTRY, 2023–2030 (USD MILLION)
TABLE 171
GCC COUNTRIES: PREIMPLANTATION GENETIC TESTING MARKET FOR HLA TYPING, BY COUNTRY, 2023–2030 (USD MILLION)
TABLE 172
PREIMPLANTATION GENETIC TESTING MARKET FOR GENDER IDENTIFICATION, BY REGION, 2023–2030 (USD MILLION)
TABLE 173
NORTH AMERICA: PREIMPLANTATION GENETIC TESTING MARKET FOR GENDER IDENTIFICATION, BY COUNTRY, 2023–2030 (USD MILLION)
TABLE 174
EUROPE: PREIMPLANTATION GENETIC TESTING MARKET FOR GENDER IDENTIFICATION, BY COUNTRY, 2023–2030 (USD MILLION)
TABLE 175
ASIA PACIFIC: PREIMPLANTATION GENETIC TESTING MARKET FOR GENDER IDENTIFICATION, BY COUNTRY, 2023–2030 (USD MILLION)
TABLE 176
LATIN AMERICA: PREIMPLANTATION GENETIC TESTING MARKET FOR GENDER IDENTIFICATION, BY COUNTRY, 2023–2030 (USD MILLION)
TABLE 177
MIDDLE EAST: PREIMPLANTATION GENETIC TESTING MARKET FOR GENDER IDENTIFICATION, BY COUNTRY, 2023–2030 (USD MILLION)
TABLE 178
GCC COUNTRIES: PREIMPLANTATION GENETIC TESTING MARKET FOR GENDER IDENTIFICATION, BY COUNTRY, 2023–2030 (USD MILLION)
TABLE 179
PREIMPLANTATION GENETIC TESTING MARKET, BY TYPE OF CYCLE, 2023–2030 (USD MILLION)
TABLE 180
PREIMPLANTATION GENETIC TESTING MARKET FOR FRESH NON-DONOR, BY REGION, 2023–2030 (USD MILLION)
TABLE 181
NORTH AMERICA: PREIMPLANTATION GENETIC TESTING MARKET FOR FRESH NON-DONOR, BY COUNTRY, 2023–2030 (USD MILLION)
TABLE 182
EUROPE: PREIMPLANTATION GENETIC TESTING MARKET FOR FRESH NON-DONOR, BY COUNTRY, 2023–2030 (USD MILLION)
TABLE 183
ASIA PACIFIC: PREIMPLANTATION GENETIC TESTING MARKET FOR FRESH NON-DONOR, BY COUNTRY, 2023–2030 (USD MILLION)
TABLE 184
LATIN AMERICA: PREIMPLANTATION GENETIC TESTING MARKET FOR FRESH NON-DONOR, BY COUNTRY, 2023–2030 (USD MILLION)
TABLE 185
MIDDLE EAST: PREIMPLANTATION GENETIC TESTING MARKET FOR FRESH NON-DONOR, BY REGION, 2023–2030 (USD MILLION)
TABLE 186
GCC COUNTRIES: PREIMPLANTATION GENETIC TESTING MARKET FOR FRESH NON-DONOR, BY COUNTRY, 2023–2030 (USD MILLION)
TABLE 187
PREIMPLANTATION GENETIC TESTING MARKET FOR FROZEN NON-DONOR, BY REGION, 2023–2030 (USD MILLION)
TABLE 188
NORTH AMERICA: PREIMPLANTATION GENETIC TESTING MARKET FOR FROZEN NON-DONOR, BY COUNTRY, 2023–2030 (USD MILLION)
TABLE 189
EUROPE: PREIMPLANTATION GENETIC TESTING MARKET FOR FROZEN NON-DONOR, BY COUNTRY, 2023–2030 (USD MILLION)
TABLE 190
ASIA PACIFIC: PREIMPLANTATION GENETIC TESTING MARKET FOR FROZEN NON-DONOR, BY COUNTRY, 2023–2030 (USD MILLION)
TABLE 191
LATIN AMERICA: PREIMPLANTATION GENETIC TESTING MARKET FOR FROZEN NON-DONOR, BY COUNTRY, 2023–2030 (USD MILLION)
TABLE 192
MIDDLE EAST: PREIMPLANTATION GENETIC TESTING MARKET FOR FROZEN NON-DONOR, BY REGION, 2023–2030 (USD MILLION)
TABLE 193
GCC COUNTRIES: PREIMPLANTATION GENETIC TESTING MARKET FOR FROZEN NON-DONOR, SBY COUNTRY, 2023–2030 (USD MILLION)
TABLE 194
PREIMPLANTATION GENETIC TESTING MARKET FOR FRESH DONOR, BY REGION, 2023–2030 (USD MILLION)
TABLE 195
NORTH AMERICA: PREIMPLANTATION GENETIC TESTING MARKET FOR FRESH DONOR, BY COUNTRY, 2023–2030 (USD MILLION)
TABLE 196
EUROPE: PREIMPLANTATION GENETIC TESTING MARKET FOR FRESH DONOR, BY COUNTRY, 2023–2030 (USD MILLION)
TABLE 197
ASIA PACIFIC: PREIMPLANTATION GENETIC TESTING MARKET FOR FRESH DONOR, BY COUNTRY, 2023–2030 (USD MILLION)
TABLE 198
LATIN AMERICA: PREIMPLANTATION GENETIC TESTING MARKET FOR FRESH DONOR, BY COUNTRY, 2023–2030 (USD MILLION)
TABLE 199
MIDDLE EAST: PREIMPLANTATION GENETIC TESTING MARKET FOR FRESH DONOR, BY REGION, 2023–2030 (USD MILLION)
TABLE 200
GCC COUNTRIES: PREIMPLANTATION GENETIC TESTING MARKET FOR FRESH DONOR, BY COUNTRY, 2023–2030 (USD MILLION)
TABLE 201
PREIMPLANTATION GENETIC TESTING MARKET FOR FROZEN DONOR, BY REGION, 2023–2030 (USD MILLION)
TABLE 202
NORTH AMERICA: PREIMPLANTATION GENETIC TESTING MARKET FOR FROZEN DONOR, BY COUNTRY, 2023–2030 (USD MILLION)
TABLE 203
EUROPE: PREIMPLANTATION GENETIC TESTING MARKET FOR FROZEN DONOR, BY COUNTRY, 2023–2030 (USD MILLION)
TABLE 204
ASIA PACIFIC: PREIMPLANTATION GENETIC TESTING MARKET FOR FROZEN DONOR, BY COUNTRY, 2023–2030 (USD MILLION)
TABLE 205
LATIN AMERICA: PREIMPLANTATION GENETIC TESTING MARKET FOR FROZEN DONOR, BY COUNTRY, 2023–2030 (USD MILLION)
TABLE 206
MIDDLE EAST: PREIMPLANTATION GENETIC TESTING MARKET FOR FROZEN DONOR, BY REGION, 2023–2030 (USD MILLION)
TABLE 207
GCC COUNTRIES: PREIMPLANTATION GENETIC TESTING MARKET FOR FROZEN DONOR, BY COUNTRY, 2023–2030 (USD MILLION)
TABLE 208
PREIMPLANTATION GENETIC TESTING MARKET, BY END USER, 2023–2030 (USD MILLION)
TABLE 209
PREIMPLANTATION GENETIC TESTING MARKET FOR FERTILITY CLINICS, BY REGION, 2023–2030 (USD MILLION)
TABLE 210
NORTH AMERICA: PREIMPLANTATION GENETIC TESTING MARKET FOR FERTILITY CLINICS, BY COUNTRY, 2023–2030 (USD MILLION)
TABLE 211
EUROPE: PREIMPLANTATION GENETIC TESTING MARKET FOR FERTILITY CLINICS, BY COUNTRY, 2023–2030 (USD MILLION)
TABLE 212
ASIA PACIFIC: PREIMPLANTATION GENETIC TESTING MARKET FOR FERTILITY CLINICS, BY COUNTRY, 2023–2030 (USD MILLION)
TABLE 213
LATIN AMERICA: PREIMPLANTATION GENETIC TESTING MARKET FOR FERTILITY CLINICS, BY COUNTRY, 2023–2030 (USD MILLION)
TABLE 214
MIDDLE EAST: PREIMPLANTATION GENETIC TESTING MARKET FOR FERTILITY CLINICS, BY REGION, 2023–2030 (USD MILLION)
TABLE 215
GCC COUNTRIES: PREIMPLANTATION GENETIC TESTING MARKET FOR FERTILITY CLINICS, BY COUNTRY, 2023–2030 (USD MILLION)
TABLE 216
PREIMPLANTATION GENETIC TESTING MARKET FOR DIAGNOSTIC LABORATORIES, BY REGION, 2023–2030 (USD MILLION)
TABLE 217
NORTH AMERICA: PREIMPLANTATION GENETIC TESTING MARKET FOR DIAGNOSTIC LABORATORIES, BY COUNTRY, 2023–2030 (USD MILLION)
TABLE 218
EUROPE: PREIMPLANTATION GENETIC TESTING MARKET FOR DIAGNOSTIC LABORATORIES, BY COUNTRY, 2023–2030 (USD MILLION)
TABLE 219
ASIA PACIFIC: PREIMPLANTATION GENETIC TESTING MARKET FOR DIAGNOSTIC LABORATORIES, BY COUNTRY, 2023–2030 (USD MILLION)
TABLE 220
LATIN AMERICA: PREIMPLANTATION GENETIC TESTING MARKET FOR DIAGNOSTIC LABORATORIES, BY COUNTRY, 2023–2030 (USD MILLION)
TABLE 221
MIDDLE EAST: PREIMPLANTATION GENETIC TESTING MARKET FOR DIAGNOSTIC LABORATORIES, BY REGION, 2023–2030 (USD MILLION)
TABLE 222
GCC COUNTRIES: PREIMPLANTATION GENETIC TESTING MARKET FOR DIAGNOSTIC LABORATORIES, BY COUNTRY, 2023–2030 (USD MILLION)
TABLE 223
PREIMPLANTATION GENETIC TESTING MARKET FOR HOSPITALS, BY REGION, 2023–2030 (USD MILLION)
TABLE 224
NORTH AMERICA: PREIMPLANTATION GENETIC TESTING MARKET FOR HOSPITALS, BY COUNTRY, 2023–2030 (USD MILLION)
TABLE 225
EUROPE: PREIMPLANTATION GENETIC TESTING MARKET FOR HOSPITALS, BY COUNTRY, 2023–2030 (USD MILLION)
TABLE 226
ASIA PACIFIC: PREIMPLANTATION GENETIC TESTING MARKET FOR HOSPITALS, BY COUNTRY, 2023–2030 (USD MILLION)
TABLE 227
LATIN AMERICA: PREIMPLANTATION GENETIC TESTING MARKET FOR HOSPITALS, BY COUNTRY, 2023–2030 (USD MILLION)
TABLE 228
MIDDLE EAST: PREIMPLANTATION GENETIC TESTING MARKET FOR HOSPITALS, BY REGION, 2023–2030 (USD MILLION)
TABLE 229
GCC COUNTRIES: PREIMPLANTATION GENETIC TESTING MARKET FOR HOSPITALS, BY COUNTRY, 2023–2030 (USD MILLION)
TABLE 230
PREIMPLANTATION GENETIC TESTING MARKET FOR OTHER END USERS, BY REGION, 2023–2030 (USD MILLION)
TABLE 231
NORTH AMERICA: PREIMPLANTATION GENETIC TESTING MARKET FOR OTHER END USERS, BY COUNTRY, 2023–2030 (USD MILLION)
TABLE 232
EUROPE: PREIMPLANTATION GENETIC TESTING MARKET FOR OTHER END USERS, BY COUNTRY, 2023–2030 (USD MILLION)
TABLE 233
ASIA PACIFIC: PREIMPLANTATION GENETIC TESTING MARKET FOR OTHER END USERS, BY COUNTRY, 2023–2030 (USD MILLION)
TABLE 234
LATIN AMERICA: PREIMPLANTATION GENETIC TESTING MARKET FOR OTHER END USERS, BY COUNTRY, 2023–2030 (USD MILLION)
TABLE 235
MIDDLE EAST: PREIMPLANTATION GENETIC TESTING MARKET FOR OTHER END USERS, BY REGION, 2023–2030 (USD MILLION)
TABLE 236
GCC COUNTRIES: PREIMPLANTATION GENETIC TESTING MARKET FOR OTHER END USERS, BY COUNTRY, 2023–2030 (USD MILLION)
TABLE 237
PREIMPLANTATION GENETIC TESTING MARKET, BY REGION, 2023–2030 (USD MILLION)
TABLE 238
NORTH AMERICA: PREIMPLANTATION GENETIC TESTING MARKET, BY COUNTRY, 2023–2030 (USD MILLION)
TABLE 239
NORTH AMERICA: PREIMPLANTATION GENETIC TESTING MARKET, BY PRODUCT & SERVICE, 2023–2030 (USD MILLION)
TABLE 240
NORTH AMERICA: PREIMPLANTATION GENETIC TESTING MARKET, BY PROCEDURE TYPE, 2023–2030 (USD MILLION)
TABLE 241
NORTH AMERICA: PREIMPLANTATION GENETIC TESTING MARKET, BY TECHNOLOGY, 2023–2030 (USD MILLION)
TABLE 242
NORTH AMERICA: PREIMPLANTATION GENETIC TESTING MARKET, BY APPLICATION, 2023–2030 (USD MILLION)
TABLE 243
NORTH AMERICA: PREIMPLANTATION GENETIC TESTING MARKET FOR STRUCTURAL CHROMOSOMAL ABNORMALITIES, BY TYPE, 2023–2030 (USD MILLION)
TABLE 244
NORTH AMERICA: PREIMPLANTATION GENETIC TESTING MARKET, BY TYPE OF CYCLE, 2023–2030 (USD MILLION)
TABLE 245
NORTH AMERICA: PREIMPLANTATION GENETIC TESTING MARKET, BY END USER, 2023–2030 (USD MILLION)
TABLE 246
US: PREIMPLANTATION GENETIC TESTING MARKET, BY PRODUCT & SERVICE, 2023–2030 (USD MILLION)
TABLE 247
US: PREIMPLANTATION GENETIC TESTING MARKET, BY PROCEDURE TYPE, 2023–2030 (USD MILLION)
TABLE 248
US: PREIMPLANTATION GENETIC TESTING MARKET, BY TECHNOLOGY, 2023–2030 (USD MILLION)
TABLE 249
US: PREIMPLANTATION GENETIC TESTING MARKET, BY APPLICATION, 2023–2030 (USD MILLION)
TABLE 250
US: PREIMPLANTATION GENETIC TESTING MARKET FOR STRUCTURAL CHROMOSOMAL ABNORMALITIES, BY TYPE, 2023–2030 (USD MILLION)
TABLE 251
US: PREIMPLANTATION GENETIC TESTING MARKET, BY TYPE OF CYCLE, 2023–2030 (USD MILLION)
TABLE 252
US: PREIMPLANTATION GENETIC TESTING MARKET, BY END USER, 2023–2030 (USD MILLION)
TABLE 253
CANADA: PREIMPLANTATION GENETIC TESTING MARKET, BY PRODUCT & SERVICE, 2023–2030 (USD MILLION)
TABLE 254
CANADA: PREIMPLANTATION GENETIC TESTING MARKET, BY PROCEDURE TYPE, 2023–2030 (USD MILLION)
TABLE 255
CANADA: PREIMPLANTATION GENETIC TESTING MARKET, BY TECHNOLOGY, 2023–2030 (USD MILLION)
TABLE 256
CANADA: PREIMPLANTATION GENETIC TESTING MARKET, BY APPLICATION, 2023–2030 (USD MILLION)
TABLE 257
CANADA: PREIMPLANTATION GENETIC TESTING MARKET FOR STRUCTURAL CHROMOSOMAL ABNORMALITIES, BY TYPE, 2023–2030 (USD MILLION)
TABLE 258
CANADA: PREIMPLANTATION GENETIC TESTING MARKET, BY TYPE OF CYCLE, 2023–2030 (USD MILLION)
TABLE 259
CANADA: PREIMPLANTATION GENETIC TESTING MARKET, BY END USER, 2023–2030 (USD MILLION)
TABLE 260
EUROPE: PREIMPLANTATION GENETIC TESTING MARKET, BY COUNTRY, 2023–2030 (USD MILLION)
TABLE 261
EUROPE: PREIMPLANTATION GENETIC TESTING MARKET, BY PRODUCT & SERVICE, 2023–2030 (USD MILLION)
TABLE 262
EUROPE: PREIMPLANTATION GENETIC TESTING MARKET, BY PROCEDURE TYPE, 2023–2030 (USD MILLION)
TABLE 263
EUROPE: PREIMPLANTATION GENETIC TESTING MARKET, BY TECHNOLOGY, 2023–2030 (USD MILLION)
TABLE 264
EUROPE: PREIMPLANTATION GENETIC TESTING MARKET, BY APPLICATION, 2023–2030 (USD MILLION)
TABLE 265
EUROPE: PREIMPLANTATION GENETIC TESTING MARKET FOR STRUCTURAL CHROMOSOMAL ABNORMALITIES, BY TYPE, 2023–2030 (USD MILLION)
TABLE 266
EUROPE: PREIMPLANTATION GENETIC TESTING MARKET, BY TYPE OF CYCLE, 2023–2030 (USD MILLION)
TABLE 267
EUROPE: PREIMPLANTATION GENETIC TESTING MARKET, BY END USER, 2023–2030 (USD MILLION)
TABLE 268
GERMANY: PREIMPLANTATION GENETIC TESTING MARKET, BY PRODUCT & SERVICE, 2023–2030 (USD MILLION)
TABLE 269
GERMANY: PREIMPLANTATION GENETIC TESTING MARKET, BY PROCEDURE TYPE, 2023–2030 (USD MILLION)
TABLE 270
GERMANY: PREIMPLANTATION GENETIC TESTING MARKET, BY TECHNOLOGY, 2023–2030 (USD MILLION)
TABLE 271
GERMANY: PREIMPLANTATION GENETIC TESTING MARKET, BY APPLICATION, 2023–2030 (USD MILLION)
TABLE 272
GERMANY: PREIMPLANTATION GENETIC TESTING MARKET FOR STRUCTURAL CHROMOSOMAL ABNORMALITIES, BY TYPE, 2023–2030 (USD MILLION)
TABLE 273
GERMANY: PREIMPLANTATION GENETIC TESTING MARKET, BY TYPE OF CYCLE, 2023–2030 (USD MILLION)
TABLE 274
GERMANY: PREIMPLANTATION GENETIC TESTING MARKET, BY END USER, 2023–2030 (USD MILLION)
TABLE 275
UK: PREIMPLANTATION GENETIC TESTING MARKET, BY PRODUCT & SERVICE, 2023–2030 (USD MILLION)
TABLE 276
UK: PREIMPLANTATION GENETIC TESTING MARKET, BY PROCEDURE TYPE, 2023–2030 (USD MILLION)
TABLE 277
UK: PREIMPLANTATION GENETIC TESTING MARKET, BY TECHNOLOGY, 2023–2030 (USD MILLION)
TABLE 278
UK: PREIMPLANTATION GENETIC TESTING MARKET, BY APPLICATION, 2023–2030 (USD MILLION)
TABLE 279
UK: PREIMPLANTATION GENETIC TESTING MARKET FOR STRUCTURAL CHROMOSOMAL ABNORMALITIES, BY TYPE, 2023–2030 (USD MILLION)
TABLE 280
UK: PREIMPLANTATION GENETIC TESTING MARKET, BY TYPE OF CYCLE, 2023–2030 (USD MILLION)
TABLE 281
UK: PREIMPLANTATION GENETIC TESTING MARKET, BY END USER, 2023–2030 (USD MILLION)
TABLE 282
FRANCE: PREIMPLANTATION GENETIC TESTING MARKET, BY PRODUCT & SERVICE, 2023–2030 (USD MILLION)
TABLE 283
FRANCE: PREIMPLANTATION GENETIC TESTING MARKET, BY PROCEDURE TYPE, 2023–2030 (USD MILLION)
TABLE 284
FRANCE: PREIMPLANTATION GENETIC TESTING MARKET, BY TECHNOLOGY, 2023–2030 (USD MILLION)
TABLE 285
FRANCE: PREIMPLANTATION GENETIC TESTING MARKET, BY APPLICATION, 2023–2030 (USD MILLION)
TABLE 286
FRANCE: PREIMPLANTATION GENETIC TESTING MARKET FOR STRUCTURAL CHROMOSOMAL ABNORMALITIES, BY TYPE, 2023–2030 (USD MILLION)
TABLE 287
FRANCE: PREIMPLANTATION GENETIC TESTING MARKET, BY TYPE OF CYCLE, 2023–2030 (USD MILLION)
TABLE 288
FRANCE: PREIMPLANTATION GENETIC TESTING MARKET, BY END USER, 2023–2030 (USD MILLION)
TABLE 289
ITALY: PREIMPLANTATION GENETIC TESTING MARKET, BY PRODUCT & SERVICE, 2023–2030 (USD MILLION)
TABLE 290
ITALY: PREIMPLANTATION GENETIC TESTING MARKET, BY PROCEDURE TYPE, 2023–2030 (USD MILLION)
TABLE 291
ITALY: PREIMPLANTATION GENETIC TESTING MARKET, BY TECHNOLOGY, 2023–2030 (USD MILLION)
TABLE 292
ITALY: PREIMPLANTATION GENETIC TESTING MARKET, BY APPLICATION, 2023–2030 (USD MILLION)
TABLE 293
ITALY: PREIMPLANTATION GENETIC TESTING MARKET FOR STRUCTURAL CHROMOSOMAL ABNORMALITIES, BY TYPE, 2023–2030 (USD MILLION)
TABLE 294
ITALY: PREIMPLANTATION GENETIC TESTING MARKET, BY TYPE OF CYCLE, 2023–2030 (USD MILLION)
TABLE 295
ITALY: PREIMPLANTATION GENETIC TESTING MARKET, BY END USER, 2023–2030 (USD MILLION)
TABLE 296
SPAIN: PREIMPLANTATION GENETIC TESTING MARKET, BY PRODUCT & SERVICE, 2023–2030 (USD MILLION)
TABLE 297
SPAIN: PREIMPLANTATION GENETIC TESTING MARKET, BY PROCEDURE TYPE, 2023–2030 (USD MILLION)
TABLE 298
SPAIN: PREIMPLANTATION GENETIC TESTING MARKET, BY TECHNOLOGY, 2023–2030 (USD MILLION)
TABLE 299
SPAIN: PREIMPLANTATION GENETIC TESTING MARKET, BY APPLICATION, 2023–2030 (USD MILLION)
TABLE 300
SPAIN: PREIMPLANTATION GENETIC TESTING MARKET FOR STRUCTURAL CHROMOSOMAL ABNORMALITIES, BY TYPE, 2023–2030 (USD MILLION)
TABLE 301
SPAIN: PREIMPLANTATION GENETIC TESTING MARKET, BY TYPE OF CYCLE, 2023–2030 (USD MILLION)
TABLE 302
SPAIN: PREIMPLANTATION GENETIC TESTING MARKET, BY END USER, 2023–2030 (USD MILLION)
TABLE 303
REST OF EUROPE: PREIMPLANTATION GENETIC TESTING MARKET, BY PRODUCT & SERVICE, 2023–2030 (USD MILLION)
TABLE 304
REST OF EUROPE: PREIMPLANTATION GENETIC TESTING MARKET, BY PROCEDURE TYPE, 2023–2030 (USD MILLION)
TABLE 305
REST OF EUROPE: PREIMPLANTATION GENETIC TESTING MARKET, BY TECHNOLOGY, 2023–2030 (USD MILLION)
TABLE 306
REST OF EUROPE: PREIMPLANTATION GENETIC TESTING MARKET, BY APPLICATION, 2023–2030 (USD MILLION)
TABLE 307
REST OF EUROPE: PREIMPLANTATION GENETIC TESTING MARKET FOR STRUCTURAL CHROMOSOMAL ABNORMALITIES, BY TYPE, 2023–2030 (USD MILLION)
TABLE 308
REST OF EUROPE: PREIMPLANTATION GENETIC TESTING MARKET, BY TYPE OF CYCLE, 2023–2030 (USD MILLION)
TABLE 309
REST OF EUROPE: PREIMPLANTATION GENETIC TESTING MARKET, BY END USER, 2023–2030 (USD MILLION)
TABLE 310
ASIA PACIFIC: PREIMPLANTATION GENETIC TESTING MARKET, BY COUNTRY, 2023–2030 (USD MILLION)
TABLE 311
ASIA PACIFIC: PREIMPLANTATION GENETIC TESTING MARKET, BY PRODUCT & SERVICE, 2023–2030 (USD MILLION)
TABLE 312
ASIA PACIFIC: PREIMPLANTATION GENETIC TESTING MARKET, BY PROCEDURE TYPE, 2023–2030 (USD MILLION)
TABLE 313
ASIA PACIFIC: PREIMPLANTATION GENETIC TESTING MARKET, BY TECHNOLOGY, 2023–2030 (USD MILLION)
TABLE 314
ASIA PACIFIC: PREIMPLANTATION GENETIC TESTING MARKET, BY APPLICATION, 2023–2030 (USD MILLION)
TABLE 315
ASIA PACIFIC: PREIMPLANTATION GENETIC TESTING MARKET FOR STRUCTURAL CHROMOSOMAL ABNORMALITIES, BY TYPE, 2023–2030 (USD MILLION)
TABLE 316
ASIA PACIFIC: PREIMPLANTATION GENETIC TESTING MARKET, BY TYPE OF CYCLE, 2023–2030 (USD MILLION)
TABLE 317
ASIA PACIFIC: PREIMPLANTATION GENETIC TESTING MARKET, BY END USER, 2023–2030 (USD MILLION)
TABLE 318
CHINA: PREIMPLANTATION GENETIC TESTING MARKET, BY PRODUCT & SERVICE, 2023–2030 (USD MILLION)
TABLE 319
CHINA: PREIMPLANTATION GENETIC TESTING MARKET, BY PROCEDURE TYPE, 2023–2030 (USD MILLION)
TABLE 320
CHINA: PREIMPLANTATION GENETIC TESTING MARKET, BY TECHNOLOGY, 2023–2030 (USD MILLION)
TABLE 321
CHINA: PREIMPLANTATION GENETIC TESTING MARKET, BY APPLICATION, 2023–2030 (USD MILLION)
TABLE 322
CHINA: PREIMPLANTATION GENETIC TESTING MARKET FOR STRUCTURAL CHROMOSOMAL ABNORMALITIES, BY TYPE, 2023–2030 (USD MILLION)
TABLE 323
CHINA: PREIMPLANTATION GENETIC TESTING MARKET, BY TYPE OF CYCLE, 2023–2030 (USD MILLION)
TABLE 324
CHINA: PREIMPLANTATION GENETIC TESTING MARKET, BY END USER, 2023–2030 (USD MILLION)
TABLE 325
JAPAN: PREIMPLANTATION GENETIC TESTING MARKET, BY PRODUCT & SERVICE, 2023–2030 (USD MILLION)
TABLE 326
JAPAN: PREIMPLANTATION GENETIC TESTING MARKET, BY PROCEDURE TYPE, 2023–2030 (USD MILLION)
TABLE 327
JAPAN: PREIMPLANTATION GENETIC TESTING MARKET, BY TECHNOLOGY, 2023–2030 (USD MILLION)
TABLE 328
JAPAN: PREIMPLANTATION GENETIC TESTING MARKET, BY APPLICATION, 2023–2030 (USD MILLION)
TABLE 329
JAPAN: PREIMPLANTATION GENETIC TESTING MARKET FOR STRUCTURAL CHROMOSOMAL ABNORMALITIES, BY TYPE, 2023–2030 (USD MILLION)
TABLE 330
JAPAN: PREIMPLANTATION GENETIC TESTING MARKET, BY TYPE OF CYCLE, 2023–2030 (USD MILLION)
TABLE 331
JAPAN: PREIMPLANTATION GENETIC TESTING MARKET, BY END USER, 2023–2030 (USD MILLION)
TABLE 332
INDIA: PREIMPLANTATION GENETIC TESTING MARKET, BY PRODUCT & SERVICE, 2023–2030 (USD MILLION)
TABLE 333
INDIA: PREIMPLANTATION GENETIC TESTING MARKET, BY PROCEDURE TYPE, 2023–2030 (USD MILLION)
TABLE 334
INDIA: PREIMPLANTATION GENETIC TESTING MARKET, BY TECHNOLOGY, 2023–2030 (USD MILLION)
TABLE 335
INDIA: PREIMPLANTATION GENETIC TESTING MARKET, BY APPLICATION, 2023–2030 (USD MILLION)
TABLE 336
INDIA: PREIMPLANTATION GENETIC TESTING MARKET FOR STRUCTURAL CHROMOSOMAL ABNORMALITIES, BY TYPE, 2023–2030 (USD MILLION)
TABLE 337
INDIA: PREIMPLANTATION GENETIC TESTING MARKET, BY TYPE OF CYCLE, 2023–2030 (USD MILLION)
TABLE 338
INDIA: PREIMPLANTATION GENETIC TESTING MARKET, BY END USER, 2023–2030 (USD MILLION)
TABLE 339
AUSTRALIA: PREIMPLANTATION GENETIC TESTING MARKET, BY PRODUCT & SERVICE, 2023–2030 (USD MILLION)
TABLE 340
AUSTRALIA: PREIMPLANTATION GENETIC TESTING MARKET, BY PROCEDURE TYPE, 2023–2030 (USD MILLION)
TABLE 341
AUSTRALIA: PREIMPLANTATION GENETIC TESTING MARKET, BY TECHNOLOGY, 2023–2030 (USD MILLION)
TABLE 342
AUSTRALIA: PREIMPLANTATION GENETIC TESTING MARKET, BY APPLICATION, 2023–2030 (USD MILLION)
TABLE 343
AUSTRALIA: PREIMPLANTATION GENETIC TESTING MARKET FOR STRUCTURAL CHROMOSOMAL ABNORMALITIES, BY TYPE, 2023–2030 (USD MILLION)
TABLE 344
AUSTRALIA: PREIMPLANTATION GENETIC TESTING MARKET, BY TYPE OF CYCLE, 2023–2030 (USD MILLION)
TABLE 345
AUSTRALIA: PREIMPLANTATION GENETIC TESTING MARKET, BY END USER, 2023–2030 (USD MILLION)
TABLE 346
SOUTH KOREA: PREIMPLANTATION GENETIC TESTING MARKET, BY PRODUCT & SERVICE, 2023–2030 (USD MILLION)
TABLE 347
SOUTH KOREA: PREIMPLANTATION GENETIC TESTING MARKET, BY PROCEDURE TYPE, 2023–2030 (USD MILLION)
TABLE 348
SOUTH KOREA: PREIMPLANTATION GENETIC TESTING MARKET, BY TECHNOLOGY, 2023–2030 (USD MILLION)
TABLE 349
SOUTH KOREA: PREIMPLANTATION GENETIC TESTING MARKET, BY APPLICATION, 2023–2030 (USD MILLION)
TABLE 350
SOUTH KOREA: PREIMPLANTATION GENETIC TESTING MARKET FOR STRUCTURAL CHROMOSOMAL ABNORMALITIES, BY TYPE, 2023–2030 (USD MILLION)
TABLE 351
SOUTH KOREA: PREIMPLANTATION GENETIC TESTING MARKET, BY TYPE OF CYCLE, 2023–2030 (USD MILLION)
TABLE 352
SOUTH KOREA: PREIMPLANTATION GENETIC TESTING MARKET, BY END USER, 2023–2030 (USD MILLION)
TABLE 353
REST OF ASIA PACIFIC: PREIMPLANTATION GENETIC TESTING MARKET, BY PRODUCT & SERVICE, 2023–2030 (USD MILLION)
TABLE 354
REST OF ASIA PACIFIC: PREIMPLANTATION GENETIC TESTING MARKET, BY PROCEDURE TYPE, 2023–2030 (USD MILLION)
TABLE 355
REST OF ASIA PACIFIC: PREIMPLANTATION GENETIC TESTING MARKET, BY TECHNOLOGY, 2023–2030 (USD MILLION)
TABLE 356
REST OF ASIA PACIFIC: PREIMPLANTATION GENETIC TESTING MARKET, BY APPLICATION, 2023–2030 (USD MILLION)
TABLE 357
REST OF ASIA PACIFIC: PREIMPLANTATION GENETIC TESTING MARKET FOR STRUCTURAL CHROMOSOMAL ABNORMALITIES, BY TYPE, 2023–2030 (USD MILLION)
TABLE 358
REST OF ASIA PACIFIC: PREIMPLANTATION GENETIC TESTING MARKET, BY TYPE OF CYCLE, 2023–2030 (USD MILLION)
TABLE 359
REST OF ASIA PACIFIC: PREIMPLANTATION GENETIC TESTING MARKET, BY END USER, 2023–2030 (USD MILLION)
TABLE 360
LATIN AMERICA: PREIMPLANTATION GENETIC TESTING MARKET, BY COUNTRY, 2023–2030 (USD MILLION)
TABLE 361
LATIN AMERICA: PREIMPLANTATION GENETIC TESTING MARKET, BY PRODUCT & SERVICE, 2023–2030 (USD MILLION)
TABLE 362
LATIN AMERICA: PREIMPLANTATION GENETIC TESTING MARKET, BY PROCEDURE TYPE, 2023–2030 (USD MILLION)
TABLE 363
LATIN AMERICA: PREIMPLANTATION GENETIC TESTING MARKET, BY TECHNOLOGY, 2023–2030 (USD MILLION)
TABLE 364
LATIN AMERICA: PREIMPLANTATION GENETIC TESTING MARKET, BY APPLICATION, 2023–2030 (USD MILLION)
TABLE 365
LATIN AMERICA: PREIMPLANTATION GENETIC TESTING MARKET FOR STRUCTURAL CHROMOSOMAL ABNORMALITIES, BY TYPE, 2023–2030 (USD MILLION)
TABLE 366
LATIN AMERICA: PREIMPLANTATION GENETIC TESTING MARKET, BY TYPE OF CYCLE, 2023–2030 (USD MILLION)
TABLE 367
LATIN AMERICA: PREIMPLANTATION GENETIC TESTING MARKET, BY END USER, 2023–2030 (USD MILLION)
TABLE 368
BRAZIL: PREIMPLANTATION GENETIC TESTING MARKET, BY PRODUCT & SERVICE, 2023–2030 (USD MILLION)
TABLE 369
BRAZIL: PREIMPLANTATION GENETIC TESTING MARKET, BY PROCEDURE TYPE, 2023–2030 (USD MILLION)
TABLE 370
BRAZIL: PREIMPLANTATION GENETIC TESTING MARKET, BY TECHNOLOGY, 2023–2030 (USD MILLION)
TABLE 371
BRAZIL: PREIMPLANTATION GENETIC TESTING MARKET, BY APPLICATION, 2023–2030 (USD MILLION)
TABLE 372
BRAZIL: PREIMPLANTATION GENETIC TESTING MARKET FOR STRUCTURAL CHROMOSOMAL ABNORMALITIES, BY TYPE, 2023–2030 (USD MILLION)
TABLE 373
BRAZIL: PREIMPLANTATION GENETIC TESTING MARKET, BY TYPE OF CYCLE, 2023–2030 (USD MILLION)
TABLE 374
BRAZIL: PREIMPLANTATION GENETIC TESTING MARKET, BY END USER, 2023–2030 (USD MILLION)
TABLE 375
MEXICO: PREIMPLANTATION GENETIC TESTING MARKET, BY PRODUCT & SERVICE, 2023–2030 (USD MILLION)
TABLE 376
MEXICO: PREIMPLANTATION GENETIC TESTING MARKET, BY PROCEDURE TYPE, 2023–2030 (USD MILLION)
TABLE 377
MEXICO: PREIMPLANTATION GENETIC TESTING MARKET, BY TECHNOLOGY, 2023–2030 (USD MILLION)
TABLE 378
MEXICO: PREIMPLANTATION GENETIC TESTING MARKET, BY APPLICATION, 2023–2030 (USD MILLION)
TABLE 379
MEXICO: PREIMPLANTATION GENETIC TESTING MARKET FOR STRUCTURAL CHROMOSOMAL ABNORMALITIES, BY TYPE, 2023–2030 (USD MILLION)
TABLE 380
MEXICO: PREIMPLANTATION GENETIC TESTING MARKET, BY TYPE OF CYCLE, 2023–2030 (USD MILLION)
TABLE 381
MEXICO: PREIMPLANTATION GENETIC TESTING MARKET, BY END USER, 2023–2030 (USD MILLION)
TABLE 382
REST OF LATIN AMERICA: PREIMPLANTATION GENETIC TESTING MARKET, BY PRODUCT & SERVICE, 2023–2030 (USD MILLION)
TABLE 383
REST OF LATIN AMERICA: PREIMPLANTATION GENETIC TESTING MARKET, BY PROCEDURE TYPE, 2023–2030 (USD MILLION)
TABLE 384
REST OF LATIN AMERICA: PREIMPLANTATION GENETIC TESTING MARKET, BY TECHNOLOGY, 2023–2030 (USD MILLION)
TABLE 385
REST OF LATIN AMERICA: PREIMPLANTATION GENETIC TESTING MARKET, BY APPLICATION, 2023–2030 (USD MILLION)
TABLE 386
REST OF LATIN AMERICA: PREIMPLANTATION GENETIC TESTING MARKET FOR STRUCTURAL CHROMOSOMAL ABNORMALITIES, BY TYPE, 2023–2030 (USD MILLION)
TABLE 387
REST OF LATIN AMERICA: PREIMPLANTATION GENETIC TESTING MARKET, BY TYPE OF CYCLE, 2023–2030 (USD MILLION)
TABLE 388
REST OF LATIN AMERICA: PREIMPLANTATION GENETIC TESTING MARKET, BY END USER, 2023–2030 (USD MILLION)
TABLE 389
MIDDLE EAST: KEY MACROINDICATORS
TABLE 390
MIDDLE EAST: PREIMPLANTATION GENETIC TESTING MARKET, BY REGION, 2023–2030 (USD MILLION)
TABLE 391
MIDDLE EAST: PREIMPLANTATION GENETIC TESTING MARKET, BY PRODUCT & SERVICE, 2023–2030 (USD MILLION)
TABLE 392
MIDDLE EAST: PREIMPLANTATION GENETIC TESTING MARKET, BY PROCEDURE TYPE, 2023–2030 (USD MILLION)
TABLE 393
MIDDLE EAST: PREIMPLANTATION GENETIC TESTING MARKET, BY TECHNOLOGY, 2023–2030 (USD MILLION)
TABLE 394
MIDDLE EAST: PREIMPLANTATION GENETIC TESTING MARKET, BY APPLICATION, 2023–2030 (USD MILLION)
TABLE 395
MIDDLE EAST: PREIMPLANTATION GENETIC TESTING MARKET FOR STRUCTURAL CHROMOSOMAL ABNORMALITIES, BY TYPE, 2023–2030 (USD MILLION)
TABLE 396
MIDDLE EAST: PREIMPLANTATION GENETIC TESTING MARKET, BY TYPE OF CYCLE, 2023–2030 (USD MILLION)
TABLE 397
MIDDLE EAST: PREIMPLANTATION GENETIC TESTING MARKET, BY END USER, 2023–2030 (USD MILLION)
TABLE 398
GCC COUNTRIES: PREIMPLANTATION GENETIC TESTING MARKET, BY COUNTRY, 2023–2030 (USD MILLION)
TABLE 399
GCC COUNTRIES: PREIMPLANTATION GENETIC TESTING MARKET, BY PRODUCT & SERVICE, 2023–2030 (USD MILLION)
TABLE 400
GCC COUNTRIES: PREIMPLANTATION GENETIC TESTING MARKET, BY PROCEDURE TYPE, 2023–2030 (USD MILLION)
TABLE 401
GCC COUNTRIES: PREIMPLANTATION GENETIC TESTING MARKET, BY TECHNOLOGY, 2023–2030 (USD MILLION)
TABLE 402
GCC COUNTRIES: PREIMPLANTATION GENETIC TESTING MARKET, BY APPLICATION, 2023–2030 (USD MILLION)
TABLE 403
GCC COUNTRIES: PREIMPLANTATION GENETIC TESTING MARKET FOR STRUCTURAL CHROMOSOMAL ABNORMALITIES, BY TYPE, 2023–2030 (USD MILLION)
TABLE 404
GCC COUNTRIES: PREIMPLANTATION GENETIC TESTING MARKET, BY TYPE OF CYCLE, 2023–2030 (USD MILLION)
TABLE 405
GCC COUNTRIES: PREIMPLANTATION GENETIC TESTING MARKET, BY END USER, 2023–2030 (USD MILLION)
TABLE 406
KINGDOM OF SAUDI ARABIA: PREIMPLANTATION GENETIC TESTING MARKET, BY PRODUCT & SERVICE, 2023–2030 (USD MILLION)
TABLE 407
KINGDOM OF SAUDI ARABIA: PREIMPLANTATION GENETIC TESTING MARKET, BY PROCEDURE TYPE, 2023–2030 (USD MILLION)
TABLE 408
KINGDOM OF SAUDI ARABIA: PREIMPLANTATION GENETIC TESTING MARKET, BY TECHNOLOGY, 2023–2030 (USD MILLION)
TABLE 409
KINGDOM OF SAUDI ARABIA: PREIMPLANTATION GENETIC TESTING MARKET, BY APPLICATION, 2023–2030 (USD MILLION)
TABLE 410
KINGDOM OF SAUDI ARABIA: PREIMPLANTATION GENETIC TESTING MARKET FOR STRUCTURAL CHROMOSOMAL ABNORMALITIES, BY TYPE, 2023–2030 (USD MILLION)
TABLE 411
KINGDOM OF SAUDI ARABIA: PREIMPLANTATION GENETIC TESTING MARKET, BY TYPE OF CYCLE, 2023–2030 (USD MILLION)
TABLE 412
KINGDOM OF SAUDI ARABIA: PREIMPLANTATION GENETIC TESTING MARKET, BY END USER, 2023–2030 (USD MILLION)
TABLE 413
UAE: PREIMPLANTATION GENETIC TESTING MARKET, BY PRODUCT & SERVICE, 2023–2030 (USD MILLION)
TABLE 414
UAE: PREIMPLANTATION GENETIC TESTING MARKET, BY PROCEDURE TYPE, 2023–2030 (USD MILLION)
TABLE 415
UAE: PREIMPLANTATION GENETIC TESTING MARKET, BY TECHNOLOGY, 2023–2030 (USD MILLION)
TABLE 416
UAE: PREIMPLANTATION GENETIC TESTING MARKET, BY APPLICATION, 2023–2030 (USD MILLION)
TABLE 417
UAE: PREIMPLANTATION GENETIC TESTING MARKET FOR STRUCTURAL CHROMOSOMAL ABNORMALITIES, BY TYPE, 2023–2030 (USD MILLION)
TABLE 418
UAE: PREIMPLANTATION GENETIC TESTING MARKET, BY TYPE OF CYCLE, 2023–2030 (USD MILLION)
TABLE 419
UAE: PREIMPLANTATION GENETIC TESTING MARKET, BY END USER, 2023–2030 (USD MILLION)
TABLE 420
REST OF GCC COUNTRIES: PREIMPLANTATION GENETIC TESTING MARKET, BY PRODUCT & SERVICE, 2023–2030 (USD MILLION)
TABLE 421
REST OF GCC COUNTRIES: PREIMPLANTATION GENETIC TESTING MARKET, BY PROCEDURE TYPE, 2023–2030 (USD MILLION)
TABLE 422
REST OF GCC COUNTRIES: PREIMPLANTATION GENETIC TESTING MARKET, BY TECHNOLOGY, 2023–2030 (USD MILLION)
TABLE 423
REST OF GCC COUNTRIES: PREIMPLANTATION GENETIC TESTING MARKET, BY APPLICATION, 2023–2030 (USD MILLION)
TABLE 424
REST OF GCC COUNTRIES: PREIMPLANTATION GENETIC TESTING MARKET FOR STRUCTURAL CHROMOSOMAL ABNORMALITIES, BY TYPE, 2023–2030 (USD MILLION)
TABLE 425
REST OF GCC COUNTRIES: PREIMPLANTATION GENETIC TESTING MARKET, BY TYPE OF CYCLE, 2023–2030 (USD MILLION)
TABLE 426
REST OF GCC COUNTRIES: PREIMPLANTATION GENETIC TESTING MARKET, BY END USER, 2023–2030 (USD MILLION)
TABLE 427
REST OF MIDDLE EAST: PREIMPLANTATION GENETIC TESTING MARKET, BY PRODUCT & SERVICE, 2023–2030 (USD MILLION)
TABLE 428
REST OF MIDDLE EAST: PREIMPLANTATION GENETIC TESTING MARKET, BY PROCEDURE TYPE, 2023–2030 (USD MILLION)
TABLE 429
REST OF MIDDLE EAST: PREIMPLANTATION GENETIC TESTING MARKET, BY TECHNOLOGY, 2023–2030 (USD MILLION)
TABLE 430
REST OF MIDDLE EAST: PREIMPLANTATION GENETIC TESTING MARKET, BY APPLICATION, 2023–2030 (USD MILLION)
TABLE 431
REST OF MIDDLE EAST: PREIMPLANTATION GENETIC TESTING MARKET FOR STRUCTURAL CHROMOSOMAL ABNORMALITIES, BY TYPE, 2023–2030 (USD MILLION)
TABLE 432
REST OF MIDDLE EAST: PREIMPLANTATION GENETIC TESTING MARKET, BY TYPE OF CYCLE, 2023–2030 (USD MILLION)
TABLE 433
REST OF MIDDLE EAST: PREIMPLANTATION GENETIC TESTING MARKET, BY END USER, 2023–2030 (USD MILLION)
TABLE 434
AFRICA: PREIMPLANTATION GENETIC TESTING MARKET, BY PRODUCT & SERVICE, 2023–2030 (USD MILLION)
TABLE 435
AFRICA: PREIMPLANTATION GENETIC TESTING MARKET, BY PROCEDURE TYPE, 2023–2030 (USD MILLION)
TABLE 436
AFRICA: PREIMPLANTATION GENETIC TESTING MARKET, BY TECHNOLOGY, 2023–2030 (USD MILLION)
TABLE 437
AFRICA: PREIMPLANTATION GENETIC TESTING MARKET, BY APPLICATION, 2023–2030 (USD MILLION)
TABLE 438
AFRICA: PREIMPLANTATION GENETIC TESTING MARKET FOR STRUCTURAL CHROMOSOMAL ABNORMALITIES, BY TYPE, 2023–2030 (USD MILLION)
TABLE 439
AFRICA: PREIMPLANTATION GENETIC TESTING MARKET, BY TYPE OF CYCLE, 2023–2030 (USD MILLION)
TABLE 440
AFRICA: PREIMPLANTATION GENETIC TESTING MARKET, BY END USER, 2023–2030 (USD MILLION)
TABLE 441
OVERVIEW OF STRATEGIES DEPLOYED BY KEY PLAYERS IN PREIMPLANTATION GENETIC TESTING MARKET, JANUARY 2022-OCTOBER 2025
TABLE 442
PREIMPLANTATION GENETIC TESTING MARKET: DEGREE OF COMPETITION
TABLE 443
PREIMPLANTATION GENETIC TESTING MARKET: REGION FOOTPRINT
TABLE 444
PREIMPLANTATION GENETIC TESTING MARKET: PRODUCT & SERVICE FOOTPRINT
TABLE 445
PREIMPLANTATION GENETIC TESTING MARKET: TECHNOLOGY FOOTPRINT
TABLE 446
PREIMPLANTATION GENETIC TESTING MARKET: APPLICATION FOOTPRINT
TABLE 447
PREIMPLANTATION GENETIC TESTING MARKET: DETAILED LIST OF KEY STARTUPS/SMES
TABLE 448
PREIMPLANTATION GENETIC TESTING MARKET: COMPETITIVE BENCHMARKING OF KEY STARTUPS/SMES, BY PRODUCT & SERVICE AND REGION
TABLE 449
PREIMPLANTATION GENETIC TESTING MARKET: PRODUCT LAUNCHES, JANUARY 2022–OCTOBER 2025
TABLE 450
PREIMPLANTATION GENETIC TESTING MARKET: DEALS, JANUARY 2022–OCTOBER 2025
TABLE 451
PREIMPLANTATION GENETIC TESTING MARKET: EXPANSIONS, JANUARY 2022–OCTOBER 2025
TABLE 452
ILLUMINA, INC.: COMPANY OVERVIEW
TABLE 453
ILLUMINA, INC.: PRODUCTS/SERVICES/SOLUTIONS OFFERED
TABLE 454
ILLUMINA, INC.: DEALS, JANUARY 2022–OCTOBER 2025
TABLE 455
THERMO FISHER SCIENTIFIC INC.: COMPANY OVERVIEW
TABLE 456
THERMO FISHER SCIENTIFIC INC.: PRODUCTS/SERVICES/SOLUTIONS OFFERED
TABLE 457
THERMO FISHER SCIENTIFIC INC.: PRODUCT LAUNCHES, JANUARY 2022–OCTOBER 2025
TABLE 458
AGILENT TECHNOLOGIES, INC.: COMPANY OVERVIEW
TABLE 459
AGILENT TECHNOLOGIES, INC.: PRODUCTS/SERVICES/SOLUTIONS OFFERED
TABLE 460
REVVITY: COMPANY OVERVIEW
TABLE 461
REVVITY: PRODUCTS/SERVICES/SOLUTIONS OFFERED
TABLE 462
COOPERCOMPANIES: COMPANY OVERVIEW
TABLE 463
COOPERCOMPANIES: PRODUCTS/SERVICES/SOLUTIONS OFFERED
TABLE 464
ABBOTT: COMPANY OVERVIEW
TABLE 465
ABBOTT: PRODUCTS/SERVICES/SOLUTIONS OFFERED
TABLE 466
TAKARA BIO INC.: COMPANY OVERVIEW
TABLE 467
TAKARA BIO INC.: PRODUCTS/SERVICES/SOLUTIONS OFFERED
TABLE 468
QIAGEN: COMPANY OVERVIEW
TABLE 469
QIAGEN: PRODUCTS/SERVICES/SOLUTIONS OFFERED
TABLE 470
VITROLIFE: COMPANY OVERVIEW
TABLE 471
VITROLIFE: PRODUCTS/SERVICES/SOLUTIONS OFFERED
TABLE 472
OXFORD NANOPORE TECHNOLOGIES PLC: COMPANY OVERVIEW
TABLE 473
OXFORD NANOPORE TECHNOLOGIES PLC: PRODUCTS/SERVICES/ SOLUTIONS OFFERED
TABLE 474
OXFORD NANOPORE TECHNOLOGIES PLC: EXPANSIONS, JANUARY 2022–OCTOBER 2025
TABLE 475
OXFORD GENE TEHNOLOGY IP LIMITED: COMPANY OVERVIEW
TABLE 476
YIKON GENOMICS: COMPANY OVERVIEW
TABLE 477
SHIVA SCIENTIFIC: COMPANY OVERVIEW
TABLE 478
NANJING SUPERYEARS GENE TECHNOLOGY CO., LTD.: COMPANY OVERVIEW
TABLE 479
MEDICOVER GENETICS: COMPANY OVERVIEW
TABLE 480
MEDGENOME: COMPANY OVERVIEW
TABLE 481
FULGENT GENETICS: COMPANY OVERVIEW
TABLE 482
INVICTA SP. Z O.O.: COMPANY OVERVIEW
TABLE 483
GENEA PTY LIMITED: COMPANY OVERVIEW
TABLE 484
SCIGENE CORPORATION: COMPANY OVERVIEW
TABLE 485
BIOARRAY S.L.: COMPANY OVERVIEW
TABLE 486
UNIMED BIOTECH (SHANGHAI) CO., LTD.: COMPANY OVERVIEW
TABLE 487
GENEMIND BIOSCIENCES CO., LTD.: COMPANY OVERVIEW
TABLE 488
BERRY GENOMICS: COMPANY OVERVIEW
TABLE 489
BANGKOK GENOMICS INNOVATION: COMPANY OVERVIEW
FIGURE 1
PREIMPLANTATION GENETIC TESTING MARKET SEGMENTATION & REGIONAL SCOPE
FIGURE 2
PREIMPLANTATION GENETIC TESTING MARKET: YEARS CONSIDERED
FIGURE 3
PREIMPLANTATION GENETIC TESTING MARKET, BY PRODUCT & SERVICE, 2025 VS. 2030 (USD MILLION)
FIGURE 4
PREIMPLANTATION GENETIC TESTING MARKET, BY PROCEDURE TYPE, 2025 VS. 2030 (USD MILLION)
FIGURE 5
PREIMPLANTATION GENETIC TESTING MARKET, BY TECHNOLOGY, 2025 VS. 2030 (USD MILLION)
FIGURE 6
PREIMPLANTATION GENETIC TESTING MARKET, BY APPLICATION, 2025 VS. 2030 (USD MILLION)
FIGURE 7
PREIMPLANTATION GENETIC TESTING MARKET, BY TYPE OF CYCLE, 2025 VS. 2030 (USD MILLION)
FIGURE 8
PREIMPLANTATION GENETIC TESTING MARKET, BY END USER, 2025 VS. 2030 (USD MILLION)
FIGURE 9
REGIONAL ANALYSIS: PREIMPLANTATION GENETIC TESTING MARKET
FIGURE 10
DECLINING FERTILITY RATES TO PROPEL MARKET GROWTH
FIGURE 11
US AND REAGENTS & CONSUMABLES COMMANDED LARGEST NORTH AMERICAN MARKET SHARE IN 2024
FIGURE 12
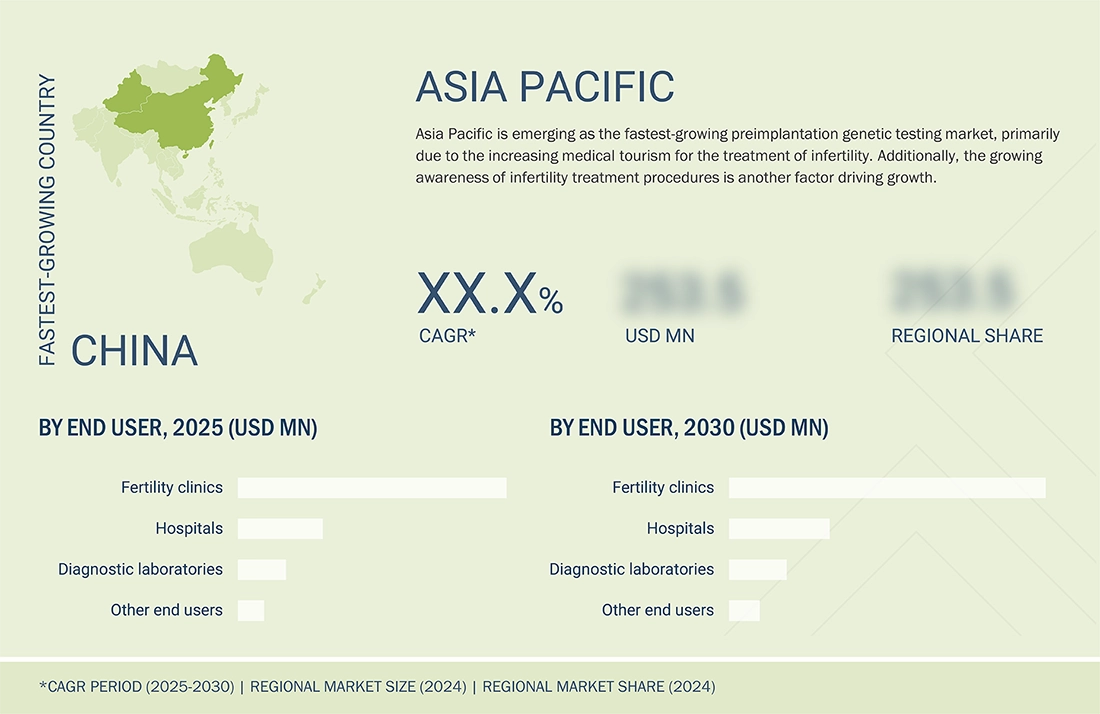
ASIA PACIFIC TO BE FASTEST-GROWING MARKET FROM 2025 TO 2030
FIGURE 13
REAGENTS & CONSUMABLES TO DOMINATE MARKET DURING STUDY PERIOD
FIGURE 14
FERTILITY CLINICS ACCOUNTED FOR LARGEST MARKET SHARE IN 2024
FIGURE 15
PREIMPLANTATION GENETIC TESTING MARKET: DRIVERS, RESTRAINTS, OPPORTUNITIES, AND CHALLENGES
FIGURE 16
PREIMPLANTATION GENETIC TESTING MARKET: TRENDS/DISRUPTIONS IMPACTING CUSTOMER’S BUSINESS
FIGURE 17
AVERAGE SELLING PRICE TREND OF PREIMPLANTATION GENETIC TESTING INSTRUMENTS, BY KEY PLAYER, 2024 (USD)
FIGURE 18
AVERAGE SELLING PRICE TREND OF PREIMPLANTATION GENETIC TESTING CONSUMABLES, BY KEY PLAYER, 2024 (USD)
FIGURE 19
AVERAGE SELLING PRICE TREND OF PREIMPLANTATION GENETIC TESTING INSTRUMENTS, BY REGION, 2024 (USD MILLION)
FIGURE 20
AVERAGE SELLING PRICE TREND OF PREIMPLANTATION GENETIC TESTING CONSUMABLES, BY REGION, 2024 (USD MILLION)
FIGURE 21
PREIMPLANTATION GENETIC TESTING MARKET: VALUE CHAIN ANALYSIS
FIGURE 22
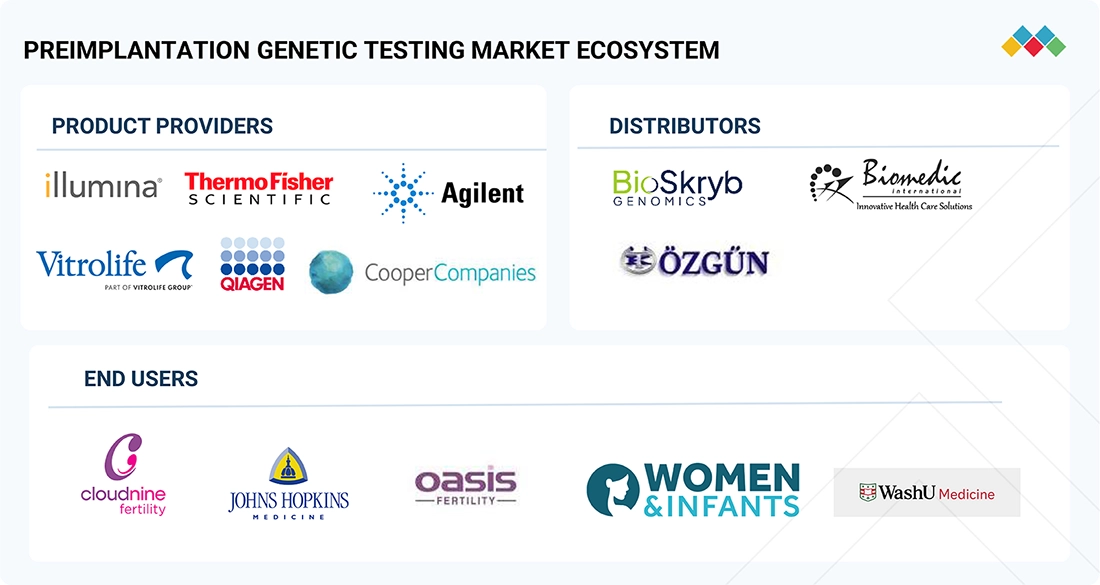
PREIMPLANTATION GENETIC TESTING MARKET: ECOSYSTEM ANALYSIS
FIGURE 23
PREIMPLANTATION GENETIC TESTING MARKET: PORTER’S FIVE FORCES ANALYSIS
FIGURE 24
FUNDING AND NUMBER OF DEALS IN PREIMPLANTATION GENETIC TESTING MARKET, 2022–2025 (USD MILLION)
FIGURE 25
PATENT APPLICATIONS IN PREIMPLANTATION GENETIC TESTING MARKET, JANUARY 2014-DECEMBER 2024
FIGURE 26
IMPACT OF AI/GEN AI ON PREIMPLANTATION GENETIC TESTING MARKET
FIGURE 27
US: REGULATORY PROCESS FOR IN VITRO DIAGNOSTIC DEVICES
FIGURE 28
CANADA: REGULATORY PROCESS FOR IN VITRO DIAGNOSTIC DEVICES
FIGURE 29
EUROPE: REGULATORY PROCESS FOR IN VITRO DIAGNOSTIC DEVICES
FIGURE 30
JAPAN: REGULATORY PROCESS FOR IN VITRO DIAGNOSTIC DEVICES
FIGURE 31
INDIA: REGULATORY PROCESS FOR IN VITRO DIAGNOSTIC DEVICES
FIGURE 32
BRAZIL: REGULATORY PROCESS FOR IN VITRO DIAGNOSTIC DEVICES
FIGURE 33
INFLUENCE OF KEY STAKEHOLDERS ON BUYING PROCESS, BY PRODUCT & SERVICE
FIGURE 34
KEY BUYING CRITERIA FOR MAJOR END USERS
FIGURE 35
NORTH AMERICA: PREIMPLANTATION GENETIC TESTING MARKET SNAPSHOT
FIGURE 36
ASIA PACIFIC: PREIMPLANTATION GENETIC TESTING MARKET SNAPSHOT
FIGURE 37
REVENUE ANALYSIS OF KEY PLAYERS IN PREIMPLANTATION GENETIC TESTING MARKET, 2020–2024 (USD MILLION)
FIGURE 38
MARKET SHARE ANALYSIS OF KEY PLAYERS IN PREIMPLANTATION GENETIC TESTING MARKET (2024)
FIGURE 39
EV/EBITDA OF KEY VENDORS
FIGURE 40
YEAR-TO-DATE (YTD) PRICE, TOTAL RETURN AND 5-YEAR STOCK BETA OF KEY VENDORS
FIGURE 41
PREIMPLANTATION GENETIC TESTING MARKET: BRAND/PRODUCT COMPARATIVE ANALYSIS
FIGURE 42
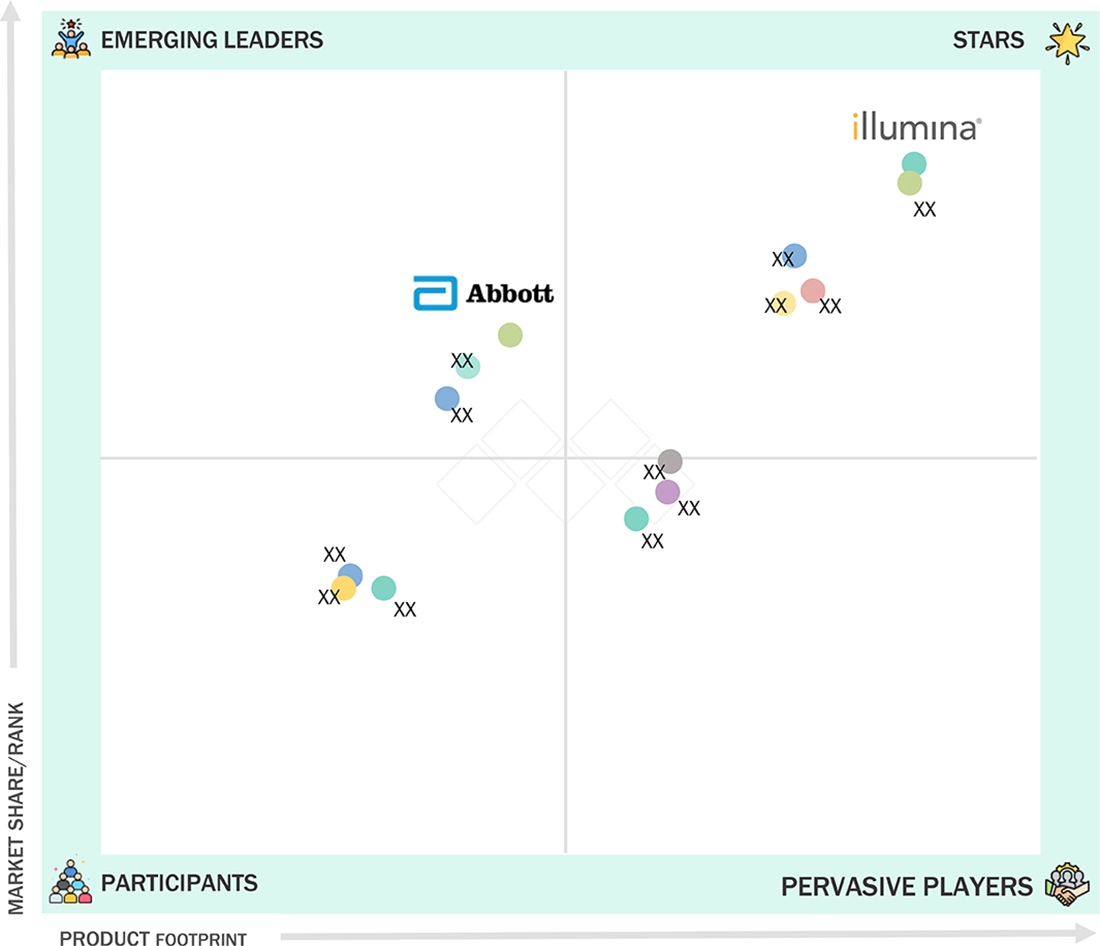
PREIMPLANTATION GENETIC TESTING MARKET: COMPANY EVALUATION MATRIX (KEY PLAYERS), 2024
FIGURE 43
PREIMPLANTATION GENETIC TESTING MARKET: COMPANY FOOTPRINT
FIGURE 44
PREIMPLANTATION GENETIC TESTING MARKET: COMPANY EVALUATION MATRIX (STARTUPS/SMES), 2024
FIGURE 45
ILLUMINA, INC.: COMPANY SNAPSHOT
FIGURE 46
THERMO FISHER SCIENTIFIC INC.: COMPANY SNAPSHOT
FIGURE 47
AGILENT TECHNOLOGIES, INC.: COMPANY SNAPSHOT
FIGURE 48
REVVITY: COMPANY SNAPSHOT
FIGURE 49
COOPERCOMPANIES: COMPANY SNAPSHOT
FIGURE 50
ABBOTT: COMPANY SNAPSHOT
FIGURE 51
TAKARA BIO INC.: COMPANY SNAPSHOT
FIGURE 52
QIAGEN: COMPANY SNAPSHOT
FIGURE 53
VITROLIFE: COMPANY SNAPSHOT
FIGURE 54
OXFORD NANOPORE TECHNOLOGIES PLC: COMPANY SNAPSHOT


 Exclusive indicates content/data unique to MarketsandMarkets and not available with any competitors.


Growth opportunities and latent adjacency in Preimplantation Genetic Testing Market