
Data Center Interconnect Market Size, Share & Trends

Data Center Interconnect Market Share, Growth & Trends by Type [Products (Packet Switching Network, Optical DCI), Software, Services (Professional, Managed)], Application (Real-time Disaster Recovery & Business Continuity, Workload & Data Mobility) - Global Forecast to 2030


DATA CENTER INTERCONNECT MARKET SIZE, SHARE & TRENDS
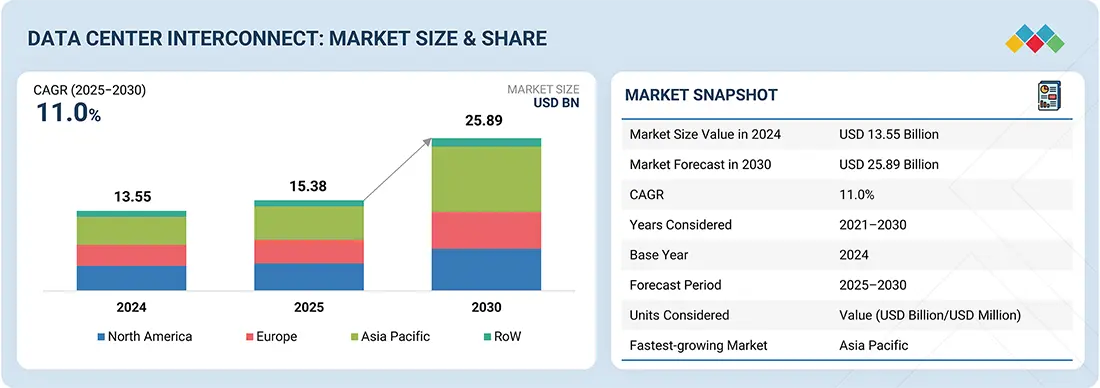
According to Marketsandmarkets, the global data center interconnect market size was valued at USD 15.38 billion in 2025 and is projected to reach USD 25.89 billion in 2030, growing at a 11.0% from 2025 to 2030. Data center interconnect (DCI) refers to the networking technology that links two or more data centers to enable seamless data, workload, and application exchange. The market is gaining momentum due to the surging adoption of cloud services, AI/ML workloads, and edge computing, which require ultra-low latency and high-bandwidth links. Additionally, the rise of hyperscale data centers and the growing need for disaster recovery, business continuity, and workload mobility are fueling adoption.
MARKET SNAPSHOT TABLE
| REPORT METRIC | DETAILS |
|---|---|
| Market Size in 2025 (Value) | USD 15.38 Billion |
| Market Forecast in 2030 (Value) | USD 25.89 Billion |
| Growth Rate | CAGR of 11.0% from 2025–2030 |
| Years Considered | 2021–2030 |
| Base Year | 2024 |
| Forecast Period | 2025–2030 |
| Units Considered | Value (USD Million/Billion) |
| Report Coverage | Revenue Forecast, Company Ranking, Competitive Landscape, Growth Factors, and Trends |
| Segments Covered |
|
| Regional Scope | North America, Europe, Asia Pacific, and RoW |
| Top Companies |
|
| Grtowth Drivers |
|
Market Size & Forecast
KEY TAKEAWAYS
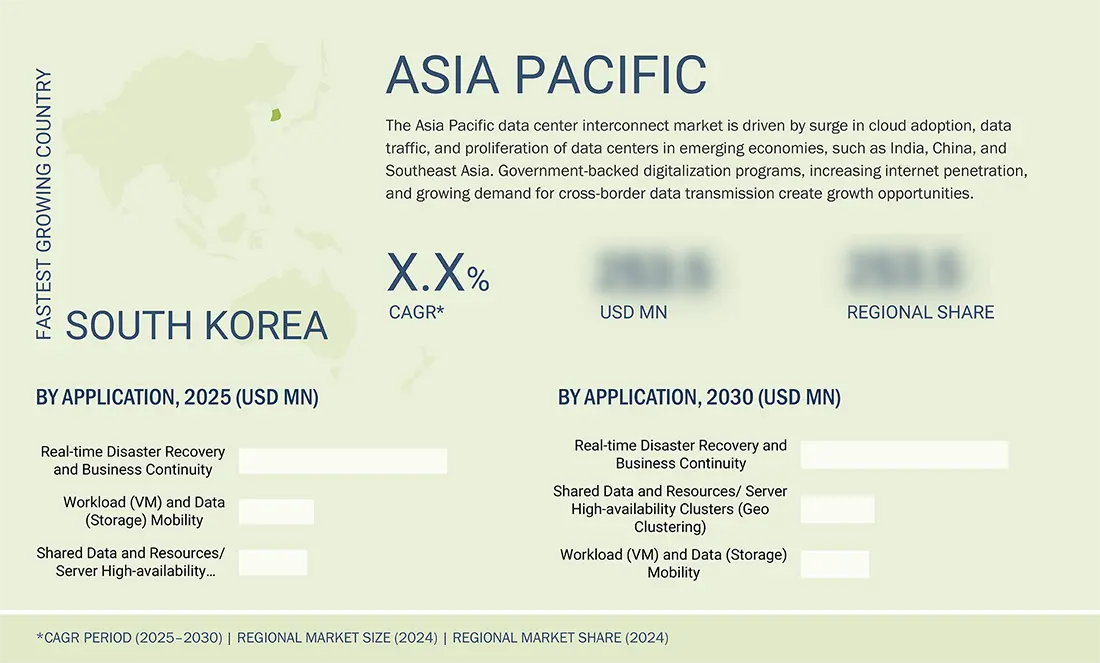
- The Asia Pacific data center interconnect market accounted for a 35.1% revenue share in 2024.
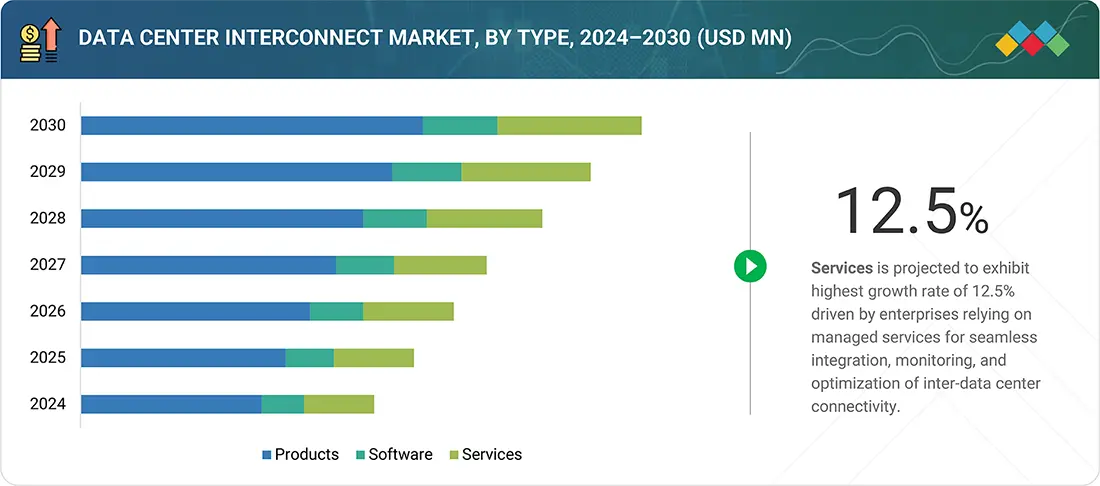
- By type, the services segment is expected to register the highest CAGR of 12.5%.
- By application, the real-time disaster recovery and business continuity segment is expected to dominate the market.
- By end user, the enterprises segment is projected to grow at the fastest rate from 2025 to 2030.
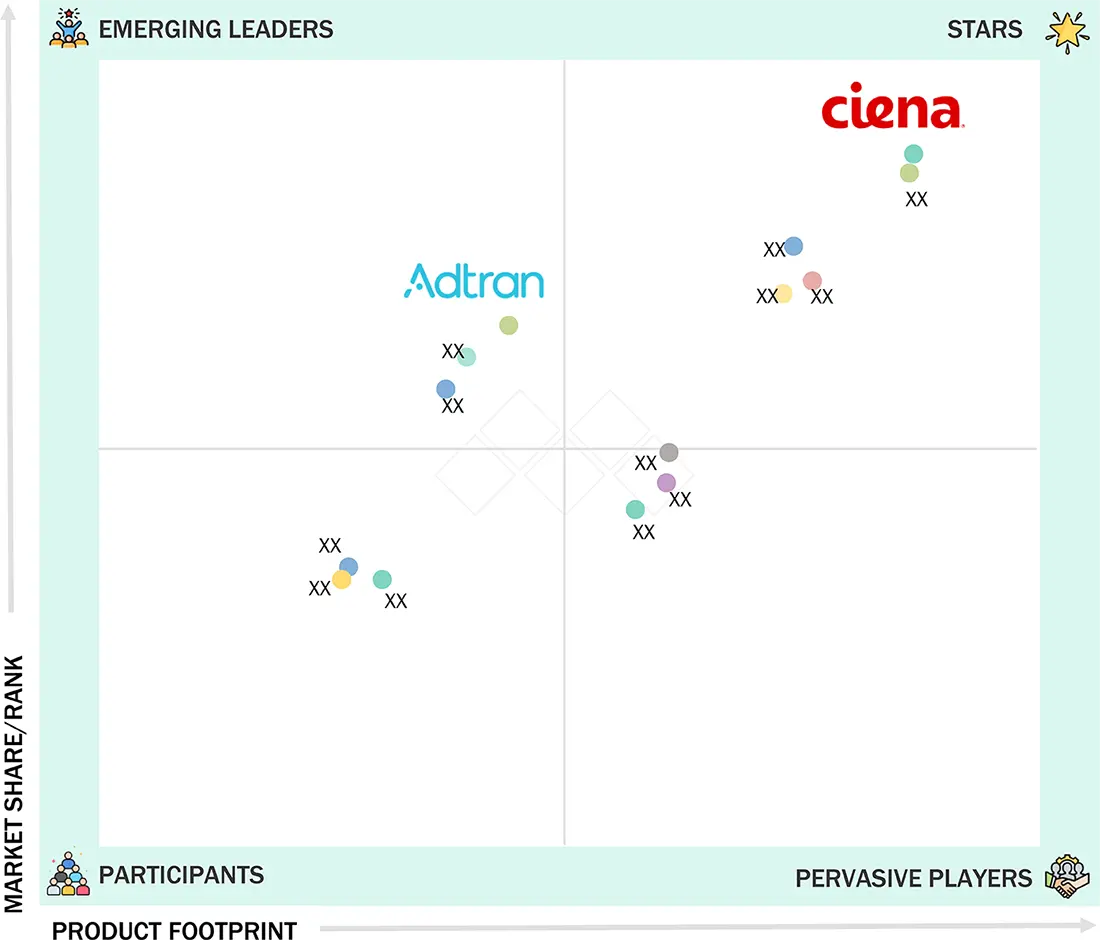
- Ciena Corporation, Huawei Technologies Co., Ltd., Cisco Systems, Inc. were identified as some of the star players in the data center interconnect market, given their strong market share and product footprint.
- Adtran and Ribbon Communications Operating Company, Inc., among others, have distinguished themselves among startups and SMEs by securing strong footholds in specialized niche areas, underscoring their potential as emerging market leaders.
The data center interconnect industry is set for strong growth over the coming years, driven by the convergence of cloud computing, AI/ML workloads, and edge deployments that demand high-capacity, low-latency connectivity between geographically dispersed data centers. Rising adoption of hybrid and multi-cloud strategies, coupled with increasing regulatory requirements for data localization and business continuity, further accelerate investment in DCI solutions. Additionally, advancements in optical transport technologies, SDN-enabled automation, and 400G/800G innovations expand scalability and efficiency, making DCI a critical enabler of digital transformation across enterprises and hyperscale environments.
Source: Secondary Research, Interviews with Experts, MarketsandMarkets Analysis
TRENDS & DISRUPTIONS IMPACTING CUSTOMERS' CUSTOMERS
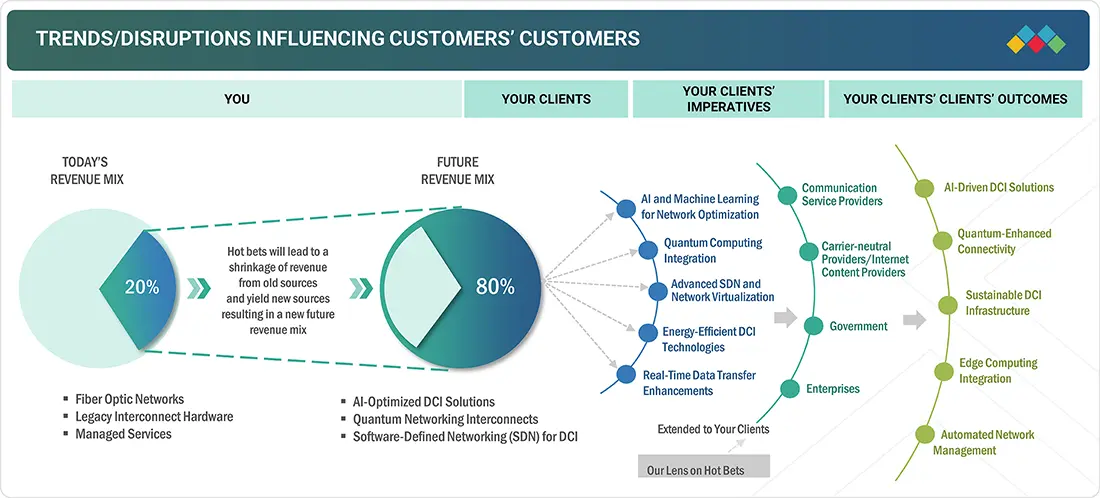
The data center interconnect industry is undergoing a significant transformation from today's landscape to a future-oriented model. Currently, the revenue mix is heavily influenced by existing sources, such as fiber optic networks, legacy interconnect hardware, and managed services, which together form the backbone of the industry. However, a noticeable shrinkage in revenue from these traditional sources is occurring due to the emergence of innovative technologies. This shift is paving the way for a future revenue mix dominated by AI-optimized DCI solutions, quantum networking interconnects, and software-defined networking (SDN) for DCI, which are expected to constitute a substantial portion of the market as new revenue streams.
Source: Secondary Research, Interviews with Experts, MarketsandMarkets Analysis
DATA CENTER INTERCONNECT MARKET GROWTH DYNAMICS
Level
-
Surge in cloud computing and SaaS applications

-
Rise in hyperscale data centers and colocation facilities

Level
-
High initial capital investment

-
Complex network management and integration issues

Level
-
Adoption of AI and machine learning workloads

-
Transition to 400G and 800G optical transceivers

Level
-
Security and compliance risks

-
Interoperability among vendors

Source: Secondary Research, Interviews with Experts, MarketsandMarkets Analysis
Driver: Rise in hyperscale data centers and colocation facilities
The rapid expansion of hyperscale data centers and colocation facilities is a major driver for the data center interconnect market growth. As global cloud providers, internet content companies, and enterprises scale their digital operations, the need for high-bandwidth, low-latency interconnects has surged. Colocation hubs further accelerate adoption by enabling efficient traffic exchange, workload distribution, and multi-cloud connectivity, making DCI a core infrastructure element in today’s data-driven ecosystem.
Restraint: Complex network management and integration issues
Despite strong demand, complex network management and integration challenges remain a restraint for the data center interconnect market. Multi-vendor environments, hybrid cloud strategies, and geographically dispersed facilities often create interoperability gaps, security risks, and operational inefficiencies. Managing dynamic traffic flows while ensuring compliance and resiliency increases deployment complexity. Enterprises lacking in-house expertise face higher operational costs, slowing adoption rates and driving a stronger reliance on managed services and automation solutions to overcome integration hurdles.
Opportunity: Transition to 400G and 800G optical transceivers
The shift toward 400G and 800G optical transceivers presents a major opportunity for the data center interconnect market. These high-speed technologies enable massive bandwidth upgrades, improved scalability, and lower cost-per-bit transmission, supporting the explosive growth of AI, cloud, and edge workloads. Enterprises and hyperscalers are investing in these advancements to future-proof interconnect infrastructure, reduce latency, and optimize energy efficiency. This transition is expected to accelerate network modernization and unlock new revenue opportunities for vendors and service providers.
Challenge: Interoperability among vendors
Interoperability among vendors remains a significant challenge in the data center interconnect market. As enterprises and service providers deploy equipment from multiple OEMs, compatibility issues often arise, leading to higher integration costs and delayed rollouts. Proprietary standards and limited cross-vendor support further complicate seamless interconnection, impacting scalability and flexibility. Overcoming this challenge requires stronger industry collaboration, adoption of open standards, and development of software-defined, vendor-agnostic solutions to ensure interoperability and streamline multi-vendor deployments.
Data Center Interconnect Market TRENDS: COMMERCIAL USE CASES ACROSS INDUSTRIES
| COMPANY | USE CASE DESCRIPTION | BENEFITS |
|---|---|---|
|
|
Deployed a global SD-WAN solution combining Cisco’s SD-WAN Cloud Interconnect (SDCI) with Megaport’s Virtual Edge (MVE) to build a dual underlay model for resilient, flexible, and secure multicloud connectivity across three continents | Improved network performance with low-latency and high-resiliency connectivity | Reduced packet loss and jitter | Enhanced security | Eliminated MPLS costs | Delivered agility for multicloud access |
|
|
Implemented Extreme Switching, Fabric Connect, and ExtremeCloud IQ Site Engine to modernize the city’s IT infrastructure with centralized management, automation, and analytics for citizen-centric digital services | Smarter and more responsive city network | Real-time insights for decision-making | Reduced IT workload | Improved citizen engagement |Scalable foundation for future smart city initiatives |
|
|
Built a cloud data center network with Huawei CloudFabric, leveraging spine-leaf architecture, EVPN, VXLAN, and CE8800/6800/6870 switches to achieve intent-driven networking (IDN) for high-capacity, scalable, and reliable traffic handling | Enhanced network scalability and high availability | Efficient traffic surge management | Smooth evolution toward IDN | Improved performance for VOD, gaming, and online advertising services |
|
|
Connected two physically distant data centers in Marseille with a super-fast DCI solution, enabling seamless integration into a single virtualized campus with access to subsea cables and connectivity providers | Created a virtualized data center campus | Ensured high-speed interconnection | Expanded operational scale | Enhanced customer access to global connectivity ecosystems |
|
|
Deployed modular optical DCI solution (1830 PSI-M) with programmable PSE-3 coherent DSP modules to scale interconnection capacity across three Madrid metro data centers with redundancy and 400G support | Increased interconnection capacity by 10x | Improved reliability with redundant optical links | Ensured pay-as-you-grow scalability | Supported future bandwidth and peering demands |
Logos and trademarks shown above are the property of their respective owners. Their use here is for informational and illustrative purposes only.
MARKET ECOSYSTEM
The data center interconnect ecosystem thrives on a well-integrated ecosystem of hardware manufacturers, software vendors, connectivity service providers, and diverse end users. Each stakeholder is vital in enabling high-speed, secure, and scalable interconnectivity across data centers to meet growing demands for cloud computing, content delivery, and disaster recovery. The synergy between these participants ensures performance optimization, cost efficiency, and operational flexibility across metro and long-haul DCI deployments.
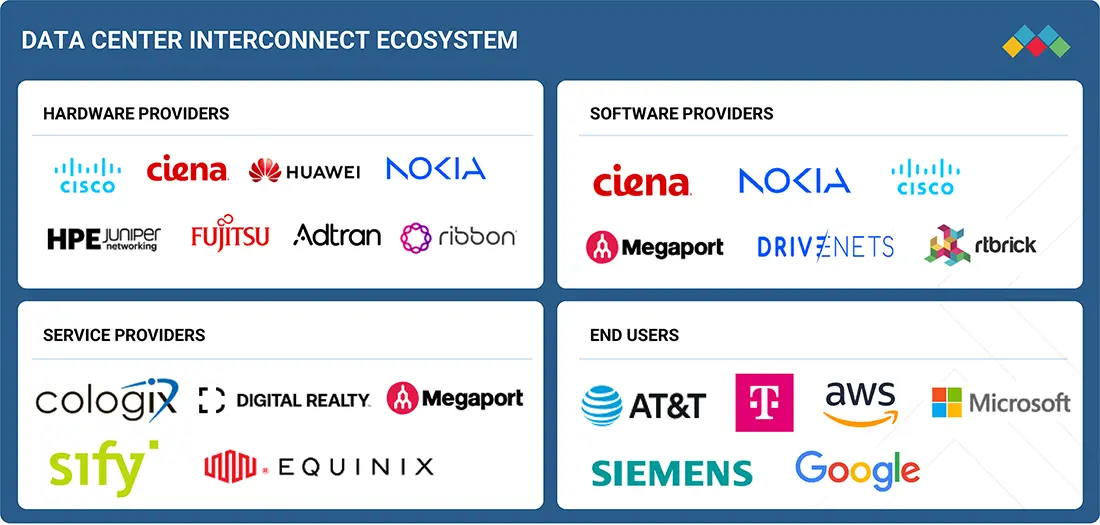
Logos and trademarks shown above are the property of their respective owners. Their use here is for informational and illustrative purposes only.
MARKET SEGMENTS
Source: Secondary Research, Interviews with Experts, MarketsandMarkets Analysis
Data Center Interconnect Market Growth, By Type
The product segment dominates the data center interconnect market, as optical transport equipment, WDM platforms, and packet switching devices form the backbone of inter-data center connectivity. With the rapid rise of hyperscale facilities and the need for high-bandwidth, low-latency links, the demand for robust DCI hardware remains strong. Continuous innovations in 400G/800G systems and the integration of SDN further strengthen the growth of this segment.
Data Center Interconnect Market, By Application
Real-time disaster recovery and business continuity account for the largest market share, fueled by enterprises’ need to ensure uninterrupted operations and regulatory compliance. Organizations across BFSI, healthcare, and telecom are investing heavily in DCI to protect critical data, enable real-time replication, and reduce downtime risks. The growing dependence on digital services makes disaster recovery a mission-critical application globally.
Data Center Interconnect Market, By End User
Carrier-neutral providers and internet content providers lead the market, leveraging DCI solutions to connect hyperscale data centers, expand peering capacity, and enhance content delivery networks. Their large-scale infrastructure demands high-capacity and resilient interconnects to support global traffic growth. As streaming, cloud, and social platforms continue to surge, CNPs and ICPs remain the largest consumers of advanced DCI solutions.
REGION
Asia Pacific to be fastest-growing region in global data center interconnect market during forecast period
Asia Pacific is poised to exhibit the highest CAGR in the data center interconnect market, driven by rapid cloud adoption, data localization mandates, and massive hyperscale investments in China, India, and Southeast Asia. Governments and enterprises in the region accelerate digital transformation, creating strong demand for high-performance interconnects. With its expanding internet economy and growing ecosystem of cloud and content providers, the region represents the largest and fastest-growing regional market.
Data Center Interconnect Market TRENDS: COMPANY EVALUATION MATRIX
In the data center interconnect market matrix, Ciena Corporation leads with a robust market presence, advanced optical networking portfolio, and strong adoption across hyperscale and enterprise deployments. Adtran is gaining traction with its focus on scalable optical transport and packet-based solutions, particularly appealing to service providers and mid-tier operators. While Ciena dominates through innovation and global reach, Adtran demonstrates solid growth potential to move further into the leaders’ quadrant.
Source: Secondary Research, Interviews with Experts, MarketsandMarkets Analysis
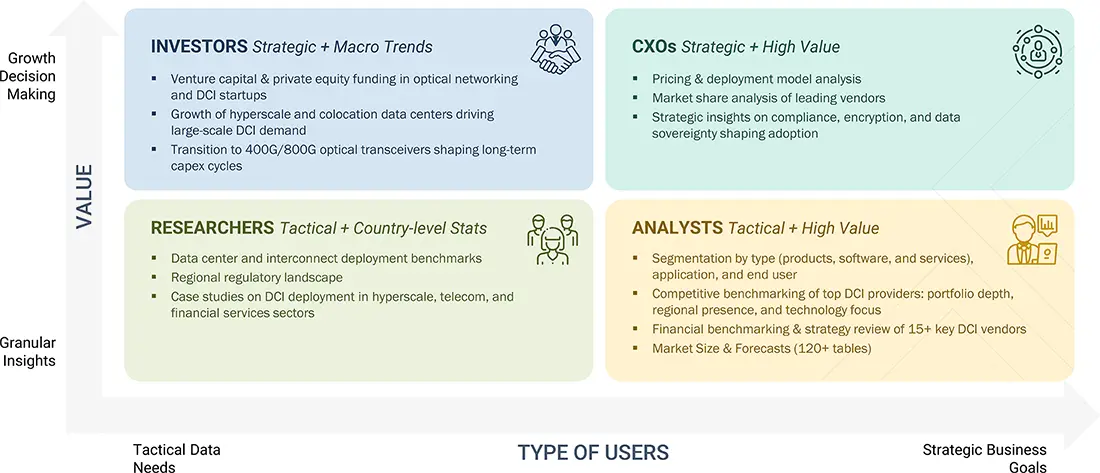
WHAT IS IN IT FOR YOU: Data Center Interconnect Market Growth REPORT CONTENT GUIDE
DELIVERED CUSTOMIZATIONS
We have successfully delivered the following deep-dive customizations:
| CLIENT REQUEST | CUSTOMIZATION DELIVERED | VALUE ADDS |
|---|---|---|
| Cloud Service Provider |
|
|
| Colocation Data Center Operator |
|
|
| Internet Content Provider |
|
|
| Enterprise |
|
|
| Investment Firm |
|
|
RECENT DEVELOPMENTS
- June 2025 : Nokia Corporation (Finland) partnered with Converge ICT (Philippines), a fiber and technology provider, to deploy its Data Center Fabric solution, an integrated hardware and software platform. This deployment aims to future-proof Converge’s new data centers using AI and automation, enhancing network performance, scalability, and efficiency.
- March 2025 : Huawei Technologies Co., Ltd. (China) launched an All-Optical Lossless DCI Solution with OSN 9800 K12 platform to ensure zero packet loss and zero bit errors during RDMA and long-haul transmission, supporting AI computing, remote training, and cross-data center operations.
- February 2025 : Cisco Systems, Inc. (US) and NVIDIA Corporation (US) expanded their partnership to deliver AI-ready data center solutions, focusing on high-performance, low-latency, and energy-efficient connectivity. The partnership leverages the NVIDIA Spectrum-X Ethernet platform with Cisco and NVIDIA silicon to support enterprise AI workloads, enabling interoperability, simplified full-stack solutions, and optimized infrastructure using existing tools across front- and back-end networks.
- November 2024 : Ciena Corporation (US) and HGC Global Communications Limited (Hong Kong) collaborated to upgrade its Data Center Interconnect service in the Philippines, aiming to boost digital infrastructure for cloud providers, carriers, and enterprises. The deployment includes Ciena’s 6500 Packet-Optical Platform with WaveLogic Ai and 3928 routing and switching platform, enhancing network scalability, low latency, and service reliability.
- March 2024 : Juniper Networks, Inc. (US) launched the PTX10002-36QDD, its first 800GbE high-scale router powered by the Express 5 Packet Forwarding Engine. Designed for core, DCI, CDN, AI/ML, and data center applications, it features deep buffers, dynamic resource allocation, and high-scale routing with support for over 10 million FIB routes.
Table of Contents
 Exclusive indicates content/data unique to MarketsandMarkets and not available with any competitors.
Methodology
The study involved four main activities to estimate the current size of the data center interconnect market. Comprehensive secondary research gathered information on the market, peer markets, and parent markets. The next step was to validate these findings, assumptions, and sizing with industry experts across the value chain through primary research. Both top-down and bottom-up approaches were used to estimate the overall market size. Subsequently, market segmentation and data triangulation techniques were employed to estimate the sizes of segments and subsegments.
Secondary Research
The secondary research process involved consulting various secondary sources to gather essential information for this study. These sources include annual reports, press releases, investor presentations from companies, white papers, journals and certified publications, and articles from recognized authors, websites, directories, and databases. This research was conducted to obtain critical details about the industry’s supply chain, the market’s value chain, the total pool of key players, market segmentation based on industry trends (down to the most detailed level), regional markets, and significant developments from both market and technology perspectives. The secondary data collected was analyzed to estimate the overall market size, which was further validated through primary research.
Primary Research
Extensive primary research was conducted after understanding the current state of the data center interconnect market through secondary research. Several primary interviews were carried out with experts from both demand and supply sides across four major regions: North America, Europe, Asia Pacific, and RoW. This primary data was gathered through questionnaires, emails, and telephone interviews.

Note: Other designations include technology heads, media analysts, sales managers, marketing managers, and product managers.
The three tiers of the companies are based on their total revenues as of 2024 ? Tier 1: >USD 1 billion, Tier 2: USD 500 million–1 billion, and Tier 3: USD 500 million.
To know about the assumptions considered for the study, download the pdf brochure
Market Size Estimation
In the full market engineering process, top-down and bottom-up methods and various data triangulation techniques were used to estimate and forecast the overall market segments and subsegments listed in this report. Key market players were identified through secondary research, and their market shares in respective regions were determined via primary and secondary research. This process included analyzing annual and financial reports of leading companies and conducting extensive interviews with industry experts — including CEOs, VPs, directors, and marketing executives — to gather key insights (both quantitative and qualitative).
All percentage shares, splits, and breakdowns were derived from secondary sources and confirmed through primary sources. Every factor influencing the markets studied was carefully examined, verified, and analyzed through primary research to produce accurate final quantitative and qualitative data. This information was consolidated and enhanced with detailed inputs and analysis from MarketsandMarkets before being presented in this report.
Data Center Interconnect Market : Top-Down and Bottom-Up Approach

Data Triangulation
After arriving at the overall market size, the market was split into several segments and subsegments using the market size estimation processes explained above. Data triangulation and market breakdown procedures were employed to complete the entire market engineering process and determine the exact statistics of each market segment and subsegment. The data was triangulated by studying various factors and trends from the demand and supply sides in the data center interconnect market.
Market Definition
Data center interconnect (DCI) refers to the technology and infrastructure used to connect two or more data centers over short, medium, or long distances. It enables the smooth transfer of data, workloads, and applications between geographically separated data center facilities. DCI solutions are designed to offer high-speed, low-latency, and highly secure connectivity to support functions such as disaster recovery, workload mobility, data replication, and business continuity. DCI plays a vital role in modern cloud computing, enterprise IT strategies, and multi-location data center architecture by facilitating efficient resource sharing and scalability across multiple sites.
Key Stakeholders
- Companies in the DCI market
- Investment community interested in the DCI market
- Research institutes and organizations
- Government and financial institutions
- Innovative SMEs
- Consultants/ consultancies/ advisory firms
- End users, such as communication service providers (CSPs), carrier-neutral providers (CNPs), internet content providers (ICPs), governments, enterprises, and healthcare organizations
Report Objectives
- To define, describe, and estimate the data center interconnect (DCI) market based on type, application, and end-user
- To forecast the market size with respect to four main regions: North America, Europe, APAC, and the Rest of the World (RoW), in terms of value
- To strategically analyze the micromarkets with respect to individual growth trends, prospects, and contribution to the overall market
- To map competitive intelligence based on company profiles, key player strategies, and key developments
- To identify drivers, restraints, opportunities, and challenges impacting the growth of the market and submarkets
- To provide value chain analysis, ecosystem analysis, case study analysis, patent analysis, trade analysis, technology analysis, pricing analysis, key conferences and events, key stakeholders and buying criteria, Porter’s Five Forces analysis, regulations, impact of AI, and impact of US tariffs pertaining to the market
- To analyze opportunities in the market for stakeholders by identifying high-growth segments of the data center interconnect ecosystem
- To strategically profile the key players in the market and comprehensively analyze their market share and core competencies in each segment
- To benchmark the market players using the proprietary company evaluation matrix framework, which analyzes them on various parameters within the broad categories of market ranking/share and product portfolio
- To analyze competitive developments such as collaboration, partnerships, mergers and acquisitions, product launches and developments, and research & development (R&D) in the data center interconnect market
- To analyze the impact of the macroeconomic outlook for each region
Available customizations:
With the given market data, MarketsandMarkets offers customizations according to the specific requirements of companies. The following customization options are available for the report:
Regional Analysis:
- Further country-wise breakdown and application-specific market data
- Company Information: Detailed analysis and profiling of the DCI market, including additional market players (up to five)
Key Questions Addressed by the Report
What is the current size of the global Data Center Interconnect (DCI) market?
The global Data Center Interconnect market is valued at USD 15.38 billion in 2025 and is projected to reach USD 25.89 billion by 2030. (MarketsandMarkets)
What is the expected growth rate of the Data Center Interconnect market?
The market is expected to grow at a CAGR of 11.0% from 2025 to 2030, driven by increasing cloud adoption, AI workloads, and edge computing deployments. (MarketsandMarkets)
What are the key growth drivers for the Data Center Interconnect market?
Major growth drivers include the surge in cloud computing and SaaS applications, expansion of hyperscale data centers, increasing AI/ML workloads, edge computing adoption, and demand for low-latency, high-bandwidth connectivity. (MarketsandMarkets)
Which market segment dominates the Data Center Interconnect industry?
The Products segment dominates the market, supported by strong demand for optical transport equipment, wavelength division multiplexing (WDM) platforms, packet switching devices, and 400G/800G networking technologies. (MarketsandMarkets)
Which application segment holds the largest market share?
Real-time Disaster Recovery and Business Continuity is the leading application segment due to enterprises' growing focus on uninterrupted operations, cybersecurity resilience, and regulatory compliance. (MarketsandMarkets)
Which region leads the global Data Center Interconnect market?
Asia Pacific accounted for approximately 35.1% of market revenue in 2024 and is expected to register the highest CAGR through 2030, driven by hyperscale investments, cloud expansion, and digital transformation initiatives. (MarketsandMarkets)
What are the major trends shaping the Data Center Interconnect market?
Key trends include AI-optimized DCI solutions, software-defined networking (SDN), open optical networking, 400G/800G optical technologies, edge computing expansion, and automation of network operations. (MarketsandMarkets)
Who are the leading companies in the Data Center Interconnect market?
Major players include Ciena Corporation, Huawei Technologies, Cisco Systems, Nokia, and Juniper Networks. These companies are recognized for their strong optical networking and interconnect portfolios. (MarketsandMarkets)
What challenges could impact the growth of the Data Center Interconnect industry?
Key challenges include high capital investment requirements, network management complexity, security and compliance risks, and interoperability issues among different vendors and platforms. (MarketsandMarkets)
What is the future outlook for the Data Center Interconnect market?
The market outlook remains strong due to growing multi-cloud deployments, AI-driven data processing, edge infrastructure expansion, and increasing demand for resilient, scalable, and high-speed connectivity between geographically distributed data centers.
Need a Tailored Report?
Customize this report to your needs
Get 10% FREE Customization
Customize This ReportPersonalize This Research
- Triangulate with your Own Data
- Get Data as per your Format and Definition
- Gain a Deeper Dive on a Specific Application, Geography, Customer or Competitor
- Any level of Personalization
Let Us Help You
- What are the Known and Unknown Adjacencies Impacting the Data Center Interconnect Market
- What will your New Revenue Sources be?
- Who will be your Top Customer; what will make them switch?
- Defend your Market Share or Win Competitors
- Get a Scorecard for Target Partners

Custom Market Research Services
We Will Customise The Research For You, In Case The Report Listed Above Does Not Meet With Your Requirements
Get 10% Free CustomisationTESTIMONIALS

Tetsuya Ohhira
Business Development Manager-Technology Business
Nikon Corporation,
Leading Japanese MNC specializing in optics and imaging productswww.nikon.com
MarketsandMarkets™ response
is quick. Their attitude is flexible and positive. Analyst Insights are globally considered and
significant. Client Services quickly respond to our inquiry and demand. Their wide range of global
surveys help us make our strategic plan.
We hope Knowledge Store will be easier to search
for a report.
VP - Marketing & Business Development
Leading Provider of Process Control Solutions
We engaged with MarketsandMarkets on a study to perform an analysis and recommend a Go-To-Market strategy for metrology and process control in the semiconductor market. The study was tailored to our targets and needs with well-defined milestones. Our overall experience with the MarketsandMarkets team was very good throughout the project in all aspects including the analysis methodologies used, the quality and depth of primary and secondary data sets, the professionalism and flexibility of the team and the ability to meet the target schedule and milestones. We want to thank MarketsandMarkets team for a job well done.
Growth opportunities and latent adjacency in Data Center Interconnect Market


Dale
Apr, 2026
The way growth drivers and challenges are outlined adds real value for decision-making..
John
Apr, 2026
Does the report provide a country-wise analysis for high-growth regions like APAC or North America?.