
Rest Of Asia Pacific 3D Imaging Market (2023-2028)

The Rest Of Asia Pacific 3D Imaging Market was valued at $810.7 Million in 2023 and projected to reach to $2468.2 Million by 2028, representing a compound annual growth rate of 24.9%. Rest Of Asia Pacific represents a critical growth corridor for 3D imaging technologies, with market expansion driven by rapid industrialization, increasing healthcare modernization, and manufacturing sector digitalization.


| Market Size in | USD 26.32 MN |
| Market Forecast in | |
| CAGR | |
| Forecast Period | |
| Units Considered | Value (USD MN) |
Rest Of Asia Pacific 3D Imaging Market Trends and Insights
- Rest Of Asia Pacific represents a critical growth corridor for 3D imaging technologies, driven by rapid industrialization, increasing adoption in manufacturing and healthcare sectors, and rising investment in digital infrastructure across emerging economies.
- Rest Of Asia Pacific's market trajectory reflects strong demand for advanced imaging solutions in quality control, medical diagnostics, and consumer electronics applications. Rest Of Asia Pacific is positioned as one of the fastest-growing regions globally, with a compound annual growth rate of 24.9% over the forecast period.
- The region's expansion is underpinned by growing technological capabilities, competitive manufacturing ecosystems, and government initiatives supporting digital transformation.
- Rest Of Asia Pacific's market dynamics are shaped by both established players and emerging innovators capitalizing on cost advantages and expanding end-user adoption across diverse verticals..
Key Market Statistics
- CAGR (2023-2028) 24.9% CAGR
- Market Size, 2023 ~USD 810.7 Million
- Forecast, 2028 ~USD 2468.2 Million
- Country Rest Of Asia Pacific
Rest Of Asia Pacific 3D Imaging Market Overview
Exceptional Growth Trajectory :
Rest Of Asia Pacific's 3D imaging market is expanding at 24.9% CAGR, significantly outpacing the global rate of 20.8%, reflecting the region's accelerated digital transformation and technology adoption.
Manufacturing & Healthcare Dominance :
Rapid industrialization across Rest Of Asia Pacific is driving substantial 3D imaging adoption in manufacturing quality control, healthcare diagnostics, and surgical planning applications.
Digital Infrastructure Investment :
Rising government and private sector investments in digital infrastructure across emerging Asia Pacific economies are creating favorable conditions for 3D imaging technology deployment and innovation.
Market Valuation Surge :
The market is projected to grow from USD 810.7 million in 2023 to USD 2,468.2 million by 2028, representing a 204% increase over the five-year forecast period.
Rest Of Asia Pacific 3D Imaging Market Dynamics
- The region's 24.9% CAGR reflects strong demand for advanced imaging solutions in quality assurance, medical diagnostics, and industrial inspection applications. Government initiatives supporting digital infrastructure development and rising foreign direct investment in technology sectors are accelerating market penetration.
- As emerging economies in the region continue to upgrade manufacturing capabilities and healthcare facilities, 3D imaging adoption is expected to accelerate, positioning Rest Of Asia Pacific as a key revenue driver for global market players through 2028..
Market Ecosystem
Related Ecosystem
Software And Services
- Natural Language Processing (NLP)
- Machine Learning
- Supply Chain Management
- Predictive Analytics
- Image Sensors
- International Business Machines Corporation
- MICROSOFT CORPORATION
- Oracle Corporation
- SAP SE
- Amazon.com, Inc.
Automotive Advance Technologies
- Battery Electric Vehicle (BEV)
- Light Commercial Vehicles (LCVs)
- Fuel Cell Electric Vehicle (FCEV)
- Hybrid Electric Vehicle (HEV)
- Internal Combustion Engine (ICE)
- BOSCH LIMITED
- Continental ag
- Visteon Corporation
- DENSO Corporation
- ZF FRIEDRICHSHAFEN AG
Digitalization And Iot
- Sensors
- Remote Monitoring
- Supply Chain Management
- Passenger Information System (PIS)
- Platform as A Service (PaaS)
- International Business Machines Corporation
- Cisco Systems, Inc.
- MICROSOFT CORPORATION
- Oracle Corporation
- HUAWEI TECHNOLOGIES CO LTD
Key Takeaways
- Rest Of Asia Pacific's 3D Imaging Market will grow from USD 810.7M (2023) to USD 2,468.2M (2028), representing a 24.9% CAGR.
- Rest Of Asia Pacific is outpacing global growth, driven by manufacturing expansion and healthcare digitalization across emerging economies.
- Rest Of Asia Pacific's competitive landscape features both multinational corporations and regional innovators leveraging cost and technology advantages.
- Rest Of Asia Pacific's adoption is accelerating in quality control, medical imaging, and consumer electronics, with strong government digital transformation support.
3D Imaging Market Report Scope
| Report Metric | Details |
|---|---|
| Base Year | 2023 |
| Fastest Growing Segment | MANAGED SERVICES (Service) |
| Forecast Period | 2023-2028 |
| Growth Rate | CAGR of 20.8% from 2023 to 2028 |
| Largest Segment | HARDWARE (Component) |
| Market Size Base Year (Billions) | ~USD 34.37 (2023) |
| Revenue Forecast (Billions) | ~USD 88.4 (2028) |
| Segments Covered | Component, Hardware, Software, Deployment Mode, Service, Professional Service, Technology, Vertical, Offering |
Rest Of Asia Pacific 3D Imaging Market Report Segmentation
9 segment dimensions are covered across the global market.
By Component
- Hardware
- Services
- Software
- Technology
By Hardware
- 3D Cameras
- 3D Display
- 3D Scanners
- 3D Sensors
By Software
- 3D Layout & Animation Software
- 3D Modeling Software
- 3D Scanning Software
- 3D Visualization & Rendering Software
- Image Reconstruction Software
By Deployment Mode
- Cloud
- On-Premises
By Service
- Managed Services
- Professional Services
By Professional Service
- Consulting Services
- Deployment & Integration
- Deployment And Integration
- Support & Maintenance Services
- Support And Maintenance Services
By Technology
- 3D Modeling
- 3D Rendering
- Holographic Imaging
- Laser-Based Imaging
- Lidar
- Motion Graphics
- Other Technologies
- Others*
- Photogrammetry
- Slam
- Stereoscopic Imaging
- Structured Light Imaging
- Structured Light Scanning
- Time-Of-Flight Imaging
- Vfx
By Vertical
- Aerospace & Defense
- Agriculture And Forestry
- Architecture & Construction
- Architecture, Engineering, And Construction
- Automotive
- Construction And Architecture
- Education
- Education And Academia
- Energy & Utilities
- Energy And Utilities
- Government
- Government And Defense
- Healthcare & Life Sciences
- Healthcare And Life Sciences
- Manufacturing
- Media & Entertainment
- Media And Entertainment
- Other Verticals
- Others*
- Retail & Ecommerce
By Offering
- Services
- Software
Target Audience
- 3D Imaging Technology Vendors : Manufacturers and solution providers need Rest Of Asia Pacific-specific market data to prioritize regional expansion, localize product offerings, and allocate R&D resources effectively.
- Manufacturing & Industrial Companies : Operations leaders require insights into 3D imaging adoption trends in Rest Of Asia Pacific manufacturing to optimize quality control, reduce defects, and improve production efficiency.
- Healthcare & Medical Device Organizations : Healthcare providers and medical device companies need regional market intelligence to understand diagnostic imaging adoption, regulatory requirements, and clinical implementation opportunities.
- Investment & Private Equity Firms : Investors evaluating opportunities in Asia Pacific technology sectors require detailed regional market forecasts and growth metrics to assess portfolio companies and acquisition targets.
- Strategic Consultants & Business Analysts : Consulting firms and business strategists need Rest Of Asia Pacific-specific data to advise clients on market entry strategies, competitive positioning, and long-term growth planning.
Reasons to Buy this Report
- Regional Market Differentiation : Gain exclusive insights into Rest Of Asia Pacific's unique market dynamics, competitive landscape, and growth drivers distinct from broader Asia Pacific or global market analyses.
- High-Growth Opportunity Identification : Identify emerging opportunities in the fastest-growing regional segment with 24.9% CAGR, enabling strategic market entry and expansion planning ahead of competitors.
- Sector-Specific Demand Analysis : Understand manufacturing and healthcare sector-specific 3D imaging adoption patterns, use cases, and investment priorities unique to Rest Of Asia Pacific economies.
- Investment & Expansion Strategy : Support capital allocation decisions, partnership development, and go-to-market strategies with data-driven forecasts and regional market sizing through 2028.
- Competitive Intelligence : Benchmark performance against regional competitors, identify market gaps, and assess technology adoption rates specific to Rest Of Asia Pacific's emerging markets.
Frequently asked questions
What is the market size of 3D Imaging in Rest Of Asia Pacific?
Rest Of Asia Pacific's 3D Imaging Market was valued at USD 810.7 million in 2023 and is forecast to reach USD 2,468.2 million by 2028.
What is the CAGR for 3D Imaging in Rest Of Asia Pacific?
Rest Of Asia Pacific's 3D Imaging Market is expected to grow at a compound annual growth rate of 24.9% from 2023 to 2028.
Which industries are driving 3D Imaging adoption in Rest Of Asia Pacific?
Rest Of Asia Pacific's growth is primarily driven by manufacturing, healthcare, consumer electronics, and quality control applications across emerging economies.
Why is Rest Of Asia Pacific experiencing faster growth than the global average?
Rest Of Asia Pacific benefits from rapid industrialization, competitive manufacturing ecosystems, government digital transformation initiatives, and increasing healthcare investment.
What are the key challenges for 3D Imaging market expansion in Rest Of Asia Pacific?
Rest Of Asia Pacific faces challenges including varying technology adoption rates, infrastructure disparities, and competition from established global players entering the region.
RESEARCH METHODOLOGY
The research study for the 3D imaging market involved the use of extensive secondary sources, directories, as well as several journals, such as the Journal of the American College of Radiology, Journal of Imaging Science and Technology, and the International Journal of Imaging Processing to identify and collect the information useful for the comprehensive market research study on the 3D imaging market. The primary sources were mainly industry experts from the core and related industries, preferred 3D imaging hardware and solution providers, third-party service providers, consulting service providers, end users, and other commercial enterprises. In-depth interviews were conducted with various primary respondents, including key industry participants and subject-matter experts, to obtain and verify critical qualitative and quantitative information, as well as assess the prospects.
Secondary Research
In the secondary research process, various sources were referred to, for identifying and collecting information for this study. The secondary sources included annual reports, press releases, and investor presentations of companies; white papers, journals, and certified publications; and articles from recognized authors, directories, and databases. The data was also collected from secondary sources, such as journals, and related magazines. Additionally, 3D imaging spending of various countries was extracted from the respective sources.
Secondary research was mainly used to obtain key information about the industry’s value chain and supply chain to identify the key players by various hardware, solutions, services, market classifications, and segmentations according to offerings of the major players and industry trends related to components, verticals, and regions, and key developments from both market- and technology-oriented perspectives.
Primary Research
In the primary research process, various primary sources from both supply and demand sides have been In the primary research process, various primary sources from both supply and demand sides were interviewed to obtain qualitative and quantitative information of the market. The primary sources from the supply side included various industry experts, such as Chief Experience Officers (CXOs), Vice Presidents (VPs), directors, from business development, marketing, product development/innovation teams, and related key executives from 3D imaging solution vendors, system integrators, professional service providers, industry associations, and key opinion leaders.
Primary interviews were conducted to gather insights, such as market statistics, data of revenue collected from the hardware, solutions, and services, market breakups, market size estimations, market forecasting, and data triangulation. Primary research also helped in understanding the various trends related to technology, application, deployment, and region. Stakeholders from demand side, such as Chief Information Officers (CIOs), Chief Technology Officers (CTOs), and Chief Strategy Officers (CSOs), and installation teams of the governments/end users who are using 3D imaging solutions were interviewed to understand the buyer’s perspective on the suppliers, products, service providers, and their current usage of 3D imaging hardware and solutions which would affect the overall 3D imaging market.
The following is the breakup of primary profiles:
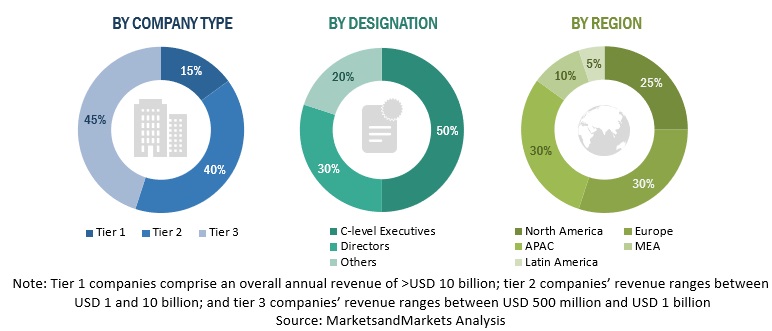
To know about the assumptions considered for the study, download the pdf brochure
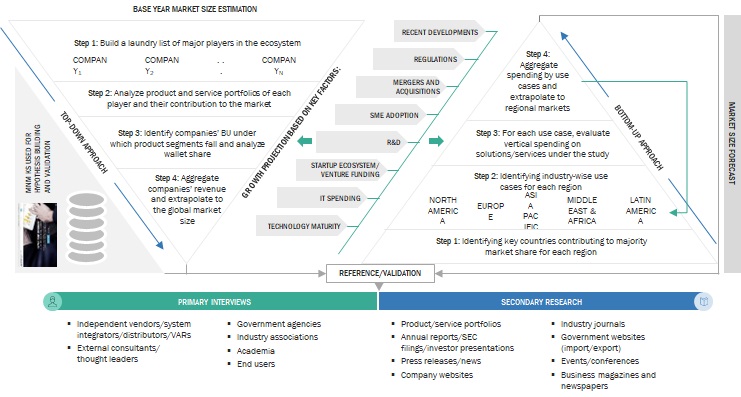
Market Size Estimation
For making market estimates and forecasting the 3D Imaging market and the other dependent submarkets, top-down and bottom-up approaches were used. The bottom-up procedure was used to arrive at the overall market size of the global 3D Imaging market, using the revenue from the key companies and their offerings in the market. With data triangulation and validation through primary interviews, this study determined and confirmed the exact value of the overall parent market size. The overall market size was then used in the top-down procedure to estimate the size of other individual markets via percentage splits of the market seents.
In the top-down approach, an exhaustive list of all the vendors who offer the hardware, solutions, and services in the global 3D imaging market was prepared. The revenue contribution of all the vendors in the market was estimated through annual reports, press releases, funding, investor presentations, paid databases, and primary interviews. Each vendor was evaluated based on its offerings by deployment mode, organization size, and vertical. The aggregate of all the companies’ revenue was extrapolated to reach the overall market size. Each subsegment was studied and analyzed for its global market size and regional penetration. The markets were triangulated through both primary and secondary research. The primary procedure included extensive interviews for key insights from the industry leaders, such as CEOs, VPs, directors, and marketing executives. The market numbers were further triangulated with the existing MarketsandMarkets’ repository for validation.
In the bottom-up approach, the adoption of 3D imaging hardware and solutions among different end users in key countries with respect to their regions that contribute the most to the market share was identified. For cross-validation, the adoption of 3D imaging hardware, solutions, and services among different industries, along with different use cases with respect to their regions, was identified and extrapolated. In addition, weightages have been given to use cases identified in different regions for the market size calculation.
All the possible parameters that affect the market covered in the research study have been accounted for, viewed in extensive detail, verified through primary research, and analyzed to get the final quantitative and qualitative data. The data is consolidated and added with detailed inputs and analysis from MarketsandMarkets.
- The pricing trend is assumed to vary over time.
- All the forecasts are made with the standard assumption that the accepted currency is USD.
- For the conversion of various currencies to USD, average historical exchange rates are used according to the year specified. For all the historical and current exchange rates required for calculations and currency conversions, the US Internal Revenue Service's website is used.
- All the forecasts are made under the standard assumption that the globally accepted currency USD, remains constant during the next five years.
- Vendor-side analysis: The market size estimates of associated solutions and services are factored in from the vendor side by assuming an average of licensing and subscription-based models of leading and innovative vendors.
- Demand/end-user analysis: End users operating in verticals across regions are analyzed in terms of market spending on geospatial analytics based on some of the key use cases. These factors for the geospatial analytics per region are separately analyzed, and the average spending was extrapolated with an approximation based on assumed weightage. This factor is derived by averaging various market influencers, including recent developments, regulations, mergers and acquisitions, enterprise/SME adoption, start-up ecosystem, IT spending, technology propensity and maturity, use cases, and the estimated number of organizations per region.
Market Size Estimation: Top Down And Bottom Up Approach
To know about the assumptions considered for the study, Request for Free Sample Report
Data Triangulation
After arriving at the overall market size using the market size estimation processes as explained above, the market was split into several segments and subsegments. To complete the overall market engineering process and arrive at the exact statistics of each market segment and subsegment, data triangulation and market breakup procedures were employed, wherever applicable. The overall market size was then used in the top-down procedure to estimate the size of other individual markets via percentage splits of the market segmentation.
Market Definition
According to Jesse Garant Metrology Center, 3D imaging is the process of creating the illusion of depth in an image. Technological advancements and evolution of specialized inspection techniques in industrial applications, have enabled users to obtain accurate and timeless 3D data on objects, by providing 3D images for testing purposes.
Key Stakeholders
- 3D imaging hardware manufacturers/vendors
- 3D imaging solution vendors
- Value-added Resellers (VARs)
- Government Agencies
- System Integrators (SIs)
Report Objectives
- To To define, describe, and forecast the 3D imaging market by component, technology, vertical, and region
- To provide detailed information about the major factors (drivers, restraints, opportunities, and industry-specific challenges) influencing the market growth
- To analyze the opportunities in the market and provide details of the competitive landscape for stakeholders and market leaders
- To forecast the market size of the segments with respect to five main regions: North America, Europe, Asia Pacific (APAC), Middle East and Africa (MEA), and Latin America
- To profile the key players and comprehensively analyze their market rankings and core competencies
- To analyze competitive developments, such as Mergers and Acquisitions (M&A), new product developments, and Research and Development (R&D) activities, in the market
Available Customizations
With the given market data, MarketsandMarkets offers customizations as per the company’s specific needs. The following customization options are available for the report:
Product Analysis
- Product matrix provides a detailed comparison of the product portfolio of each company
Geographic Analysis
- Further breakup of the North American market for 3D Imaging
- Further breakup of the European market for 3D Imaging
- Further breakup of the Asia Pacific market for 3D Imaging
- Further breakup of the Latin American market for 3D Imaging
- Further breakup of the Middle East & Africa market for 3D Imaging
Company Information
- Detailed analysis and profiling of additional market players (up to five)
Get the Full 3D Imaging Market Report
Full forecast, segment splits, and company analysis for all 3D Imaging Market.
- UK 3D Imaging Market
- China 3D Imaging Market
- US 3D Imaging Market
- Canada 3D Imaging Market
- France 3D Imaging Market
- Germany 3D Imaging Market
- Italy 3D Imaging Market
- Rest Of Europe 3D Imaging Market
- Spain 3D Imaging Market
- Anz 3D Imaging Market
- India 3D Imaging Market
- Japan 3D Imaging Market
- South Korea 3D Imaging Market
- Argentina 3D Imaging Market
- Brazil 3D Imaging Market
- Mexico 3D Imaging Market
- Rest Of Latin America 3D Imaging Market
- Saudi Arabia 3D Imaging Market
- South Africa 3D Imaging Market
- Turkey 3D Imaging Market
- UAE 3D Imaging Market
Need a Tailored Report?
Customize this report to your needs
Get 10% FREE Customization
Customize This Report
