
Asia Pacific Asset Performance Management Market (2026-2031)

The Asia Pacific Asset Performance Management Market was valued at $344.2 Million in 2026 and projected to reach to $882.8 Million by 2031, representing a compound annual growth rate of 17.0%. The Asia Pacific Asset Performance Management market is poised for exceptional growth, expanding from $344.2 million in 2026 to $882.8 million by 2031.


| Market Size in | USD 26.32 MN |
| Market Forecast in | |
| CAGR | |
| Forecast Period | |
| Units Considered | Value (USD MN) |
Asia Pacific Asset Performance Management Market Trends and Insights
- Asia Pacific's 17.0% compound annual growth rate significantly outpaces global trends, driven by rapid industrialization, digital transformation initiatives, and increasing adoption of predictive maintenance technologies across manufacturing and energy sectors.
- The region's expanding industrial base and rising investments in smart factory infrastructure position Asia Pacific as a critical growth engine for the global APM market. Asia Pacific's market growth is fueled by the region's emphasis on operational efficiency and cost reduction in asset-intensive industries.
- Organizations across Asia Pacific are increasingly deploying APM solutions to minimize downtime, extend asset lifecycles, and optimize maintenance spending.
- The proliferation of IoT sensors, cloud computing, and artificial intelligence capabilities in Asia Pacific enterprises is accelerating the adoption of advanced APM platforms.
- By 2031, Asia Pacific is expected to capture a substantially larger share of global APM spending, reflecting the region's strategic importance in the worldwide digital industrial transformation..
Key Market Statistics
- CAGR (2026-2031) 17.0% CAGR
- Market Size, 2026 ~USD 344.2 Million
- Forecast, 2031 ~USD 882.8 Million
- Geography Asia Pacific
Asia Pacific Asset Performance Management Market Overview
Exceptional Growth Trajectory :
Asia Pacific's Asset Performance Management market is expanding at 17% CAGR, nearly 65% faster than the global average of 10.3%, reflecting the region's accelerated digital transformation and industrial modernization efforts.
China's Market Leadership :
China dominates the Asia Pacific APM market with $337.2 million in current valuation, driven by massive manufacturing investments, IoT adoption, and government-backed Industry 4.0 initiatives across automotive and electronics sectors.
Rapid Industrialization & Predictive Maintenance Adoption :
Manufacturing-heavy economies in Asia Pacific are increasingly deploying predictive maintenance technologies to reduce downtime, optimize asset lifecycles, and improve operational efficiency across discrete and process industries.
Emerging Market Opportunities :
India ($249.5M), Japan ($233.7M), and South Korea ($120.2M) represent significant growth pockets, with rising enterprise digitalization, smart factory initiatives, and increasing awareness of asset optimization benefits driving market expansion.
Asia Pacific Asset Performance Management Market Dynamics
- This 17% CAGR reflects the region's rapid industrialization, widespread digital transformation initiatives, and growing recognition of predictive maintenance's competitive advantages.
- Manufacturing sectors across China, India, Japan, and South Korea are increasingly investing in APM solutions to enhance operational efficiency and reduce unplanned downtime. Key growth drivers include rising IoT and AI adoption, government support for Industry 4.0 programs, and escalating pressure to optimize capital-intensive assets.
- The region's younger, tech-savvy workforce and expanding cloud infrastructure further accelerate APM solution deployment.
- As enterprises prioritize cost reduction and operational resilience, Asia Pacific is expected to become a critical growth engine for the global APM market, outpacing mature Western markets significantly..
Market Ecosystem
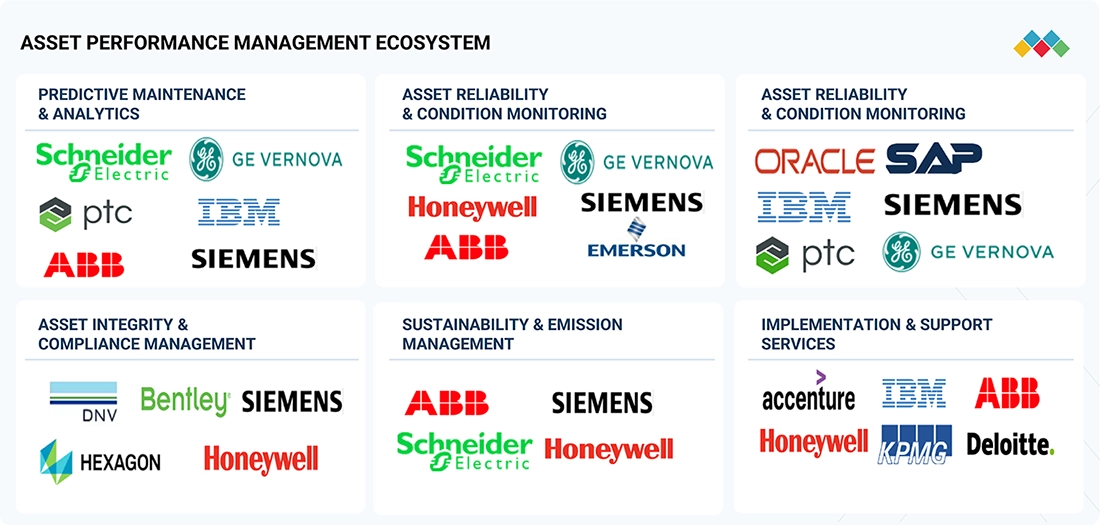
ASSET PERFORMANCE MANAGEMENT MARKET: COMMERCIAL USE CASES ACROSS INDUSTRIES
| COMPANY | USE CASE DESCRIPTION | BENEFITS |
|---|---|---|
 |
Optimize nuclear power generation through predictive asset management at Bruce power | optimized nuclear power generation with improved reliability, efficiency, and safety, reduced unplanned downtime, compliance with regulations |
 |
Enhancing fleet reliability with predictive analytics at Duke Energy | Optimized asset performance through low-cost sensors, improved operations via contextualized insights and predictive analysis, achieved significant financial impact, including USD 34 million saved in a single early-catch event |
 |
Godrej & Boyce elevates asset performance and operational efficiency with HXGN EAM implementation | asset uptime increased from 60% to over 95%, labor Utilization improved by 70%, inventory costs reduced by 45%, managed approximately 95,000 work orders annually, maintained 1.5-million-part references and 125,000 documents of asset data, mobile access for field teams |
 |
SOCAR Turkey achieves world-class asset integrity and extended inspection intervals with Ge Vernova APM implementation | average inspection intervals were extended from 1 year to 5 years for 1,335 assets, average of 20 days of planned inspection downtime was avoided, integration of real-time monitoring and IOWs contributed to world-class asset integrity standards |
 |
Lucid Motors enhances manufacturing efficiency and OEE with Neomatrix ignition-based asset performance management solution | real-time Andon dashboards enabled quick reactions to equipment, automated CMMS integration enhanced accuracy, timeliness, and reduced manual data entry, improved production efficiency, quality, and overall performance |
Logos and trademarks shown above are the property of their respective owners. Their use here is for informational and illustrative purposes only.
Related Ecosystem
Aviation
- Narrow Body Aircraft
- Wide Body Aircraft
- Military Helicopters
- Special Mission Aircraft
- Fighter Aircraft
- HONEYWELL INTERNATIONAL INC.
- COLLINS AEROSPACE
- Thales group
- Safran group
- HEICO Corporation
Cloud Computing
- Software as A Service (SaaS)
- Natural Language Processing (NLP)
- Platform as A Service (PaaS)
- Machine Learning
- Supply Chain Management
- International Business Machines Corporation
- MICROSOFT CORPORATION
- Oracle Corporation
- Amazon.com, Inc.
Digitalization And Iot
- Sensors
- Remote Monitoring
- Supply Chain Management
- Passenger Information System (PIS)
- Platform as A Service (PaaS)
- International Business Machines Corporation
- Cisco Systems, Inc.
- MICROSOFT CORPORATION
- Oracle Corporation
- HUAWEI TECHNOLOGIES CO LTD
Key Takeaways
- Asia Pacific APM market will grow from $344.2M (2026) to $882.8M (2031), representing 17.0% CAGR—significantly above global average.
- Rapid industrialization and digital transformation across Asia Pacific are driving accelerated adoption of predictive maintenance and asset optimization solutions.
- IoT, cloud computing, and AI integration in Asia Pacific enterprises are enabling next-generation APM capabilities and competitive advantages.
- Asia Pacific is positioned as the fastest-growing regional market, attracting substantial vendor investment and innovation in the APM sector.
Asset Performance Management Market Report Scope
| Report Metric | Details |
|---|---|
| Base Year | 2026 |
| Fastest Growing Segment | AI-POWERED APM (Type) |
| Forecast Period | 2026–2031 |
| Growth Rate | CAGR of 10.3% from 2026 to 2031 |
| Largest Segment | TRADITIONAL APM (Type) |
| Market Size Base Year (Billions) | ~USD 2.4 (2026) |
| Revenue Forecast (Billions) | ~USD 3.92 (2031) |
| Segments Covered | Type, Offering, Solution, Asset Type, Deployment Type, Organization Size, Application, Vertical, Service, Professional Service |
Asia Pacific Asset Performance Management Market Report Segmentation
10 segment dimensions are covered across the global market.
By Type
- AI-Powered Apm
- Traditional Apm
By Offering
- Service
- Services
- Solutions
By Solution
- Asset Integrity & Compliance Management
- Asset Reliability & Condition Monitoring
- Asset Strategy & Optimization
- Other Solutions
- Predictive Maintenance & Analytics
- Sustainability & Emission Management
By Asset Type
- Digital/It-Ot Assets
- Fixed Assets
- Linear/Infrastructure Assets
- Mobile Assets
- Rotating Assets
By Deployment Type
- Cloud-Based (SaaS)
- On-Premises
By Organization Size
- Large Enterprises
- Smes
By Application
- Asset Lifecycle Management & Planning
- Operational Support & Resource Management
- Remote Asset Monitoring & Control
- Work Order Automation & Management
By Vertical
- Energy & Utilities
- Government & Defense
- Healthcare & Life Sciences
- It & Telecom
- Manufacturing
- Metal & Mining
- Oil & Gas
- Other Verticals
- Transportation & Logistics
By Service
- Managed Services
- Professional Services
By Professional Service
- Consulting
- Implementation & Integration
- Training & Onboarding
Target Audience
- APM Software & Solution Vendors : Vendors require detailed Asia Pacific market intelligence to prioritize regional expansion, localize offerings for key markets like China and India, and capitalize on the region's 17% growth opportunity ahead of competitors.
- Manufacturing & Industrial Enterprises : Large manufacturers across Asia Pacific need market insights to benchmark APM adoption rates, evaluate solution providers, and justify investments in predictive maintenance technologies for operational excellence.
- Private Equity & Investment Firms : Investors targeting Asia Pacific's high-growth technology sectors require comprehensive market data to identify acquisition targets, assess portfolio company growth potential, and evaluate exit opportunities in the APM space.
- System Integrators & Consultants : SI firms and management consultants need regional market analysis to develop service offerings, identify client opportunities, and position APM implementation services across Asia Pacific's rapidly digitalizing industrial base.
- Government & Policy Organizations : Regional government bodies and industry associations require market intelligence to align Industry 4.0 initiatives, develop digital transformation roadmaps, and assess APM technology adoption progress across Asia Pacific economies.
Key Companies in the Asia Pacific Asset Performance Management Market
| Company | HQ | Ownership | Strongest segments |
|---|---|---|---|
| GP STRATEGIES CORPORATION | United States | Private Company | Managed Learning Services & Organizational Performance Solutions,Technical Performance & Enterprise Technology Adoption,Automotive Performance Solutions, |
| GE VERNOVA | United States | Public Company | Power (Gas, Nuclear, Hydro, Steam),Wind (Onshore and Offshore),Electrification (Grid, Power Conversion, Software, Solar & Storage), |
| AVEVA | United Kingdom | Private Company | Engineering, Procurement & Construction (EPC) and Design Software,Monitoring, Control, and SCADA / HMI,Asset Performance Management (APM), |
| ABB | Switzerland | Public Company | Electrification,Motion,Automation, |
| IBM | United States | Public Company | Software (Hybrid Cloud & AI Platforms),Consulting (Strategy, Technology, Managed Services),Infrastructure (Servers, Storage, Hybrid Cloud Infrastructure Services), |
| SAP | Germany | Public Company | S/4HANA and core ERP (finance, supply chain, manufacturing),HCM (SAP SuccessFactors) and employee experience,Spend management and Business Network, |
| FLUKE | United States | Private Company | Digital multimeters and basic electrical testers,Clamp meters and power quality / power analyzers,Thermal imagers and infrared cameras, |
| EMERSON | United States | Public Company | Final Control,Measurement & Analytical,Control Systems & Software, |
| ROCKWELL AUTOMATION | United States | Public Company | Intelligent Devices,Software & Control,Lifecycle Services, |
| HONEYWELL | United States | Public Company | Industrial Automation,Building Automation,Energy and Sustainability Solutions (UOP and related), |
| BENTLEY SYSTEMS | United States | Public Company | Open modeling applications (MicroStation, OpenRoads, OpenBuildings, etc.),Open simulation and geoprofessional applications (PLAXIS, Leapfrog, STAAD, SACS, etc.),Infrastructure cloud applications (ProjectWise, SYNCHRO, AssetWise), |
| SIEMENS ENERGY | Germany | Public Company | Gas Services (gas and steam turbines, generators, lifecycle services),Grid Technologies (HVDC, transformers, substations, switchgear, digital grid),Siemens Gamesa (onshore and offshore wind turbines and services), |
| YOKOGAWA ELECTRIC | Japan | Public Company | Control Business (DCS, PLCs, control systems, lifecycle services),Field Instruments (flow, pressure, analyzers),Software, OpreX, and Digital/IIoT Solutions, |
| HEXAGON AB | Sweden | Public Company | Manufacturing Intelligence (metrology, CAD/CAM, CAE, quality software),Geosystems (surveying, mapping, laser scanning, AEC),Autonomous Solutions & Positioning (GNSS, anti-jam, autonomy), |
| BAKER HUGHES | United States | Public Company | Oilfield Services & Equipment,Industrial & Energy Technology – Gas Technology Equipment and Services,Industrial & Energy Technology – Digital, Sensing, and Climate Technology, |
GP STRATEGIES CORPORATION
GP Strategies Corporation is a private U.S. company founded in 1959 that employs 4,343 people. The company provides workforce development and training solutions.
GE VERNOVA
GE Vernova is a publicly traded U.S. company established in 2023 with 78,000 employees. It operates in the energy and power generation sector.
AVEVA
AVEVA is a private U.K.-based company founded in 1967 with 6,500 employees. The company specializes in industrial software solutions.
ABB
ABB is a Swiss multinational public company founded in 1883 with 112,700 employees. It operates in robotics, power, and automation technologies.
IBM
IBM is a U.S. public company founded in 1911 with 264,300 employees. The company provides information technology, cloud computing, and business services.
SAP
SAP is a German public company founded in 1972 with 111,038 employees. It is a leading provider of enterprise resource planning software.
FLUKE
Fluke is a U.S. private company founded in 1948 with 2,525 employees. The company manufactures electronic test and measurement equipment.
EMERSON
Emerson is a U.S. public company founded in 1890 with 71,000 employees. It provides process management and automation solutions for industrial applications.
ROCKWELL AUTOMATION
Rockwell Automation is a U.S. public company founded in 1903 with 26,000 employees. The company specializes in industrial automation and information technology.
HONEYWELL
Honeywell is a U.S. public company founded in 1885 with 101,000 employees. It operates in aerospace, building technologies, and industrial automation.
BENTLEY SYSTEMS
Bentley Systems is a U.S. public company founded in 1984 with 5,800 employees. The company develops infrastructure engineering software solutions.
SIEMENS ENERGY
Siemens Energy is a German public company founded in 1866 with 98,995 employees. It provides power generation, transmission, and distribution technologies.
YOKOGAWA ELECTRIC
Yokogawa Electric is a Japanese public company founded in 1915 with 18,313 employees. The company specializes in industrial automation and control systems.
HEXAGON AB
Hexagon AB is a Swedish public company founded in 1975 with 16,118 employees. It provides digital solutions for industrial and geospatial applications.
BAKER HUGHES
Baker Hughes is a U.S. public company founded in 2016 with 53,000 employees. It provides oilfield services, equipment, and digital solutions for the energy industry.
Countries within Asia Pacific - compare and drill down
| Country | 2025 size (native) |
|---|---|
| China | USD 337.2 Million |
| India | USD 249.5 Million |
| Japan | USD 233.7 Million |
| South Korea | USD 120.2 Million |
| Singapore | USD 65 Million |
| Australia & New Zealand | USD 71.4 Million |
| Rest Of Asia Pacific | USD 192.1 Million |
Country market size visualization
Reasons to Buy this Report
- Regional Market Sizing & Forecasts : Obtain precise market valuations for Asia Pacific ($344.2M in 2026, $882.8M in 2031) with country-level breakdowns for China, India, Japan, South Korea, and other key markets to inform regional expansion strategies.
- Competitive Landscape Analysis : Understand vendor positioning, market share distribution, and competitive dynamics specific to Asia Pacific, identifying leaders and emerging players in the rapidly growing APM sector across the region.
- Growth Driver Identification : Gain insights into Asia Pacific-specific catalysts including rapid industrialization, digital transformation initiatives, government Industry 4.0 programs, and predictive maintenance adoption trends driving the 17% CAGR.
- Investment & Partnership Opportunities : Identify high-potential markets, emerging segments, and strategic partnership opportunities across Asia Pacific's manufacturing, energy, utilities, and process industries experiencing accelerated APM adoption.
- Technology Trend Analysis : Explore Asia Pacific-specific technology trends including IoT integration, AI-driven predictive analytics, cloud-based APM platforms, and edge computing adoption shaping the regional market evolution through 2031.
Frequently asked questions
What is the projected market size for Asset Performance Management in Asia Pacific by 2031?
The Asia Pacific APM market is projected to reach $882.8 million by 2031, growing from $344.2 million in 2026.
What is the CAGR for the Asia Pacific Asset Performance Management market?
Asia Pacific's APM market is expected to grow at a compound annual growth rate of 17.0% between 2026 and 2031.
Which industries in Asia Pacific are driving APM adoption?
Manufacturing, energy, utilities, and asset-intensive sectors across Asia Pacific are primary drivers of APM solution adoption due to operational efficiency requirements.
What technologies are accelerating APM growth in Asia Pacific?
IoT sensors, cloud computing platforms, artificial intelligence, machine learning, and predictive analytics are key technologies enabling APM expansion across Asia Pacific enterprises.
How does Asia Pacific's APM growth compare to global trends?
Asia Pacific's 17.0% CAGR significantly exceeds the global APM market CAGR of 10.3%, making the region the fastest-growing geography for Asset Performance Management solutions.
RESEARCH METHODOLOGY
This research study on the asset performance management market drew on extensive secondary sources, including directories, IEEE Communication-Efficient: Algorithms and Systems, the International Journal of Innovation and Technology Management, and paid databases. Primary sources were mainly industry experts from core and related industries, preferred asset performance management providers, third-party and consulting service providers, end users, and other commercial enterprises. In-depth interviews with primary respondents, including key industry participants and subject matter experts, were conducted to gather and verify critical qualitative and quantitative information and to assess the market’s prospects.
Secondary Research
In the secondary research process, various sources were consulted to identify and collect information for this study. Secondary sources included annual reports, press releases, and investor presentations from companies; white papers, journals, and certified publications; and articles by recognized authors, directories, and databases. Data was also collected from other secondary sources, such as journals, government websites, blogs, and vendors’ websites. Additionally, asset performance management spending for various countries was extracted from the respective sources.
Primary Research
In the primary research process, interviews were conducted with various sources from the supply and demand sides to gather qualitative and quantitative market information. The primary sources from the supply side included industry experts such as Chief Experience Officers (CXOs), Vice Presidents (VPs), and directors specializing in business development, marketing, and asset performance management service providers. It also included key executives from asset performance management vendors, system integrators (SIs), professional service providers, industry associations, and other key opinion leaders.
Breakup of primary profiles:
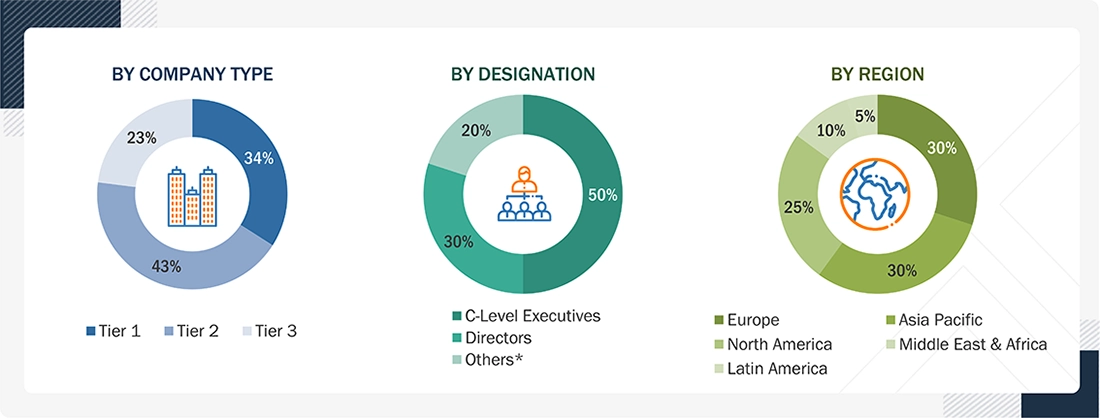
Note: Tier 1 companies’ revenues are more than USD 10 billion; tier 2 companies’ revenues range between USD 1 and 10 billion; and tier 3 companies’ revenues range between USD 500 million and USD 1 billion. Other designations include sales managers, marketing managers, and product managers.
To know about the assumptions considered for the study, download the pdf brochure
Market Size Estimation
Multiple approaches were adopted to estimate and forecast the asset performance management market. The first approach involved estimating the market size by companies’ revenue generated through the sale of asset performance management products.
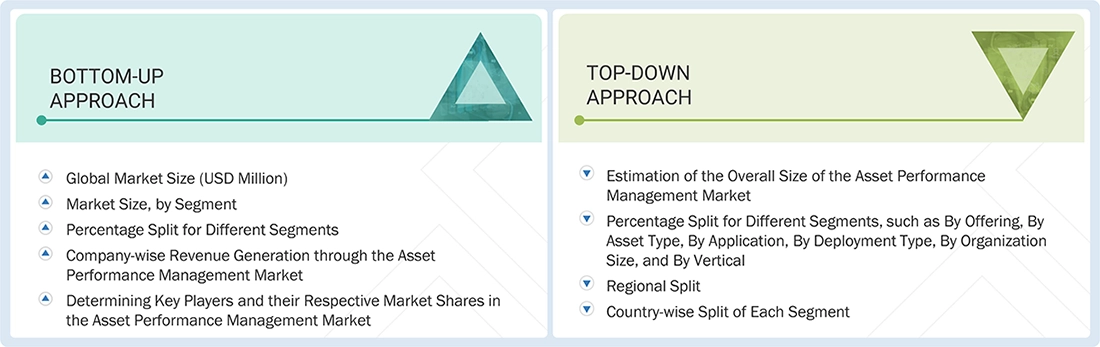
Market Size Estimation Methodology: Top-down Approach
The top-down approach prepared an exhaustive list of all the vendors offering products in the asset performance management market. The revenue contribution of the market vendors was estimated through annual reports, press releases, funding, investor presentations, paid databases, and primary interviews. Each vendor’s offerings were evaluated based on platform, degree of customization, type, application, end user, and region. The markets were triangulated through primary and secondary research. The primary procedure included extensive interviews for key insights from industry leaders, such as CIOs, CEOs, VPs, directors, and marketing executives. The market numbers were further triangulated with the existing MarketsandMarkets’ repository for validation.
Market Size Estimation Methodology: Bottom-up Approach
The bottom-up approach identified the adoption rate of the asset performance management products among different verticals in key countries, considering their regions contributing the most to the market share. For cross-validation, the adoption of asset performance management products among enterprises and other use cases for their regions was identified and extrapolated. Use cases identified in different areas were weighed for the market size calculation.
Based on the market numbers, the regional split was determined by primary and secondary sources. The procedure included an analysis of the asset performance management market’s regional penetration. Based on secondary research, the regional spending on Information and Communications Technology (ICT), socioeconomic analysis of each country, strategic vendor analysis of major asset performance management service providers, and organic and inorganic business development activities of regional and global players were estimated.
Asset Performance Management Market : Top-Down and Bottom-Up Approach
Data Triangulation
After determining the overall market size using the market size estimation processes as explained above, the market was split into several segments and subsegments. Data triangulation and market breakup procedures were employed, wherever applicable, to complete the overall market engineering process and arrive at the exact statistics of each market segment and subsegment. The overall market size was then used in the top-down procedure to estimate the size of other individual markets via percentage splits of the market segmentation.
Market Definition
Asset performance management (APM) is the strategic use of data, software, and services to maximize the reliability, availability, and efficiency of physical assets throughout their lifecycle. It goes beyond traditional maintenance by combining predictive analytics, condition monitoring, digital twins, and risk-based assessment to prevent unexpected failures and reduce downtime. APM integrates real-time operational data with enterprise systems, enabling organizations to make informed decisions about maintenance schedules, asset utilization, and resource allocation. By applying machine learning and IoT sensors, APM solutions can predict potential issues before they escalate, extend asset lifespans, and optimize performance. Industries such as manufacturing, energy, utilities, oil & gas, transportation, and mining widely adopt APM to ensure safety, regulatory compliance, and cost control. Ultimately, APM shifts organizations from reactive or time-based maintenance to proactive and predictive asset strategies, driving operational excellence, sustainability, and long-term return on investment.
According to IBM, “APM is a strategic method of managing physical assets that any organization utilizes in their daily business operations. It helps organizations optimize the performance of valuable assets such as buildings, machinery, equipment, vehicles, software, and other technology.
Key Stakeholders
- Asset performance management solution providers
- Asset performance management service providers
- Independent software vendors (ISVs)
- Investors and venture capitalists (VCs)
- Managed service providers
- Support and maintenance service providers
- System integrators (SIs)/Migration service providers
- Value-added resellers (VARs) and distributors
Report Objectives
- To define, describe, and forecast the asset performance management market based on offering, asset type, type, application, deployment type, organization size, vertical, and region
- To forecast the market size of the five major regional segments: North America, Europe, Asia Pacific, the Middle East & Africa, and Latin America
- To strategically analyze the market subsegments with respect to individual growth trends, prospects, and contributions to the total market
- To provide detailed information related to the major factors influencing market growth (drivers, restraints, opportunities, and challenges)
- To strategically analyze macro and micro markets with respect to growth trends, prospects, and their contribution to the overall market
- To analyze industry trends, patents and innovations, and pricing data related to the market
- To analyze the opportunities in the market for stakeholders and provide details of the competitive landscape for major players
- To profile key players in the market and comprehensively analyze their market share/ranking and core competencies
- To track and analyze competitive developments, such as mergers & acquisitions, product developments, and partnerships & collaborations in the market
Available customizations:
With the given market data, MarketsandMarkets offers customizations as per the company’s specific needs. The following customization options are available for the report:
Product Analysis
- The product matrix provides a detailed comparison of the product portfolio of each company.
Geographic Analysis based on feasibility
- Further breakup of the North American asset performance management market
- Further breakup of the European asset performance management market
- Further breakup of the Asia Pacific asset performance management market
- Further breakup of the Middle East & African asset performance management market
- Further breakup of the Latin American asset performance management market
Company Information
- Detailed analysis and profiling of additional market players (up to five)
Get the Full Asset Performance Management Market Report
Full forecast, segment splits, and company analysis for all Asset Performance Management Market.
- US Asset Performance Management Market
- Canada Asset Performance Management Market
- UK Asset Performance Management Market
- Germany Asset Performance Management Market
- France Asset Performance Management Market
- Italy Asset Performance Management Market
- China Asset Performance Management Market
- India Asset Performance Management Market
- Japan Asset Performance Management Market
- South Korea Asset Performance Management Market
- Singapore Asset Performance Management Market
- Saudi Arabia Asset Performance Management Market
- UAE Asset Performance Management Market
- South Africa Asset Performance Management Market
- Brazil Asset Performance Management Market
- Mexico Asset Performance Management Market
- Rest Of Europe Asset Performance Management Market
- Rest Of Asia Pacific Asset Performance Management Market
Need a Tailored Report?
Customize this report to your needs
Get 10% FREE Customization
Customize This Report
