
Asia Pacific Automated Breach and Attack Simulation Market (2024-2029)

The Asia Pacific Automated Breach and Attack Simulation Market was valued at $135.02 Million in 2024 and projected to reach to $462.8 Million by 2029, representing a compound annual growth rate of 27.9%. The Asia Pacific automated breach and attack simulation market is poised for substantial growth through 2029, driven by increasing cyber threats, regulatory requirements, and digital infrastructure expansion across the region.


| Market Size in | USD 26.32 MN |
| Market Forecast in | |
| CAGR | |
| Forecast Period | |
| Units Considered | Value (USD MN) |
Asia Pacific Automated Breach and Attack Simulation Market Trends and Insights
- Asia Pacific organizations are increasingly adopting breach and attack simulation solutions to validate their security posture and identify vulnerabilities before threat actors exploit them.
- The region's accelerating digital transformation, coupled with rising regulatory compliance requirements and sophisticated cyber threats, is driving widespread adoption across financial services, government, and enterprise sectors in Asia Pacific. Asia Pacific's market growth is underpinned by heightened cybersecurity awareness among enterprises and government agencies seeking continuous security validation.
- The 27.9% compound annual growth rate reflects Asia Pacific's commitment to proactive threat detection and remediation capabilities.
- By 2029, Asia Pacific is expected to become a critical hub for automated security testing, with organizations leveraging these platforms to reduce mean time to detection and strengthen their overall security resilience against evolving attack vectors..
Key Market Statistics
- CAGR (2024-2029) 27.9% CAGR
- Market Size, 2024 ~USD 135.02 Million
- Forecast, 2029 ~USD 462.8 Million
- Geography Asia Pacific
Asia Pacific Automated Breach and Attack Simulation Market Overview
Rapid Market Growth :
Asia Pacific's automated breach and attack simulation market is expanding at 27.9% CAGR, growing from $135.02 million in 2024 to $462.8 million by 2029, outpacing global growth of 27%.
Digital Transformation Catalyst :
Accelerating digital transformation across Asia Pacific enterprises is driving adoption of breach and attack simulation solutions to proactively validate security controls and identify vulnerabilities before exploitation.
Regulatory Compliance Pressure :
Stringent data protection regulations and cybersecurity mandates across Asia Pacific countries are compelling organizations to implement continuous security validation and attack simulation capabilities.
Enterprise Security Maturity :
Leading Asia Pacific organizations are shifting from reactive to proactive security postures, leveraging automated breach and attack simulation to strengthen defenses and reduce breach risk exposure.
Asia Pacific Automated Breach and Attack Simulation Market Dynamics
- Organizations are recognizing the critical need to validate security effectiveness through continuous attack simulation and breach testing.
- This shift toward proactive security validation is accelerating adoption among enterprises, financial institutions, and government agencies seeking to strengthen their security posture and demonstrate compliance with evolving cybersecurity standards. Key growth drivers include rising cloud adoption, expanding IT infrastructure, and heightened awareness of advanced persistent threats targeting Asia Pacific entities.
- The region's diverse regulatory landscape, including PDPA, GDPR applicability, and local data protection laws, is compelling organizations to invest in comprehensive security validation solutions.
- As cyber threats become more sophisticated, Asia Pacific enterprises are prioritizing breach and attack simulation as a core component of their security strategy..
Market Ecosystem
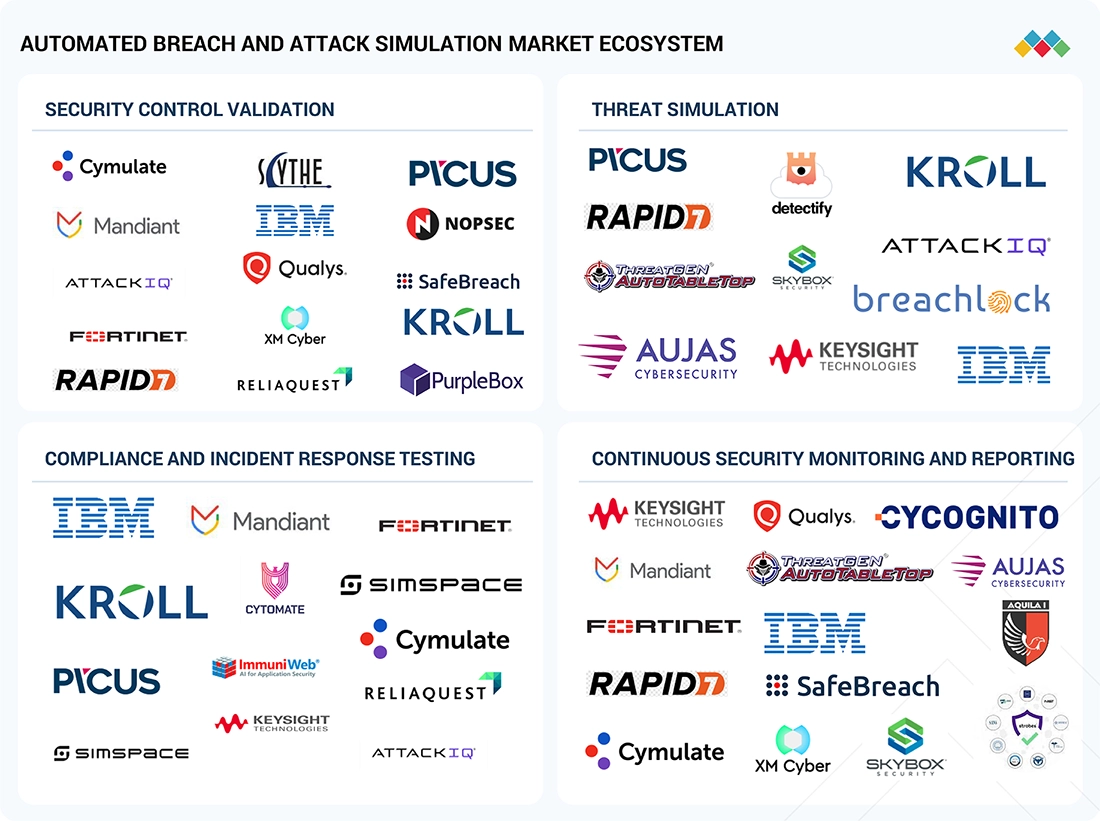
Automated Breach and Attack Simulation Market: COMMERCIAL USE CASES ACROSS INDUSTRIES
| COMPANY | USE CASE DESCRIPTION | BENEFITS |
|---|---|---|
 |
Global Bank Corp. implemented Cymulate’s automated breach and attack simulation platform to continuously simulate real-world attack scenarios, identifying and remediating vulnerabilities proactively. | Improved security posture, reduced risk of data breaches, ensured regulatory compliance |
 |
HealthCare Systems Inc. implemented XM Cyber’s platform to gain continuous visibility into potential attack paths, simulate attacks, and prioritize remediation across legacy and cloud systems. | Enhanced patient data protection, reduced regulatory penalties, improved cybersecurity readiness |
 |
Retail Giant Ltd. implemented SafeBreach’s automated breach and attack simulation tool to continuously assess security controls and simulate potential attack vectors during peak shopping periods. | Improved incident response, reduced attack likelihood, ensured secure shopping experience |
 |
The NSA adopted AttackIQ’s continuous security validation platform to simulate advanced persistent threats (APTs) and government-specific attack scenarios, ensuring proactive testing of cybersecurity defenses. | Enhanced threat detection, improved incident response, ensured national security |
 |
Global Manufacturing Corp. deployed Pentera’s automated breach and attack simulation tool to continuously test industrial control systems (ICS) security and simulate OT-focused cyberattacks. | Improved cyber resilience, minimized downtime risks, ensured safe production processes |
Logos and trademarks shown above are the property of their respective owners. Their use here is for informational and illustrative purposes only.
Related Ecosystem
Cyber Security
- Cloud Security
- Biometric Systems
- Data Loss Prevention (DLP)
- Multi-Factor Authentication
- Security Analytics
- REDINGTON
- International Business Machines Corporation
- Cisco Systems, Inc.
- MITSUI BUSSAN SECURE DIRECTIONS INC
- MICROSOFT CORPORATION
Network Security
- Cloud Security
- Critical Communication Network
- Surveillance System
- Video Surveillance Systems
- Biometric Security and Authentication System
- REDINGTON
- Cisco Systems, Inc.
- International Business Machines Corporation
- Fortinet, Inc.
- MICROSOFT CORPORATION
Software And Services
- Natural Language Processing (NLP)
- Machine Learning
- Supply Chain Management
- Predictive Analytics
- Image Sensors
- International Business Machines Corporation
- MICROSOFT CORPORATION
- Oracle Corporation
- SAP SE
- Amazon.com, Inc.
Key Takeaways
- Asia Pacific's automated breach and attack simulation market will grow from $135.02M (2024) to $462.8M (2029), representing a 27.9% CAGR.
- Asia Pacific enterprises are prioritizing continuous security validation to meet regulatory mandates and combat region-specific cyber threats.
- Asia Pacific's digital transformation initiatives and cloud adoption are accelerating demand for automated attack simulation platforms.
- Asia Pacific organizations are investing in breach and attack simulation to reduce security gaps and improve incident response capabilities.
Automated Breach and Attack Simulation Market Report Scope
| Report Metric | Details |
|---|---|
| Base Year | 2024 |
| Fastest Growing Segment | THREAT INTELLIGENCE (Application) |
| Forecast Period | 2024-2029 |
| Growth Rate | CAGR of 27% from 2024 to 2029 |
| Largest Segment | SOFTWARE (Component) |
| Market Size Base Year (Billions) | ~USD 0.73 (2024) |
| Revenue Forecast (Billions) | ~USD 2.41 (2029) |
| Segments Covered | Offering, Service, Professional Service, Deployment Mode, Organization Size, Application, Vertical, Testing Type, Component, Target |
Asia Pacific Automated Breach and Attack Simulation Market Report Segmentation
10 segment dimensions are covered across the global market.
By Offering
- Managed Services
- Platforms & Tools
- Services
- Solutions
By Service
- Managed Services
- Professional Services
By Professional Service
- Implementation, Integration, And Consulting
- Implementation, Integration, And Consulting (Threat Simulation, On-Demand Analyst)
- Security Posture Assessment
- Support & Maintenance
- Training, Compliance Reporting, And Auditing
By Deployment Mode
- Cloud
- On-Premises
By Organization Size
- Large Enterprises
- Smes
By Application
- Bfsi
- Configuration Management
- Education
- Healthcare
- It & Ites
- Manufacturing
- Other Applications
- Other Verticals
- Patch Management
- Retail & Ecommerce
- Telecommunications
- Threat Intelligence
By Vertical
- Bfsi
- Education
- Energy And Utility
- Healthcare
- It & Ites
- It And Ites
- Manufacturing
- Other Verticals
- Retail
- Retail & Ecommerce
- Retail And E-Commerce
- Telecommunications
By Testing Type
- Cloud Testing
- Mobile Application Testing
- Network/Device Testing
- Social Engineering
- Web Application Testing
By Component
- Services
- Software
By Target
- Api Vulnerabilities
- Content Management System Vulnerabilities
- IoT Vulnerabilities
- Other Target Vulnerabilities
Target Audience
- Enterprise Security Leaders : CISOs and security directors across Asia Pacific enterprises need this data to justify investments in breach and attack simulation solutions and align security strategies with regional market trends.
- Solution Vendors & Providers : BAAS vendors require Asia Pacific market intelligence to identify growth opportunities, prioritize regional expansion, and develop localized solutions addressing regional security requirements.
- IT & Cybersecurity Consultants : Consulting firms advising Asia Pacific clients on security posture need regional market data to recommend appropriate breach and attack simulation solutions and validate investment decisions.
- Investment & Private Equity Firms : Investors evaluating cybersecurity opportunities in Asia Pacific require market sizing and growth forecasts to assess portfolio companies and identify acquisition targets in the BAAS space.
- Government & Regulatory Bodies : Asia Pacific government agencies and regulators need market intelligence to understand cybersecurity solution adoption rates and inform policy decisions regarding security validation requirements.
Countries within Asia Pacific - compare and drill down
| Country | 2025 size (native) |
|---|---|
| China | USD 117.35 Million |
| Japan | USD 93.14 Million |
| India | USD 80.25 Million |
| UAE | USD 51.01 Million |
| Rest Of Asia Pacific | USD 172.07 Million |
Country market size visualization
Reasons to Buy this Report
- Regional Market Sizing : Obtain precise market valuation and forecasts specific to Asia Pacific, enabling accurate budget allocation and investment decisions for breach and attack simulation solutions in the region.
- Country-Level Intelligence : Access detailed market data for China, Japan, India, and other key Asia Pacific markets to identify high-growth opportunities and tailor go-to-market strategies by country.
- Competitive Positioning : Benchmark your organization against regional competitors and understand market dynamics unique to Asia Pacific to develop differentiated value propositions and capture market share.
- Growth Trajectory Analysis : Leverage the 27.9% CAGR projection to forecast revenue opportunities, plan product roadmaps, and allocate resources strategically across Asia Pacific markets through 2029.
- Regulatory & Compliance Insights : Understand how Asia Pacific regulatory requirements and compliance mandates are driving adoption of breach and attack simulation solutions, informing product development and sales strategies.
Frequently asked questions
What is the current market size of automated breach and attack simulation in Asia Pacific?
The Asia Pacific automated breach and attack simulation market was valued at $135.02 million in 2024 and is expected to grow to $462.8 million by 2029.
What is the projected growth rate for Asia Pacific's breach and attack simulation market?
Asia Pacific's automated breach and attack simulation market is projected to grow at a compound annual growth rate (CAGR) of 27.9% from 2024 to 2029.
Which industries in Asia Pacific are driving adoption of breach and attack simulation solutions?
Financial services, government agencies, and large enterprises across Asia Pacific are leading adoption of automated breach and attack simulation platforms to strengthen security posture and meet compliance requirements.
What factors are accelerating the growth of Asia Pacific's breach and attack simulation market?
Asia Pacific's market growth is driven by digital transformation initiatives, increasing regulatory compliance mandates, rising cyber threat sophistication, and growing organizational focus on proactive security validation.
How does Asia Pacific's market growth compare to global trends?
Asia Pacific's 27.9% CAGR slightly exceeds the global market CAGR of 27%, indicating the region's accelerated adoption of automated breach and attack simulation solutions relative to other geographies.
RESEARCH METHODOLOGY
The study involved significant activities in estimating the current market size for the Automated Automated Breach and Attack Simulation Market. Exhaustive secondary research was done to collect information on the breach and attack simulation industry. The next step was to validate these findings, assumptions, and sizing with industry experts across the value chain using primary research. Different approaches, such as top-down and bottom-up, were employed to estimate the total market size. After that, the market breakdown and data triangulation procedures were used to estimate the market size of the segments and subsegments of the Automated Breach and Attack Simulation Market.
In the complete market engineering process, the top-down and bottom-up approaches and several data triangulation methods were extensively used to perform the market estimation and market forecasting for the overall market segments and subsegments listed in this report. Extensive qualitative and quantitative analysis was performed on the complete market engineering process to list the critical information and insights throughout the report to list the key information/insights throughout the report.
Secondary Research
During the secondary research phase, various sources were looked into to gather information for the study. These secondary sources included annual reports, press releases, investor presentations from breach and attack simulation software and service providers, online forums, accredited publications, and white papers. The secondary research was used to get insights into the industry supply chain, key players, market segmentation down to a granular level, regional markets, and notable developments from a market and technology perspective. These findings were then validated through primary sources. Factors considered to estimate regional market size included government and technology initiatives, Gross Domestic Product (GDP) growth rates, Information and Communication Technology (ICT) spending, recent market developments, and a thorough analysis of major breach and attack simulation solution providers’ market position.
Primary Research
In the primary research process, various supply and demand sources were interviewed to obtain qualitative and quantitative information for this report. The primary sources from the supply side included industry experts, such as Chief Executive Officers (CEOs), Vice Presidents (VPs), marketing directors, technology and innovation directors, and related key executives from various key companies and organizations operating in the Automated Breach and Attack Simulation Market.
After the complete market engineering (calculations for market statistics, market breakdown, market size estimations, market forecasting, and data triangulation), extensive primary research was conducted to gather information and verify and validate the critical numbers arrived at. Primary research was also undertaken to identify the segmentation types, industry trends, competitive landscape of breach and attack simulation solutions offered by various market players, and fundamental market dynamics, such as drivers, restraints, opportunities, challenges, industry trends, and key player strategies.
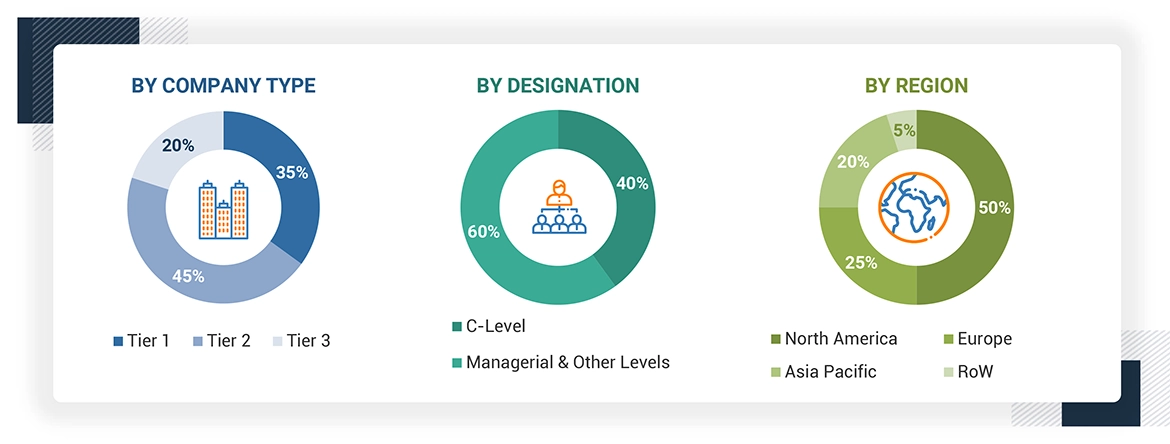
*Others include Sales Managers, Marketing Managers, and Product Managers.
Note: Tier 1 companies are those with total annual revenue > USD 10 billion; tier 2 companies are those with total annual revenue between USD 1 and 10 billion, and tier 3 companies are those with total annual revenue between USD 500 million and 1 billion
Source: MarketsandMarkets Analysis
To know about the assumptions considered for the study, download the pdf brochure
Market Size Estimation
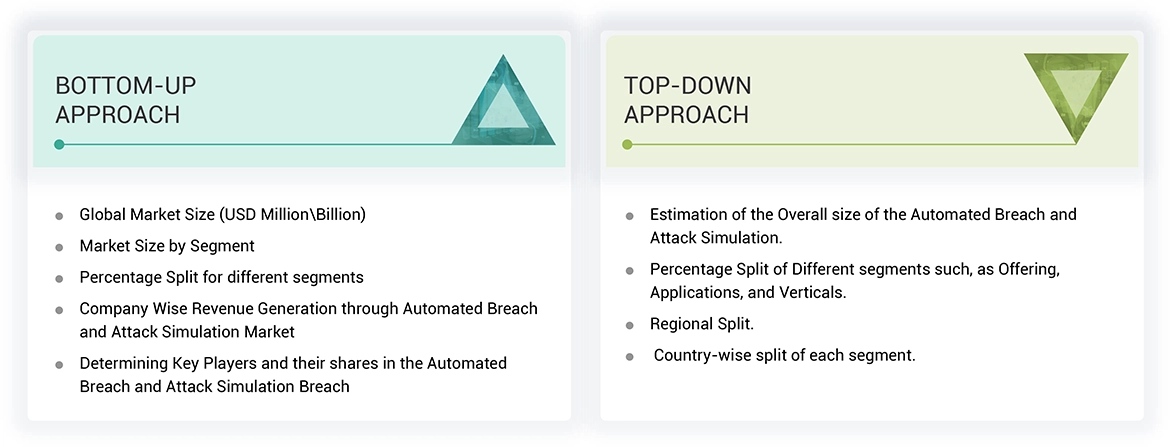
Top-down and bottom-up approaches were used to estimate and validate the size of the global Automated Breach and Attack Simulation Market and the size of various other dependent sub-segments in the overall Automated Breach and Attack Simulation Market. The research methodology used to estimate the market size includes the following details:
Key players in the market were identified through secondary research, and their market shares in the respective regions were determined through primary and secondary research. This entire procedure included the study of the annual and financial reports of the top market players, and extensive interviews were conducted for key insights from the industry leaders, such as CEOs, VPs, directors, and marketing executives.
All percentage splits and breakdowns were determined using secondary sources and verified through primary sources. All possible parameters that affect the market covered in this research study have been accounted for, viewed in extensive detail, verified through primary research, and analyzed to get the final quantitative and qualitative data. This data is consolidated and added to detailed inputs and analysis from MarketsandMarkets.
Automated Breach and Attack Simulation Market : Top-Down and Bottom-Up Approach
Data Triangulation
The market was split into several segments and subsegments after arriving at the overall market size using the market size estimation processes explained above. The data triangulation and market breakup procedures were employed, wherever applicable, to complete the overall market engineering process and arrive at the exact statistics of each market segment and subsegment. The data was triangulated by studying various factors and trends from both the demand and supply sides.
Market Definition
Automated Breach and Attack Simulation Market is a cybersecurity method that continuously and automatically tests an organization’s security defenses by simulating real-world cyberattack scenarios. These tools use AI and ML technologies to replicate sophisticated attack tactics, enabling proactive identification of vulnerabilities and improving overall security posture. breach and attack simulation solutions support compliance with regulatory requirements and enhance cloud-based and on-premises security management by providing ongoing, automated threat assessments and security validations.
Stakeholders
- Security Architects
- CISOs
- Simulation Software Vendors
- SOC Analyst
- System Integrators
- Security Technicians
- Government Agencies
- Investors and Venture Capitalists
- Platform Providers
- Third-Party Providers
- Value-added Resellers (VARs)
Report Objectives
- To define, describe, and forecast the Automated Breach and Attack Simulation Market based on Offering, Deployment mode, Organization Size, Application, Vertical, and Region.
- To forecast the market size of five central regions: North America, Europe, Asia Pacific (APAC), Middle East & Africa (MEA), and Latin America.
- To analyze the subsegments of the market concerning individual growth trends, prospects, and contributions to the overall market.
- To provide detailed information related to the primary factors (drivers, restraints, opportunities, and challenges) influencing the growth of the Automated Breach and Attack Simulation Market.
- To analyze opportunities in the market for stakeholders by identifying high-growth segments of the Automated Breach and Attack Simulation Market.
- To profile the key players of the Automated Breach and Attack Simulation Market and comprehensively analyze their market size and core competencies.
- Track and analyze competitive developments in the global Automated Breach and Attack Simulation Market, such as new product launches, mergers and acquisitions, partnerships, agreements, and collaborations.
Available Customizations
With the given market data, MarketsandMarkets offers customizations based on company-specific needs. The following customization options are available for the report:
GEOGRAPHIC ANALYSIS
- Further breakup of the Asia Pacific market into major countries.
- Further breakup of the North American market into major countries.
- Further breakup of the Latin American market into major countries.
- Further breakup of the Middle East African market into major countries
- Further breakup of the European market into major countries.
COMPANY INFORMATION
- Detailed analysis and profiling of additional market players (up to 5)
Get the Full Automated Breach and Attack Simulation Market Report
Full forecast, segment splits, and company analysis for all Automated Breach and Attack Simulation Market.
- Canada Automated Breach and Attack Simulation Market
- US Automated Breach and Attack Simulation Market
- UK Automated Breach and Attack Simulation Market
- Germany Automated Breach and Attack Simulation Market
- France Automated Breach and Attack Simulation Market
- Italy Automated Breach and Attack Simulation Market
- China Automated Breach and Attack Simulation Market
- Japan Automated Breach and Attack Simulation Market
- India Automated Breach and Attack Simulation Market
- UAE Automated Breach and Attack Simulation Market
- Brazil Automated Breach and Attack Simulation Market
- Mexico Automated Breach and Attack Simulation Market
- Rest Of Europe Automated Breach and Attack Simulation Market
- Rest Of Asia Pacific Automated Breach and Attack Simulation Market
- Rest Of Latin America Automated Breach and Attack Simulation Market
- Ksa Automated Breach and Attack Simulation Market
- Rest Of GCC Automated Breach and Attack Simulation Market
Need a Tailored Report?
Customize this report to your needs
Get 10% FREE Customization
Customize This Report
