
North America Clean Label Ingredients Market (2024-2029)

The North America Clean Label Ingredients Market was valued at $14525.6 Million in 2024 and projected to reach to $20028.8 Million by 2029, representing a compound annual growth rate of 6.6%. North America's clean label ingredients market is poised for sustained expansion through 2029, driven by regulatory pressures, retailer commitments, and evolving consumer preferences toward natural and recognizable ingredients.


| Market Size in | USD 26.32 MN |
| Market Forecast in | |
| CAGR | |
| Forecast Period | |
| Units Considered | Value (USD MN) |
North America Clean Label Ingredients Market Trends and Insights
- In North America, consumer demand for transparency and natural products continues to drive market expansion, with manufacturers increasingly reformulating products to meet clean label standards.
- North America represents a mature yet dynamic market where regulatory frameworks and consumer awareness significantly influence ingredient sourcing and product development strategies through 2029..
Key Market Statistics
- CAGR (2024-2029) 6.6% CAGR
- Market Size, 2024 ~USD 14525.6 Million
- Forecast, 2029 ~USD 20028.8 Million
- Geography North America
North America Clean Label Ingredients Market Overview
Market Valuation & Growth :
North America's clean label ingredients market is valued at $14,525.6 million in 2024, with a projected CAGR of 6.6% through 2029, reaching $20,028.8 million. This growth outpaces many mature markets, driven by sustained consumer demand for transparency and natural formulations.
Consumer Transparency Demand :
North American consumers increasingly scrutinize ingredient lists and demand clear labeling. Manufacturers are actively reformulating products to eliminate artificial additives, preservatives, and synthetic ingredients, positioning clean label as a competitive necessity rather than a premium differentiator.
Market Maturity & Opportunity :
As a mature market, North America demonstrates established distribution channels and consumer awareness of clean label benefits. However, significant opportunities remain in emerging categories, functional ingredients, and premium product segments where clean label commands price premiums.
Regional Leadership Position :
The US dominates North America's clean label market at $14,832.2 million, while Canada ($3,294.8 million) and Mexico ($1,901.8 million) represent growing secondary markets with expanding middle-class consumer bases seeking natural products.
North America Clean Label Ingredients Market Dynamics
- The region's mature retail infrastructure and high consumer awareness create a stable foundation for continued market penetration across food, beverage, and personal care categories. Key growth drivers include reformulation initiatives by major food manufacturers, expansion of clean label offerings in mainstream retail channels, and premiumization trends in natural and organic segments.
- While market saturation in certain categories may moderate growth rates, innovation in plant-based alternatives, functional clean label ingredients, and sustainable sourcing practices will unlock new revenue streams and maintain the projected 6.6% CAGR through 2029..
Market Ecosystem
Related Ecosystem
Free From And Clean Label
- Acrylics
- Bakery Products
- Fluoropolymers
- Amway
- BATORY FOODS
- AZELIS HOLDINGS SA
- Ingredion Incorporated
- ICL Group Ltd
Key Takeaways
- North America's clean label ingredients market will grow from $14.5B in 2024 to $20.0B in 2029, representing a 6.6% CAGR.
- In North America, consumer preference for recognizable, naturally-derived ingredients is reshaping product formulations across food and beverage categories.
- North America's regulatory environment and high consumer literacy create competitive advantages for brands emphasizing ingredient transparency.
- North America's market growth is supported by premiumization trends and willingness of consumers to pay for clean label certified products.
Clean Label Ingredients Market Report Scope
| Report Metric | Details |
|---|---|
| Base Year | 2024 |
| Fastest Growing Segment | NATURAL COLORS (Ingredient Type) |
| Forecast Period | 2024-2029 |
| Growth Rate | CAGR of 6.7% from 2024 to 2029 |
| Largest Segment | FOOD (Application) |
| Market Size Base Year (Billions) | ~USD 50.11 (2024) |
| Revenue Forecast (Billions) | ~USD 69.3 (2029) |
| Segments Covered | Ingredient Type, Form, Application, Food Application |
North America Clean Label Ingredients Market Report Segmentation
4 segment dimensions are covered across the global market.
By Ingredient Type
- Flours
- Fruit & Vegetable Ingredients
- Malt
- Natural Colors
- Natural Flavors
- Other Ingredient Types
- Starch & Sweeteners
By Form
- Dry
- Liquid
By Application
- Beverages
- Food
By Food Application
- Bakery Products
- Cereals & Snacks
- Dairy & Frozen Desserts
- Meat, Poultry, And Seafood
- Other Applications
- Prepared Food Items/Ready Meals & Processed Food Items
Target Audience
- Food & Beverage Manufacturers : Manufacturers need North America-specific clean label data to guide product reformulation strategies, identify ingredient substitution opportunities, and align with regional consumer expectations and retailer requirements across US, Canadian, and Mexican markets.
- Ingredient Suppliers & Distributors : Suppliers require detailed North American market insights to forecast demand for clean label ingredients, identify growth categories, and develop targeted sales strategies for major food manufacturers and regional distributors across the three countries.
- Retail & CPG Companies : Retailers and consumer packaged goods companies need regional market data to optimize clean label product assortments, negotiate with suppliers, and understand consumer preferences and purchasing patterns specific to North American demographics.
- Investment & Private Equity Firms : Investors evaluating clean label ingredient companies or food manufacturers need North America-specific market sizing, growth projections, and regional dynamics to assess investment opportunities and valuation multiples in this mature yet expanding market.
- Market Research & Strategy Consultants : Consultants advising clients on North American market entry, expansion, or competitive positioning require granular regional data, country-level insights, and growth forecasts to develop evidence-based strategies and recommendations.
Countries within North America - compare and drill down
| Country | 2025 size (native) |
|---|---|
| US | USD 14832.2 Million |
| Canada | USD 3294.8 Million |
| Mexico | USD 1901.8 Million |
Country market size visualization
Reasons to Buy this Report
- Market Size & Forecast Data : Access precise valuation of North America's clean label market ($14.5B in 2024) with country-level breakdowns for US, Canada, and Mexico, enabling accurate budget allocation and market entry strategies specific to each North American territory.
- Regional Growth Trajectory : Understand the 6.6% CAGR specific to North America versus the 6.7% global rate, identifying regional outperformance drivers and competitive advantages. Benchmark your growth expectations against regional trends rather than global averages.
- Consumer Behavior Insights : Gain actionable intelligence on North American consumer demand for transparency, natural products, and ingredient reformulation. Understand regional preferences that differ from European or Asian markets to optimize product development and marketing strategies.
- Competitive Landscape Analysis : Identify market dynamics specific to North America's mature yet growing market, including manufacturer reformulation strategies, retailer clean label commitments, and emerging opportunities in premium and functional segments unique to the region.
- Strategic Market Positioning : Leverage country-specific market data to prioritize expansion across the US, Canada, and Mexico. Understand relative market maturity and growth potential in each territory to allocate resources effectively and identify untapped market segments.
Frequently asked questions
What is the current size of North America's clean label ingredients market?
North America's clean label ingredients market was valued at $14,525.6 million in 2024 and is expected to reach $20,028.8 million by 2029.
What is the projected growth rate for clean label ingredients in North America?
North America's clean label ingredients market is projected to grow at a compound annual growth rate (CAGR) of 6.6% from 2024 to 2029.
What drives demand for clean label ingredients in North America?
In North America, demand is driven by consumer preference for transparency, naturally-derived ingredients, health consciousness, and regulatory compliance requirements.
Which product categories dominate North America's clean label ingredients market?
North America's clean label market spans beverages, dairy, bakery, snacks, and processed foods, with beverages and dairy showing particularly strong adoption rates.
How does North America's clean label market compare to other regions?
North America represents a mature, high-value segment of the global clean label market with strong regulatory frameworks and elevated consumer awareness driving sustained growth.
RESEARCH METHODOLOGY
The study involved two major segments in estimating the current size of the clean label ingredients market. Exhaustive secondary research was done to collect information on the market, peer, and parent markets. The next step was to validate these findings, assumptions, and sizing with industry experts across the value chain through primary research. Both top-down and bottom-up approaches were employed to estimate the complete market size. After that, market breakdown and data triangulation were used to estimate the market size of segments and subsegments.
Secondary Research
This research study involved the extensive use of secondary sources—directories and databases such as Bloomberg Businessweek and Factiva—to identify and collect information useful for a technical, market-oriented, and commercial study of the clean label ingredients market.
In the secondary research process, various sources such as annual reports, press releases & investor presentations of companies, white papers, food journals, certified publications, articles from recognized authors, directories, and databases, were referred to identify and collect information.
Secondary research was mainly used to obtain key information about the industry’s supply chain, the total pool of key players, and market classification and segmentation as per the industry trends to the bottom-most level, regional markets, and key developments from both market- and technology-oriented perspectives.
Primary Research
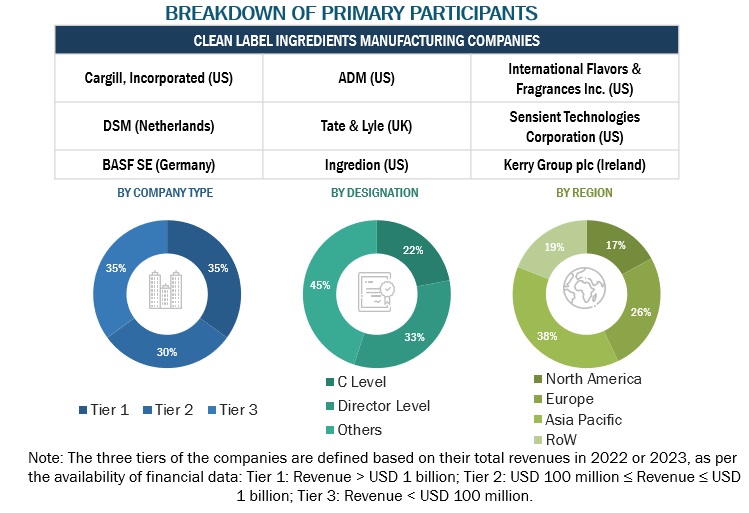
Extensive primary research was conducted after obtaining information regarding the clean label ingredients market scenario through secondary research. Several primary interviews were conducted with market experts from both the demand and supply sides across major countries of North America, Europe, Asia Pacific, South America, and the Rest of the World. Primary data was collected through questionnaires, emails, and telephonic interviews. The primary sources from the supply side included various industry experts, such as Chief X Officers (CXOs), Vice Presidents (VPs), Directors, from business development, marketing, research, and development teams, and related key executives from distributors, and key opinion leaders. Primary interviews were conducted to gather insights such as market statistics, data on revenue collected from the products, market breakdowns, market size estimations, market forecasting, and data triangulation. Primary research also helped in understanding the various trends related to clean label ingredients type, form, application, certification type, and region. Stakeholders from the demand side, such as food & beverage manufacturers who use the clean label ingredients were interviewed to understand the buyer’s perspective on the suppliers, products, and their current usage of clean label ingredients and the outlook of their business which will affect the overall market.
To know about the assumptions considered for the study, download the pdf brochure
|
COMPANY NAME |
DESIGNATION |
|
Cargill, Incorporated (US) |
Regional Sales Manager |
|
ADM (US) |
Marketing Manager |
|
International Flavors & Fragrances Inc. (US) |
General Manager |
|
DSM (Netherlands) |
Sales Manager |
|
Tate & Lyle (UK) |
Sales Manager |
|
Ingredion (US) |
Sales Executive |
Market Size Estimation
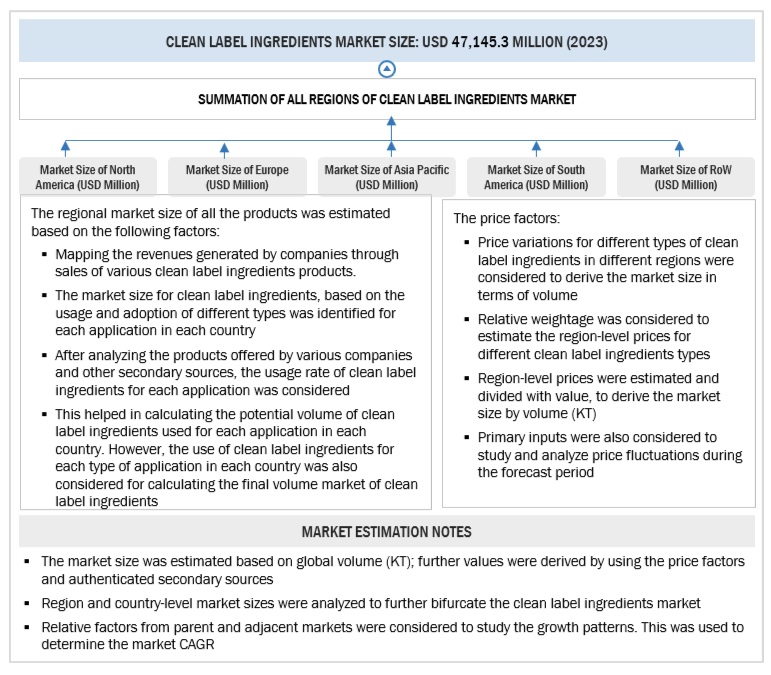
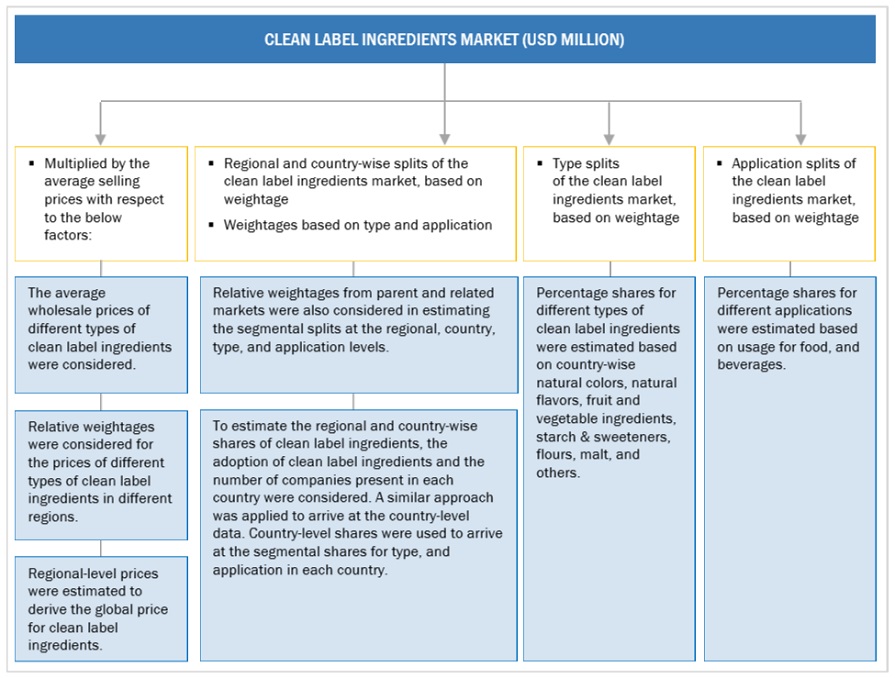
Both the top-down and bottom-up approaches were used to estimate and validate the total market size. These approaches were also used to estimate the size of various dependent submarkets. The research methodology used to estimate the market size includes the following:
- The key players in the industry and markets were identified through extensive secondary research.
- All shares, splits, and breakdowns were determined using secondary sources and verified through primary sources.
- All possible parameters that affect the markets covered in this research study were accounted for, viewed in extensive detail, verified through primary research, and analyzed to obtain the final quantitative and qualitative data.
- The research included the study of reports, reviews, and newsletters of top market players, along with extensive interviews for opinions from leaders, such as CEOs, directors, and marketing executives.
Global Clean Label Ingredients Market: Bottom-Up Approach.
To know about the assumptions considered for the study, Request for Free Sample Report
Global Clean Label Ingredients Market: Top-Down Approach.
Data Triangulation
After arriving at the overall market size from the estimation process explained above, the total market was split into several segments and subsegments. To estimate the overall clean label ingredients market and arrive at the exact statistics for all segments and subsegments, data triangulation and market breakdown procedures were employed, wherever applicable. The data was triangulated by studying various factors and trends from the demand and supply sides. Along with this, the market size was validated using both the top-down and bottom-up approaches.
Market Definition
According to the Institute of Food Technologists, a Clean label means making a product using as few ingredients as possible and making sure those ingredients are items that consumers recognize and think of as wholesome—ingredients that consumers might use at home. It seeks out foods with easy-to-recognize ingredients and no artificial ingredients or synthetic chemicals, and it has become associated with “trust” with manufacturers of food.
Based on inferences drawn from multiple sources and taking into consideration the description of ‘clean label’ by stakeholders such as food ingredient manufacturers and consumers; ‘clean label’ ingredients are defined as food additives and ingredients such as colors, flavors, fruit & vegetable ingredients, starches & sweeteners, flours, malt, preservatives, fermentation ingredients, and others that comply with any or all of the primary factors, and at least one of the secondary factors mentioned below.
Primary factors:
- Fewer product ingredients with no chemical name and easy to understand
- No artificial additives or ingredients
Secondary factors:
- Natural
- Organic
- Non-GMO
Further, there is no standard regulatory definition for clean label ingredients. These are largely defined based on their meaning (clean label’s meaning) to end consumers.
Key Stakeholders
- Raw material suppliers
- Traders, distributors, and manufacturers & suppliers of clean label ingredients
- Food processors & food manufacturers
- Government and research organizations
- Trade associations and industry bodies
- Regulatory bodies such as Food & Drug Administration (FDA), European Commission, European Food Safety Authority (EFSA), and Food Standard Australia New Zealand (FSANZ)
-
Associations, regulatory bodies, and other industry-related bodies:
- European Communities
- World Health Organization (WHO)
- OECD-FAO Agricultural Outlook
- Organizations such as the Food and Drug Administration (FDA)
- United States Department of Agriculture (USDA)
- European Food Safety Agency (EFSA)
- Ministry of Food and Drug Safety (MFDS)
- China Food and Drug Administration (CFDA)
- Codex Alimentarius Commission
- Food Safety Australia and New Zealand (FSANZ)
- Intermediary suppliers such as traders, distributors, and suppliers of ingredients and end products
- End users
- Food & beverage manufacturers/suppliers
Report Objectives
- To define, segment, and forecast the global clean label ingredients market based on ingredient type, form, application, certification type, and region over a historical period ranging from 2019 to 2023 and a forecast period ranging from 2024 to 2029.
- To provide detailed information about the key factors influencing the growth of the market (drivers, restraints, opportunities, and challenges).
- Identifying attractive opportunities in the market by determining the largest and fastest-growing segments across the regions.
-
Analyzing the demand-side factors based on the following:
- Impact of macro and microeconomic factors on the market.
- Shifts in demand patterns across different subsegments and regions.
- To strategically profile the key players and comprehensively analyze their core competencies.
- To analyze competitive developments, such as partnerships, mergers & acquisitions, new product developments, and expansions & investments in the clean label ingredients market.
Available Customizations:
With the given market data, MarketsandMarkets offers customizations according to company-specific scientific needs.
The following customization options are available for the report:
Product Analysis
- Product Matrix, which gives a detailed comparison of the product portfolio of each company.
Geographic Analysis
With the given market data, MarketsandMarkets offers customizations according to company-specific scientific needs.
- Further breakdown of the Rest of the European clean label ingredients market into key countries
- Further breakdown of the Rest of Asia Pacific clean label ingredients market into key countries
- Further breakdown of the South American clean label ingredients market into key countries
Company Information
- Detailed analyses and profiling of additional market players (up to five)
Get the Full Clean Label Ingredients Market Report
Full forecast, segment splits, and company analysis for all Clean Label Ingredients Market.
- Canada Clean Label Ingredients Market
- Mexico Clean Label Ingredients Market
- US Clean Label Ingredients Market
- Germany Clean Label Ingredients Market
- France Clean Label Ingredients Market
- UK Clean Label Ingredients Market
- Italy Clean Label Ingredients Market
- Spain Clean Label Ingredients Market
- China Clean Label Ingredients Market
- Japan Clean Label Ingredients Market
- India Clean Label Ingredients Market
- Brazil Clean Label Ingredients Market
- Argentina Clean Label Ingredients Market
- Rest Of Europe Clean Label Ingredients Market
- Rest Of Asia Pacific Clean Label Ingredients Market
- Rest Of South America Clean Label Ingredients Market
Need a Tailored Report?
Customize this report to your needs
Get 10% FREE Customization
Customize This Report
