
Asia Pacific Enterprise Asset Management Market (2025-2030)

The Asia Pacific Enterprise Asset Management Market was valued at $212.2 Million in 2025 and projected to reach to $451.9 Million by 2030, representing a compound annual growth rate of 16.3%. The Asia Pacific Enterprise Asset Management market is poised for sustained expansion through 2030, driven by accelerating digital transformation initiatives, increasing adoption of IoT and AI-powered asset monitoring, and growing emphasis on predictive maintenance across manufacturing and utilities sectors.


| Market Size in | USD 26.32 MN |
| Market Forecast in | |
| CAGR | |
| Forecast Period | |
| Units Considered | Value (USD MN) |
Asia Pacific Enterprise Asset Management Market Trends and Insights
- Australia & New Zealand's 16.3% compound annual growth rate significantly outpaces the global average, reflecting strong regional demand for digital asset optimization and operational efficiency solutions.
- This accelerated growth trajectory in Australia & New Zealand is driven by increasing adoption of cloud-based EAM platforms, regulatory compliance requirements, and the region's focus on infrastructure modernization across utilities, manufacturing, and public sector organizations. Australia & New Zealand organizations are increasingly investing in EAM systems to reduce downtime, extend asset lifecycles, and improve maintenance planning capabilities.
- The market in Australia & New Zealand benefits from a mature IT infrastructure, high digital literacy, and substantial capital expenditure in critical industries.
- Between 2025 and 2030, Australia & New Zealand is expected to see heightened competition among vendors, expanded integration with IoT and AI technologies, and growing demand for mobile-first and predictive maintenance solutions tailored to regional operational challenges..
Key Market Statistics
- CAGR (2025-2030) 16.3% CAGR
- Market Size, 2025 ~USD 212.2 Million
- Forecast, 2030 ~USD 451.9 Million
- Geography Asia Pacific
Asia Pacific Enterprise Asset Management Market Overview
Exceptional Growth Trajectory :
Asia Pacific's Enterprise Asset Management market is expanding at 16.3% CAGR, significantly outpacing the global average of 9%, driven by rapid digital transformation and industrial modernization across the region.
Market Valuation Surge :
The region's EAM market is valued at USD 212.2 million in 2025 and is projected to more than double to USD 451.9 million by 2030, reflecting strong regional investment in asset optimization technologies.
Digital Asset Optimization Demand :
Asia Pacific organizations are increasingly prioritizing operational efficiency and digital asset management solutions to enhance productivity, reduce downtime, and optimize capital expenditure across manufacturing and infrastructure sectors.
Regional Market Leadership :
Australia & New Zealand leads the Asia Pacific EAM market with USD 654.1 million in market size, while emerging economies in the region present untapped growth opportunities for enterprise asset management solutions.
Asia Pacific Enterprise Asset Management Market Dynamics
- Regional governments' infrastructure development programs and private sector investments in operational efficiency are creating favorable conditions for EAM solution deployment. Key growth catalysts include rising labor costs prompting automation adoption, regulatory compliance requirements, and the need for real-time asset visibility in complex supply chains.
- Organizations across Asia Pacific are recognizing EAM's strategic value in reducing total cost of ownership and extending asset lifecycles, positioning the region as a high-growth market with substantial revenue potential for solution providers and service integrators..
Market Ecosystem
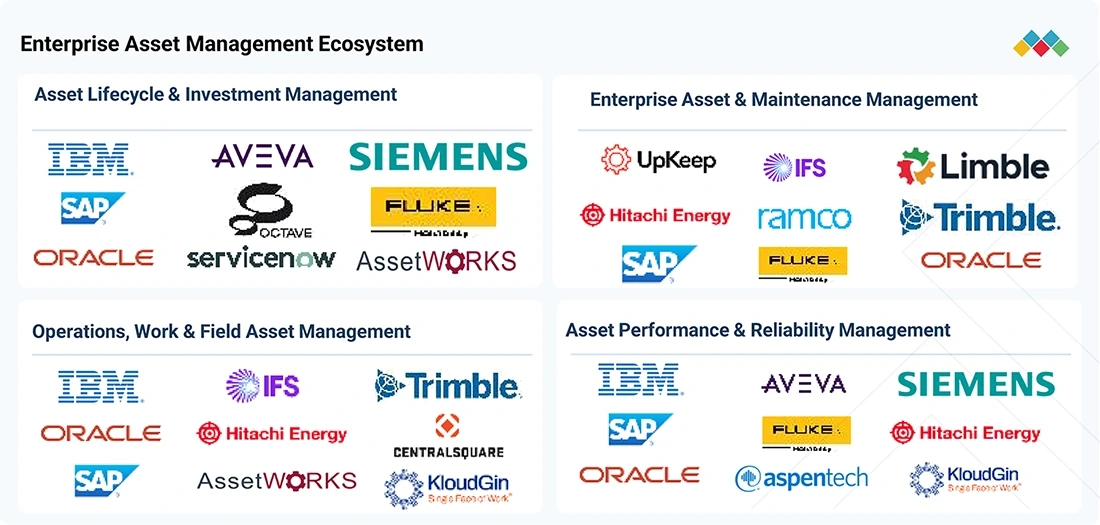
ENTERPRISE ASSET MANAGEMENT MARKET: COMMERCIAL USE CASES ACROSS INDUSTRIES
| COMPANY | USE CASE DESCRIPTION | BENEFITS |
|---|---|---|
 |
Hungrana Kft. modernized maintenance and safety with SAP EAM | Hungrana achieved significant cost savings, improved technician productivity, and reduced paperwork through digitalized maintenance. The solutions also enhanced workplace safety, ensured regulatory compliance, and supported long-term sustainability goals. |
 |
Riyadh Airports Company (RAC) transformed King Khalid International Airport’s maintenance operations by deploying IBM Maximo | RAC achieved major efficiency gains with an 80% reduction in paperwork, a 50% improvement in real-time insights, and contractor onboarding cut from 10 days to just 2–3. Inspector productivity rose by over 40%, while automated workflows and preventive maintenance minimized errors, reduced downtime, and optimized asset lifecycle costs. |
 |
Transdev Sweden rapidly deployed Hexagon’s HxGN EAM to take over the Mälartåg rail network | Transdev Sweden ensured uninterrupted passenger services with improved maintenance efficiency and seamless asset tracking across rail and bus fleets. The future-ready HxGN EAM platform also supports proactive strategies, system integration, and readiness for electric bus adoption. |
 |
L’Oréal implemented Maintenance Connection CMMS to enhance preventive maintenance, streamline workflows, and centralize asset data across its U.S. facilities. | L’Oréal achieved lower maintenance costs and fewer equipment breakdowns through preventive maintenance. The company also improved mechanic productivity and real-time asset visibility, enabling proactive downtime management. |
 |
Anderson Dahlen implemented Aptean EAM to centralize preventive maintenance, streamline work order tracking, and reduce reliance on costly outsourced contractors. | Anderson Dahlen cut maintenance costs by replacing outsourced services with an expanded in-house team and centralized preventive maintenance requests. This improved response speed, reduced downtime, and provided data-driven visibility for smarter decision-making. |
Logos and trademarks shown above are the property of their respective owners. Their use here is for informational and illustrative purposes only.
Related Ecosystem
Energy Storage
- Energy Harvesting
- HVAC System
- Applicant Tracking System
- Battery Electric Vehicle (BEV)
- Carboxymethyl Cellulose (CMC)
- MOMENTIVE PERFORMANCE MATERIALS INC.
- Panasonic Holdings Corporation
- Lg corp
- ABB India Limited
- FDK Corporation
Cloud Computing
- Software as A Service (SaaS)
- Natural Language Processing (NLP)
- Platform as A Service (PaaS)
- Machine Learning
- Supply Chain Management
- International Business Machines Corporation
- MICROSOFT CORPORATION
- Oracle Corporation
- Amazon.com, Inc.
Software And Services
- Natural Language Processing (NLP)
- Machine Learning
- Supply Chain Management
- Predictive Analytics
- Image Sensors
- International Business Machines Corporation
- MICROSOFT CORPORATION
- Oracle Corporation
- SAP SE
- Amazon.com, Inc.
Key Takeaways
- Australia & New Zealand's EAM market will more than double from USD 212.2M (2025) to USD 451.9M (2030), driven by 16.3% CAGR.
- Australia & New Zealand organizations prioritize cloud-based and predictive maintenance solutions to optimize asset performance and reduce operational costs.
- Regulatory compliance and infrastructure modernization initiatives across utilities and manufacturing sectors are primary growth catalysts in Australia & New Zealand.
- Australia & New Zealand's mature IT ecosystem and high digital adoption rates position the region as a leader in advanced EAM technology implementation.
Enterprise Asset Management Market Report Scope
| Report Metric | Details |
|---|---|
| Base Year | 2025 |
| Fastest Growing Segment | CLOUD (Deployment Type) |
| Forecast Period | 2025–2030 |
| Growth Rate | CAGR of 9% from 2025 to 2030 |
| Largest Segment | SOLUTIONS (Offering) |
| Market Size Base Year (Billions) | ~USD 5.86 (2025) |
| Revenue Forecast (Billions) | ~USD 9.02 (2030) |
| Segments Covered | Offering, Type, Application, Deployment Type, Asset Class, Organization Size, Vertical |
Asia Pacific Enterprise Asset Management Market Report Segmentation
7 segment dimensions are covered across the global market.
By Offering
- Services
- Solutions
By Type
- Deployment & Integration
- Support & Maintenance
- Training & Consulting
By Application
- Asset Lifecycle Management
- Compliance & Safety
- Maintenance Management
- Operation Management
- Other Applications
- Report & Analytics
By Deployment Type
- Cloud
- On-Premises
By Asset Class
- Fixed/Facility Assets/Infrastructure
- Fleet & Mobile Assets
- Linear Assets
- Other Assets
- Production Equipment
By Organization Size
- Large Enterprises
- Smes
By Vertical
- Energy & Utilities
- Government & Public Sector
- Healthcare & Life Sciences
- Manufacturing
- Oil & Gas
- Other Verticals
- Transportation & Logistics
Target Audience
- EAM Solution Providers : Software vendors and platform providers need Asia Pacific market intelligence to identify growth segments, customize solutions for regional requirements, and develop localized sales strategies.
- Systems Integrators & Consultants : Implementation partners require detailed market insights to identify client opportunities, assess regional demand for EAM services, and position consulting capabilities effectively.
- Enterprise Buyers & IT Leaders : Manufacturing, utilities, and infrastructure organizations need market data to benchmark EAM investments, evaluate vendor options, and justify digital asset management initiatives.
- Investment & Private Equity Firms : Investors evaluating EAM market opportunities in Asia Pacific require comprehensive market sizing, growth forecasts, and regional dynamics to assess portfolio companies and acquisition targets.
- Channel Partners & Resellers : Distributors and resellers need regional market intelligence to identify high-growth segments, develop customer strategies, and optimize inventory and resource planning for Asia Pacific.
Key Companies in the Asia Pacific Enterprise Asset Management Market
| Company | HQ | Ownership | Strongest segments |
|---|---|---|---|
| THE SAGE GROUP PLC | United Kingdom | Public Company | Cloud accounting & financial management (Sage Intacct, Sage Accounting),On-premise and hybrid accounting (Sage 50, Sage 200),ERP and advanced business management (Sage X3, Sage 200 advanced), |
| RIGNET | United States | Private Company | Managed Communications Services,Applications and IoT,Systems Integration, |
| EPICOR SOFTWARE CORPORATION | United States | Private Company | ERP (manufacturing, distribution, financials and services),Retail Solutions (omni-channel, POS, SaaS retail),Retail Distribution and Automotive Aftermarket, |
| CONCENTRIX | United States | Public Company | Integrated CX operations (front- and back-office),Digital transformation, CX design, and consulting,Analytics, enterprise intelligence, and VOC solutions, |
| GODREJ GROUP | India | Private Company | Home appliances (refrigerators, washing machines, ACs, small appliances),Commercial appliances and cooling (medical refrigerators, deep freezers, beverage coolers),Locks, architectural hardware, and security products, |
| CERNER CORPORATION | United States | Private Company | Millennium clinical and financial EHR,Tech-enabled services and managed offerings,HealtheIntent population health and data platforms, |
| WNS GLOBAL SERVICES | India | Private Company | Banking/Financial Services and Insurance BPM,Travel, Shipping/Logistics, and Utilities BPM,Manufacturing/Retail/Consumer, Hi-tech/Professional Services, and Procurement, |
| PRESIDIO | United States | Private Company | Cloud, AI, and Modern Platform Solutions,Cybersecurity and Physical Security,Managed Services and Operational Support, |
| HINDUJA GLOBAL SOLUTIONS LIMITED | India | Public Company | Contact center outsourcing (voice CX),Back office BPM and transaction processing,Digital and technology services (AI, automation, analytics, cloud, cybersecurity), |
| IBM | United States | Public Company | Software (Hybrid Cloud & AI Platforms),Consulting,Infrastructure, |
| SAP | Germany | Public Company | SAP S/4HANA (ERP and finance-centric suites),SAP SuccessFactors and HR-related solutions,SAP Business Technology Platform and integration/automation, |
| ORACLE | United States | Public Company | Cloud Applications (Fusion ERP/EPM/SCM/HCM, NetSuite, Oracle Health, CX),Cloud and License Infrastructure (Database, Autonomous DB, MySQL, Java, Middleware, OCI IaaS/PaaS),Hardware and Engineered Systems, |
| IFS | Peru | Public Company | Retail & Commercial Banking (loans, deposits, current accounts),Insurance (life annuities, life, retail lines),Wealth & Asset Management (brokerage, mutual and investment funds), |
| HEXAGON AB | Sweden | Public Company | Manufacturing Intelligence (metrology, CAD/CAM, CAE, production software),Geosystems (surveying, laser scanning, airborne/mobile mapping),Autonomous Solutions & Positioning (GNSS, anti-jam, machine control, autonomy), |
| TRIMBLE | United States | Public Company | Construction lifecycle software and platforms (BIM, VDC, project management, owner solutions),Field hardware, machine control, and asset monitoring systems,Positioning services (VRSNow, RTX family, xFill), |
| APTEAN | United States | Private Company | Industry-specific ERP,Transportation Management Systems (TMS),Product Lifecycle Management (PLM), |
| SERVICENOW | United States | Public Company | IT Service Management & IT Operations Management,Customer & Field Service Management,Employee Workflows (HR, Workplace, Legal), |
| RAMCO | India | Public Company | Aviation, Aerospace & Defense,ERP (EAM, production, finance, supply chain, projects, facilities),Payroll & HR (daily HR, workspace, managed services, BInGO, Chia AI), |
| CENTRALSQUARE | United States | Private Company | Public Safety & 911 (CAD, RMS, NG911),Justice (court, records, corrections),Government Operations (finance, tax, asset, permitting), |
THE SAGE GROUP PLC
The Sage Group PLC is a United Kingdom-based public company founded in 1981 that employs 11,094 people. The company provides business management software and services to small and medium-sized enterprises.
RIGNET
RigNet is a United States-based private company founded in 2000 with 658 employees. The company specializes in satellite communications and connectivity solutions.
EPICOR SOFTWARE CORPORATION
Epicor Software Corporation is a United States-based private company founded in 1972 with 4,600 employees. The company develops enterprise resource planning and business management software solutions.
CONCENTRIX
Concentrix is a United States-based public company founded in 2004 with 455,000 employees. The company provides customer engagement and business services across multiple industries globally.
GODREJ GROUP
Godrej Group is an India-based private company founded in 1897 with 13,316 employees. The company operates across diverse sectors including consumer goods, real estate, and industrial products.
CERNER CORPORATION
Cerner Corporation is a United States-based private company founded in 1979 with 25,150 employees. The company develops health information technology solutions and electronic health record systems.
WNS GLOBAL SERVICES
WNS Global Services is an India-based private company founded in 1998 with 66,085 employees. The company offers business process management and IT services to clients worldwide.
PRESIDIO
Presidio is a United States-based private company founded in 2003 with 2,900 employees. The company provides IT solutions, services, and managed services.
HINDUJA GLOBAL SOLUTIONS LIMITED
Hinduja Global Solutions Limited is an India-based public company founded in 1973 with 17,110 employees. The company offers business process outsourcing and IT services globally.
IBM
IBM is a United States-based public company founded in 1911 with 264,300 employees. The company provides cloud computing, artificial intelligence, and enterprise IT solutions and services.
SAP
SAP is a Germany-based public company founded in 1972 with 111,038 employees. The company develops enterprise resource planning software and cloud-based business solutions.
ORACLE
Oracle is a United States-based public company founded in 1977 with 141,000 employees. The company provides database software, cloud computing, and enterprise business solutions.
IFS
IFS is a Peru-based public company founded in 1897 with 9,229 employees. The company develops enterprise software solutions for asset-intensive industries.
HEXAGON AB
Hexagon AB is a Sweden-based public company founded in 1975 with 16,118 employees. The company provides digital solutions and software for industrial and geospatial applications.
TRIMBLE
Trimble is a United States-based public company founded in 1978 with 11,500 employees. The company develops positioning, navigation, and mobile solutions for various industries.
APTEAN
Aptean is a United States-based private company founded in 2012 with 1,400 employees. The company provides enterprise resource planning and supply chain management software.
SERVICENOW
ServiceNow is a United States-based public company founded in 2004 with 29,187 employees. The company develops cloud-based workflow and IT service management software solutions.
RAMCO
Ramco is an India-based public company founded in 1997 with 1,508 employees. The company develops enterprise software solutions for aviation, logistics, and other industries.
CENTRALSQUARE
CentralSquare is a United States-based private company founded in 1981 with 467 employees. The company develops software solutions for public sector and emergency services.
Countries within Asia Pacific - compare and drill down
| Country | 2025 size (native) |
|---|---|
| China | USD 695.5 Million |
| Japan | USD 485.5 Million |
| Australia & New Zealand | USD 654.1 Million |
| Rest Of Asia Pacific | USD 341.6 Million |
Country market size visualization
Reasons to Buy this Report
- Regional Growth Intelligence : Gain comprehensive insights into Asia Pacific's 16.3% CAGR EAM market expansion, significantly outpacing global trends and identifying high-potential investment and expansion opportunities.
- Market Sizing & Forecasts : Access precise market valuations (USD 212.2M in 2025, USD 451.9M in 2030) and country-level breakdowns for Australia & New Zealand and Rest of Asia Pacific to inform strategic planning.
- Competitive Positioning : Understand regional market dynamics, customer preferences, and competitive landscape specific to Asia Pacific to develop targeted go-to-market strategies and differentiation approaches.
- Investment Decision Support : Leverage detailed market analysis to evaluate regional expansion viability, partnership opportunities, and resource allocation decisions across Asia Pacific's diverse EAM markets.
- Trend & Driver Analysis : Identify key growth drivers including digital transformation, IoT adoption, regulatory compliance, and operational efficiency demands unique to Asia Pacific organizations and industries.
Frequently asked questions
What is the current size of the Enterprise Asset Management market in Australia & New Zealand?
The Enterprise Asset Management market in Australia & New Zealand was valued at USD 212.2 million in 2025 and is projected to grow to USD 451.9 million by 2030.
What is the growth rate for the EAM market in Australia & New Zealand?
Australia & New Zealand's EAM market is growing at a compound annual growth rate (CAGR) of 16.3% from 2025 to 2030, significantly exceeding the global average.
Which industries are driving EAM adoption in Australia & New Zealand?
Key industries driving EAM adoption in Australia & New Zealand include utilities, manufacturing, public sector organizations, and infrastructure-intensive sectors seeking operational efficiency and compliance.
What technologies are shaping the EAM market in Australia & New Zealand?
Cloud-based platforms, IoT integration, artificial intelligence, predictive maintenance capabilities, and mobile-first solutions are transforming the EAM landscape in Australia & New Zealand.
Why is Australia & New Zealand's EAM market growing faster than the global average?
Australia & New Zealand's faster growth is attributed to mature IT infrastructure, high digital literacy, regulatory compliance pressures, and substantial capital investment in infrastructure modernization.
RESEARCH METHODOLOGY
This research study on the enterprise asset management market involved extensive secondary sources, including directories, IEEE Communication-Efficient: Algorithms and Systems, and the International Journal of Innovation and Technology Management, as well as paid databases. Primary sources were mainly industry experts from core and related industries, preferred enterprise asset management software providers, third-party service providers, consulting service providers, end users, and other commercial enterprises. In-depth interviews with primary respondents, including key industry participants and subject matter experts, were conducted to gather and verify critical qualitative and quantitative information, as well as assess the market’s prospects.
Secondary Research
In the secondary research process, various sources were referred to identify and collect information for this study. Secondary sources included annual reports, press releases, and investor presentations of companies; white papers, journals, and certified publications; and articles from recognized authors, directories, and databases. The data was also collected from other secondary sources, such as journals, government websites, blogs, and vendors’ websites. Additionally, the enterprise asset management spending of various countries was extracted from the respective sources.
Primary Research
In the primary research process, various sources from the supply and demand sides were interviewed to obtain qualitative and quantitative information on the market. The primary sources from the supply side included various industry experts, such as chief experience officers (CXOs), vice presidents (VPs), and directors specializing in business development, marketing, and enterprise asset management services. It also included key executives from enterprise asset management vendors, system integrators (SIs), professional service providers, industry associations, and other key opinion leaders.
Breakup of Primary Profiles:
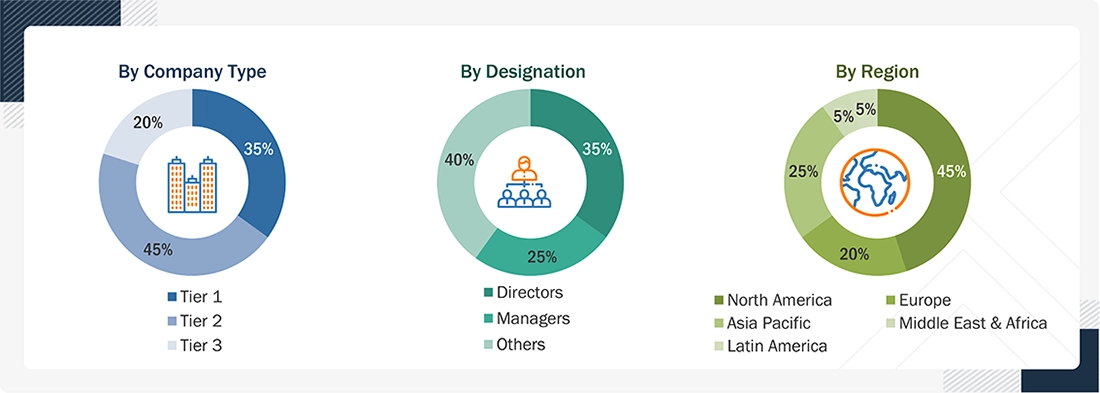
Note: Tier 1 companies’ revenues are more than USD 10 billion; tier 2 companies’ revenues range between USD 1 and 10 billion; and tier 3 companies’ revenues range between USD 500 million and USD 1 billion. Other designations include sales, marketing, and product managers.
Source: Industry Experts
To know about the assumptions considered for the study, download the pdf brochure
Market Size Estimation
Multiple approaches were adopted to estimate and forecast the enterprise asset management market. The first approach involved estimating the market size based on companies’ revenue from the sale of enterprise asset management products.
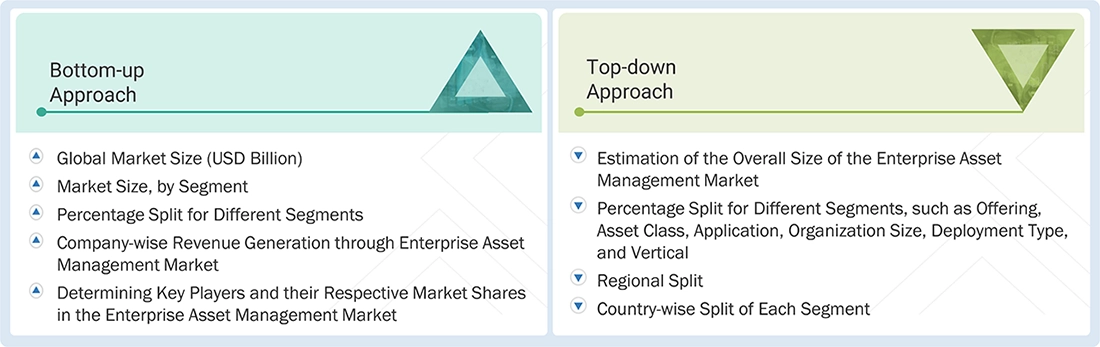
Market Size Estimation Methodology: Top-down Approach
The top-down approach prepared an exhaustive list of all the vendors offering products in the enterprise asset management market. The revenue contribution of the market vendors was estimated through annual reports, press releases, funding, investor presentations, paid databases, and primary interviews. Each vendor’s offerings were evaluated based on offering, platform module, technology, deployment mode, end user, and region. The markets were triangulated through primary and secondary research. The primary procedure included extensive interviews for key insights from industry leaders, such as CIOs, CEOs, VPs, directors, and marketing executives. The market numbers were further triangulated with the existing MarketsandMarkets repository for validation.
Market Size Estimation Methodology: Bottom-up Approach
The bottom-up approach identified the adoption rate of enterprise asset management products across different verticals in key countries, considering the regions that contribute the most to the market share. For cross-validation, the adoption of enterprise asset management products among enterprises and other use cases for their regions was identified and extrapolated. Use cases identified in different areas were weighed for the market size calculation.
Based on the market numbers, the regional split was determined by primary and secondary sources. The procedure included an analysis of the enterprise asset management market’s regional penetration. Based on secondary research, the regional spending on Information and Communications Technology (ICT), socioeconomic analysis of each country, strategic vendor analysis of major enterprise asset management service providers, and organic and inorganic business development activities of regional and global players were estimated.
Enterprise Asset Management Market : Top-Down and Bottom-Up Approach
Data Triangulation
After determining the overall market size using the market size estimation processes as explained above, the market was split into several segments and subsegments. Data triangulation and market breakup procedures were employed, wherever applicable, to complete the overall market engineering process and arrive at the exact statistics of each market segment and subsegment. The overall market size was then used in the top-down approach to estimate the size of other individual markets by applying percentage splits to the market segmentation.
Market Definition
The enterprise asset management market comprises software and services that enable organizations to systematically manage physical assets, including equipment, machinery, vehicles, infrastructure, and facilities, throughout their lifecycle. EAM solutions support asset planning, acquisition, operation, maintenance, performance optimization, and disposal, with capabilities designed to improve asset reliability, operational efficiency, safety, compliance, and lifecycle value.
Key Stakeholders
- Maintenance Managers
- Asset Managers
- Facility Managers
- Operations Managers
- Engineers (Mechanical, Electrical, and Civil)
- IT/Technology Teams
- Procurement Teams
- Safety & Compliance Officers
- Plant/Production Managers
- Service Technicians
- Inventory & Warehouse Managers
- Energy & Utilities Managers
- Project Managers
Report Objectives
- To define, describe, and forecast the enterprise asset management market based on offering (solutions and services), by application (asset lifecycle management, operation management, maintenance management, compliance & safety, reporting & analytics and other applications), by deployment type (cloud, on-premises), by asset class (linear asset, production equipment, fleet & mobility assets, fixed/facility assets/infrastructure, and others) by organization size (large enterprises, small and medium-sized enterprises), by vertical (manufacturing, energy & utilities, oil & gas, transportation & logistics, healthcare & life sciences, government & public sector, and other verticals)
- To provide detailed information on major factors influencing market growth (drivers, restraints, opportunities, and challenges) across enterprise asset management, asset lifecycle management, maintenance management, and aftermarket transformation
- To strategically analyze micro markets with respect to individual growth trends, adoption patterns, and their contribution to the overall enterprise asset management market
- To analyze market opportunities for stakeholders and present a comprehensive competitive landscape of leading enterprise asset management vendors, OEM aftermarket players, and service providers
- To project the market size and its submarkets in terms of value (USD million) across five key regions (North America, Europe, Asia Pacific, Middle East & Africa, Latin America), along with an analysis of their respective major countries
- To strategically profile leading companies and provide an in-depth evaluation of their core competencies, product portfolios, technology capabilities, and market positioning
- To examine competitive developments, including product launches, software upgrades, partnerships, integrations, strategic expansions, and mergers & acquisitions across the enterprise asset management ecosystem
Available customizations:
With the given market data, MarketsandMarkets offers customizations according to the company’s specific needs. The following customization options are available for the report:
Product Analysis
- The product matrix provides a detailed comparison of the product portfolio of each company.
Geographic Analysis based on feasibility
- Further breakup of the North American enterprise asset management market
- Further breakup of the European enterprise asset management market
- Further breakup of the Asia Pacific enterprise asset management market
- Further breakup of the Middle East & Africa enterprise asset management market
- Further breakup of the Latin American enterprise asset management market
Company Information
-
Detailed analysis and profiling of additional market players (up to five)
Get the Full Enterprise Asset Management Market Report
Full forecast, segment splits, and company analysis for all Enterprise Asset Management Market.
- US Enterprise Asset Management Market
- Canada Enterprise Asset Management Market
- UK Enterprise Asset Management Market
- Germany Enterprise Asset Management Market
- France Enterprise Asset Management Market
- Italy Enterprise Asset Management Market
- China Enterprise Asset Management Market
- Japan Enterprise Asset Management Market
- UAE Enterprise Asset Management Market
- Saudi Arabia Enterprise Asset Management Market
- South Africa Enterprise Asset Management Market
- Brazil Enterprise Asset Management Market
- Mexico Enterprise Asset Management Market
- Rest Of Europe Enterprise Asset Management Market
- Rest Of Asia Pacific Enterprise Asset Management Market
- GCC Countries Enterprise Asset Management Market
Need a Tailored Report?
Customize this report to your needs
Get 10% FREE Customization
Customize This Report
