
Rest Of Asia Pacific Fintech as a Service Market (2025-2030)

The Rest Of Asia Pacific Fintech as a Service Market was valued at $23040.6 Million in 2025 and projected to reach to $49998.6 Million by 2030, representing a compound annual growth rate of CAGR 16.8%. Rest Of Asia Pacific is positioned as one of the most dynamic regions for Fintech as a Service growth, driven by a young, tech-savvy population and increasing financial inclusion initiatives.


| Market Size in | USD 26.32 MN |
| Market Forecast in | |
| CAGR | |
| Forecast Period | |
| Units Considered | Value (USD MN) |
Rest Of Asia Pacific Fintech as a Service Market Trends and Insights
- The region is projected to grow substantially to $49,998.6 million by 2030, driven by increasing digital adoption, regulatory modernization, and rising demand for scalable financial technology solutions.
- Rest Of Asia Pacific's growth trajectory significantly outpaces global trends, reflecting the region's emerging fintech ecosystem and expanding middle-class consumer base seeking innovative financial services. The Fintech as a Service sector in Rest Of Asia Pacific is characterized by accelerating investment in cloud-based banking infrastructure, API-driven platforms, and embedded finance solutions.
- Rest Of Asia Pacific's 16.8% compound annual growth rate underscores strong market fundamentals, including supportive government policies, growing smartphone penetration, and increasing collaboration between traditional financial institutions and fintech providers.
- By 2030, Rest Of Asia Pacific is expected to consolidate its position as a critical hub for fintech innovation and service delivery across the broader Asia Pacific region..
Key Market Statistics
- CAGR (2025-2030) CAGR 16.8%
- Market Size, 2025 ~USD 23040.6 Million
- Forecast, 2030 ~USD 49998.6 Million
- Country Rest Of Asia Pacific
Rest Of Asia Pacific Fintech as a Service Market Overview
Rapid Market Expansion :
Rest Of Asia Pacific's Fintech as a Service market is projected to more than double from $23,040.6 million in 2025 to $49,998.6 million by 2030, representing a robust 16.8% CAGR that outpaces the global average of 14%.
Digital Adoption Acceleration :
The region is experiencing unprecedented digital transformation, with increasing smartphone penetration and internet connectivity driving demand for cloud-based financial technology solutions across emerging economies.
Regulatory Modernization :
Governments across Rest Of Asia Pacific are implementing progressive fintech regulations and sandbox frameworks, creating favorable conditions for innovation and attracting both domestic and international fintech service providers.
Scalable Solutions Demand :
Rising demand from SMEs and financial institutions for cost-effective, scalable fintech infrastructure is fueling adoption of FaaS platforms, enabling businesses to rapidly deploy financial services without significant capital investment.
Rest Of Asia Pacific Fintech as a Service Market Dynamics
- The region's expanding middle class and growing e-commerce ecosystem are creating substantial opportunities for FaaS providers to deliver payment solutions, lending platforms, and digital banking services.
- Regulatory support and government digitalization efforts are accelerating market maturation across the region. By 2030, Rest Of Asia Pacific is expected to capture significant market share as enterprises increasingly adopt FaaS models to enhance operational efficiency and reduce time-to-market for financial products.
- The convergence of mobile-first strategies, API-driven architectures, and emerging technologies like blockchain will further propel market growth.
- Strategic partnerships between global fintech leaders and regional players will be critical to capturing the region's substantial growth potential..
Market Ecosystem
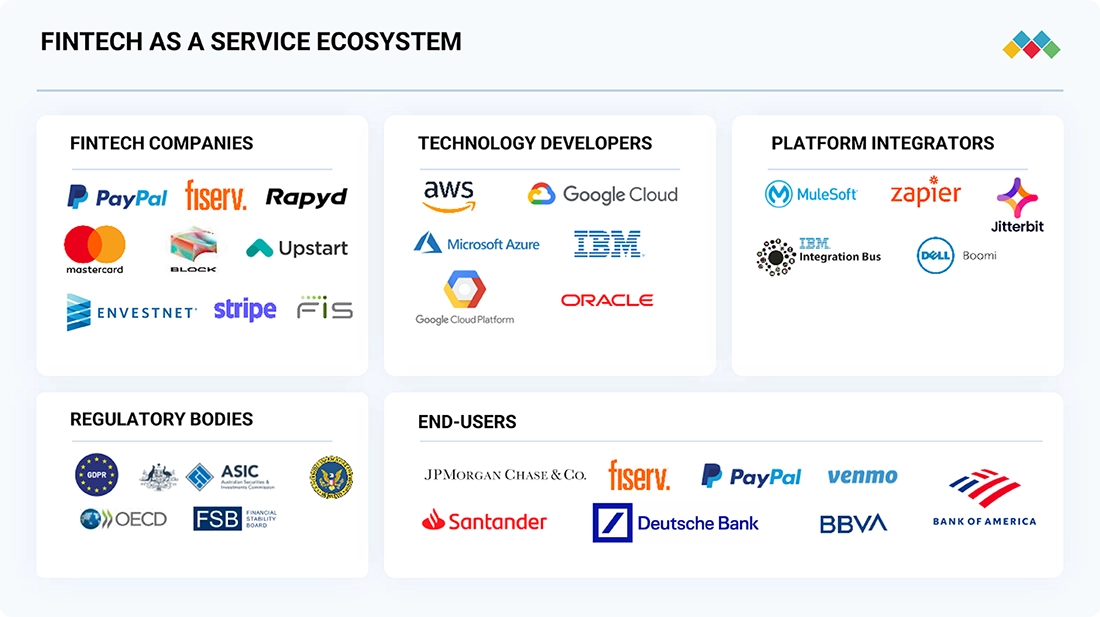
Fintech as a Service Market: COMMERCIAL USE CASES ACROSS INDUSTRIES
| COMPANY | USE CASE DESCRIPTION | BENEFITS |
|---|---|---|
 |
PayMyTuition is a fintech company specializing in providing global payment solutions to educational institutions and their students. Sending and receiving tuition payments across borders became a major challenge for both students and universities. Traditional methods, such as wire transfers and credit cards, can be slow and expensive, limiting accessibility for students worldwide. PayMyTuition wanted a solution that can offer different local payment options, quick and cost-efficient money transfers, quick responsiveness to changing customer expectations and expansion of business across Latin America and Asia Pacific. | PayMyTuition has successfully expanded its reach and gained access to millions of new customers by utilizing Rapyd Collect. Rapyd’s platform has enabled PayMyTuition to add more than 38 local payment methods, making it more convenient and accessible for millions of consumers worldwide. PayMyTuition has been able to streamline its payment collection process and reduce the complexity of cross-border transactions. This has resulted in faster and more efficient payment processing, reducing the time and resources required for administrative tasks. |
 |
Zalando needed a payments partner that could help the business scale in both new and existing markets while optimizing acceptance rates, reducing fraud, and delivering a fast and frictionless checkout process. | FIS Exemption Engine is a PSD2 solution that minimizes friction at checkout, reduces costs, and protects revenue. Integrating the Exemption Engine solution delivered a premium customer payment experience while optimizing acceptance, reducing fraud, ensuring compliance with PSD2 and scaling with growth. This helped Zalando minimize exemptions to deliver a fast, secure, seamless payment experience while reducing fraud and risk by analyzing transaction data. |
 |
Tradera’s seller base is mostly Swedish; buyers are mostly from across Scandinavia and the European Economic Area. Marketplaces that act as intermediaries for buyers and sellers need to comply with PSD2 requirements and the enforcement of the 4th European Union Directive for Anti-Money Laundering. | Tradera implemented a customized platform of two unique PayPal products: Hyperwallet and Braintree. Hyperwallet’s “Know Your Payee” Program is an identification and verification system. It is specifically aligned with these regulatory requirements that involve the collection and verification of individual or business information which removed friction by offering a flexible, seamless and secure payment experience. |
 |
Scaling up online operations and adopting multiple payment gateways led to difficulties in managing and tracking performance. However, fluctuating transaction success rates and a lack of insights into payment errors and customer drop-offs created hurdles in providing a seamless payment experience. | The implementation of Razorpay’s Optimizer brought about a positive transformation in FabIndia’s payment processing landscape. Real-time insights empowered proactive monitoring of transaction success rates, resulting in a substantial increase, contributing to happier customers, and boosting revenue. Access to Optimizer’s detailed Payment Performance Report gave FabIndia a deeper understanding of their Payment Gateway rule sets. This empowered them to make necessary adjustments, optimizing transaction routing and ultimately improving payment success rates. |
Logos and trademarks shown above are the property of their respective owners. Their use here is for informational and illustrative purposes only.
Related Ecosystem
Software And Services
- Natural Language Processing (NLP)
- Machine Learning
- Supply Chain Management
- Predictive Analytics
- Image Sensors
- International Business Machines Corporation
- MICROSOFT CORPORATION
- Oracle Corporation
- SAP SE
- Amazon.com, Inc.
Key Takeaways
- Rest Of Asia Pacific's Fintech as a Service market is valued at $23,040.6 million in 2025 and is forecast to reach $49,998.6 million by 2030, representing a 16.8% CAGR.
- Rest Of Asia Pacific demonstrates significantly higher growth momentum than the global average of 14% CAGR, driven by digital transformation and regulatory enablement.
- Rest Of Asia Pacific's market expansion is fueled by rising fintech adoption, API-first banking models, and embedded finance integration across emerging economies.
- Rest Of Asia Pacific is positioned as a strategic growth region for fintech service providers seeking to capitalize on underbanked populations and digital-first consumer segments.
Fintech as a Service Market Report Scope
| Report Metric | Details |
|---|---|
| Base Year | 2025 |
| Fastest Growing Segment | TOKENIZATION PLATFORMS (Digital Assets & Currencies) |
| Forecast Period | 2025-2030 |
| Growth Rate | CAGR of 14% from 2025 to 2030 |
| Largest Segment | PUBLIC CLOUD (Deployment Model) |
| Market Size Base Year (Billions) | ~USD 470.62 (2025) |
| Revenue Forecast (Billions) | ~USD 906.14 (2030) |
| Segments Covered | Type, Banking, Payment, Insurance, Regtech, Lending, Wealth Management, Digital Assets & Currencies, Cybersecurity, Deployment Model, End User, Payments, Offering, Transaction Type, Payment Method, Vertical |
Rest Of Asia Pacific Fintech as a Service Market Report Segmentation
16 segment dimensions are covered across the global market.
By Type
- Banking
- Cybersecurity
- Digital Assets & Currencies
- Insurance
- Lending
- Other Types
- Payments
- Regtech
- Wealth Management
By Banking
- Core Banking-As-A-Platform
- Customer Onboarding & Account Management
By Payment
- Cross-Border Remittance Platforms
- Payment Processing-As-A-Service
By Insurance
- Claims Automation
- Policy Management Platforms
By Regtech
- Compliance & Regulatory Support
- Kyc Verification
By Lending
- Bnpl
- Embedded Lending Apis
By Wealth Management
- Client Onboarding & Risk Profiling
- Money Management
By Digital Assets & Currencies
- Crypto-As-A-Service
- Tokenization Platforms
By Cybersecurity
- Fraud Detection
- Identity Verification Services
By Deployment Model
- Hybrid
- Private Cloud
- Public Cloud
By End User
- Banks
- Consumers
- Governments
- Insurance Companies
- Nbfcs
- Other End Users
By Payments
- Cross-Border Remittance Platforms
- Payment Processing-As-A-Service
By Offering
- Services
- Solutions
By Transaction Type
- Cross-Border
- Domestic
By Payment Method
- Ach
- Credit Card
- Credit/Debit/Virtual Cards
- Debit Card
- Digital Wallets
- Ewallet
- Other Payment Methods
By Vertical
- Bfsi
- Government And Utilities
- Healthcare
- It & Ites
- Media & Entertainment
- Media And Entertainment
- Other Verticals
- Real Estate
- Retail
- Retail & E-Commerce
- Telecom
- Transportation & Logistics
- Travel & Hospitality
- Travel And Hospitality
Target Audience
- Fintech Service Providers : FaaS companies need Rest Of Asia Pacific-specific market data to identify growth opportunities, assess regional demand for scalable solutions, and develop localized service offerings.
- Financial Institutions : Banks and non-bank financial companies require regional market intelligence to evaluate FaaS partnerships, understand competitive threats, and plan digital transformation initiatives in Rest Of Asia Pacific.
- Technology Investors : VC firms and private equity investors need detailed regional forecasts and growth drivers to identify promising fintech investment opportunities and validate funding decisions in Rest Of Asia Pacific.
- Enterprise Decision Makers : C-suite executives and business strategists need Rest Of Asia Pacific market insights to guide technology investments, vendor selection, and digital infrastructure modernization strategies.
- Regulatory & Policy Bodies : Government agencies and regulators require regional market data to inform fintech policy development, sandbox frameworks, and digital financial inclusion initiatives across Rest Of Asia Pacific.
Reasons to Buy this Report
- Regional Growth Validation : Confirm that Rest Of Asia Pacific's 16.8% CAGR significantly outpaces global growth, validating investment and expansion strategies in this high-potential region.
- Market Sizing & Forecasting : Access precise market valuations ($23.0B in 2025, $50.0B in 2030) to support financial planning, budget allocation, and revenue projections specific to Rest Of Asia Pacific operations.
- Competitive Positioning : Understand regional market dynamics, regulatory landscape, and digital adoption patterns to identify competitive advantages and differentiation opportunities in Rest Of Asia Pacific.
- Investment Decision Support : Leverage detailed regional insights to evaluate market entry strategies, partnership opportunities, and resource allocation decisions for Rest Of Asia Pacific expansion.
- Strategic Planning Intelligence : Utilize comprehensive regional data on digital transformation drivers and scalability demand to develop targeted go-to-market strategies for Rest Of Asia Pacific markets.
Frequently asked questions
What is the current market size of Fintech as a Service in Rest Of Asia Pacific?
Rest Of Asia Pacific's Fintech as a Service market is estimated at $23,040.6 million in 2025, with strong growth anticipated through the forecast period.
What is the projected market size for Rest Of Asia Pacific by 2030?
Rest Of Asia Pacific is forecast to reach $49,998.6 million in Fintech as a Service market value by 2030, nearly doubling from 2025 levels.
What is the CAGR for Rest Of Asia Pacific's Fintech as a Service market?
Rest Of Asia Pacific's Fintech as a Service market is expected to grow at a compound annual growth rate of 16.8% from 2025 to 2030.
How does Rest Of Asia Pacific's growth compare to global trends?
Rest Of Asia Pacific's 16.8% CAGR significantly exceeds the global average of 14%, reflecting the region's accelerated digital financial transformation and market maturation.
What factors are driving growth in Rest Of Asia Pacific's Fintech as a Service market?
Rest Of Asia Pacific's growth is driven by increasing smartphone adoption, regulatory modernization, rising demand for embedded finance, API-driven banking solutions, and collaboration between traditional and fintech institutions.
RESEARCH METHODOLOGY
This research study on the Fintech as a Service market involved extensive secondary sources, directories, and several journals, databases, such as D&B Hoovers, Bloomberg Businessweek, and Factiva, to identify and collect information useful for this technical, market-oriented, and commercial study of the Fintech as a Service market. Primary sources were industry experts from core and related industries, preferred system developers, service providers, resellers, partners, and organizations related to the various segments of the industry’s value chain. In-depth interviews were conducted with different primary respondents, including key industry participants and subject-matter experts, to obtain and verify critical qualitative and quantitative information, as well as to assess the market’s prospects. These included key industry participants, subject-matter experts, C-level executives of key companies, and industry consultants. Primary sources were mainly industry experts from the core and related industries, preferred Fintech as a Service providers, third-party service providers, consulting service providers, end users, and other commercial enterprises. In-depth interviews were conducted with various primary respondents, including key industry participants and subject matter experts, to obtain and verify critical qualitative and quantitative information and assess growth prospects.
Secondary Research
The market size of companies offering Fintech as a Service was determined based on secondary data available through paid and unpaid sources. It was also arrived at by analyzing the product portfolios of major companies and rating the companies based on their performance and quality. In the secondary research process, various sources were referred to for identifying and collecting information for this study. Secondary sources included annual reports, press releases, and investor presentations of companies; white papers, journals, and certified publications; and articles from recognized authors, directories, and databases. The data was also collected from other secondary sources, such as journals and related magazines. Fintech as a Service spending in various countries was extracted from the respective sources. Secondary research was mainly used to obtain the key information related to the industry’s value chain and supply chain to identify key players, market classification, and segmentation according to offerings of major players; industry trends related to offering, deployment, application, and regions; and key developments from both market and technology-oriented perspectives.
Primary Research
In the primary research process, various primary sources from both the supply and demand sides were interviewed to obtain qualitative and quantitative information for the report. The primary sources from the supply side included industry experts, such as Chief Executive Officers (CEOs), Vice Presidents (VPs), marketing directors, technology and innovation directors, and related key executives from various key companies and organizations providing Fintech as a Service solutions and services. The primary sources from the demand side included end users, such as Chief Information Officers (CIOs), consultants, service professionals, technicians and technologists, and managers at public and investor-owned utilities.
In the market engineering process, top-down and bottom-up approaches were extensively used, along with several data triangulation methods, to perform market estimation and market forecasting for the overall market segments and subsegments listed in the report. Extensive qualitative and quantitative analyses were performed on the complete market engineering process to list key information/insights throughout the report.
After the complete market engineering (including calculations for market statistics, market breakup, market size estimations, market forecasting, and data triangulation), extensive primary research was conducted to gather information. Primary research was conducted to identify the segmentation, industry trends, key players, competitive landscape, and key market dynamics, such as drivers, restraints, opportunities, and challenges.
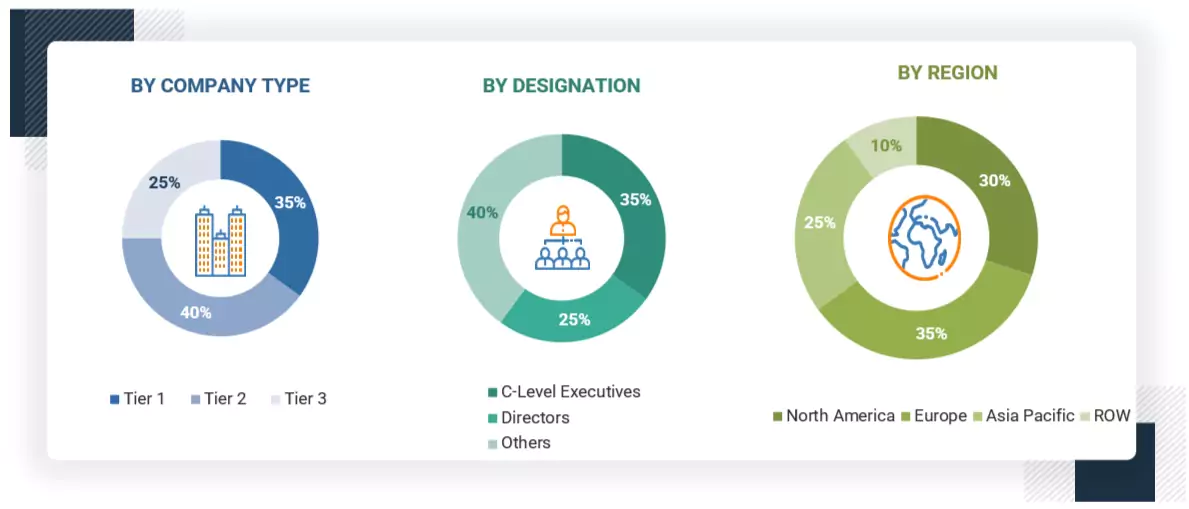
Note 1: Tier 1 companies have revenues greater than USD 10 billion; tier 2 companies' revenues range
between USD 1 and 10 billion; and tier 3 companies' revenues range between USD 500 million and 1 billion
Note 2: Others include sales, marketing, and product managers.
Source: Secondary Literature, Interviews with Experts, and MarketsandMarkets Analysis
To know about the assumptions considered for the study, download the pdf brochure
Market Size Estimation
Multiple approaches were adopted to estimate and forecast the Fintech as a Service market. The first approach involved estimating the market size by summing up the companies’ revenue generated through the sale of services.
The research methodology used to estimate the market size included the following:
- We used primary and secondary research to determine the revenue contributions of the major market participants in each country after secondary research helped identify them.
- Throughout the process, we obtained critical insights by conducting in-depth interviews with industry professionals, including directors, CEOs, VPs, and marketing executives, and by reading the annual and financial reports of the top firms in the market.
- We used primary sources to verify all percentage splits and breakups, which we calculated using secondary sources.
Fintech as a Service Market : Top-Down and Bottom-Up Approach
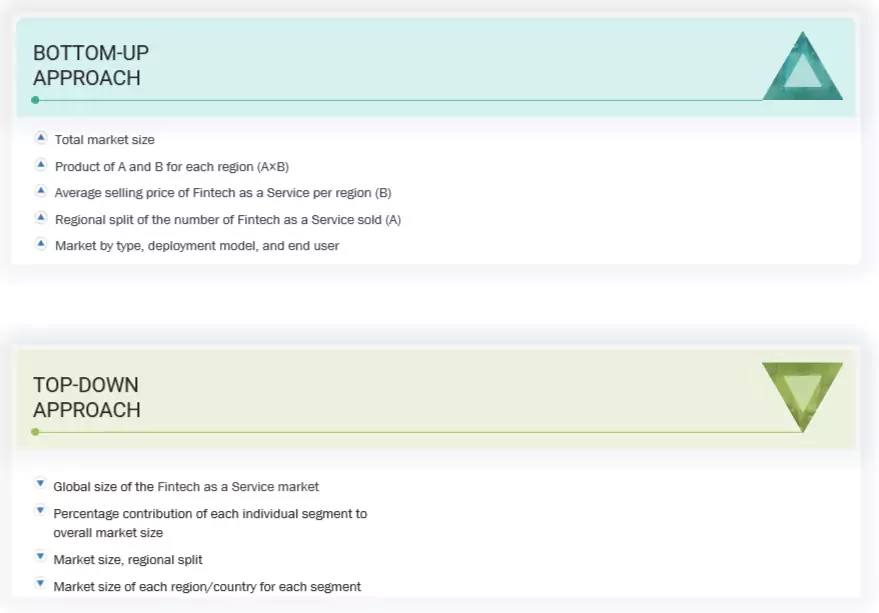
Data Triangulation
Once the overall market size was determined, we divided the market into segments and subsegments using the previously described market size estimation procedures. When required, market breakdown and data triangulation procedures were employed to complete the market engineering process and specify the exact figures for every market segment and subsegment. The data was triangulated by examining several variables and patterns from the government entities' supply and demand sides.
Market Definition
Fintech as a Service (FaaS) is a cloud-based model in which third-party providers offer modular financial technology solutions, such as payments, banking, and lending, via APIs or white-label platforms. It enables businesses to seamlessly integrate and offer branded financial services without developing complex infrastructure, reducing costs and time to market.
Stakeholders
- Solution Architects
- CISOs
- Data Privacy Officers
- Chief Identity Officers
- Government Bodies and Public Safety Agencies
- Project Managers
- Developers
- Business Analysts
- Quality Assurance (QA)/Test Engineers
- Providers of Fintech as a Service Solutions and Services
- Consulting Firms
- Third-party Vendors
- Investors and Venture Capitalists
- Technology Providers
Report Objectives
- To define, describe, and forecast the Fintech as a Service market in terms of value
- To provide detailed information regarding drivers, restraints, opportunities, and challenges influencing the growth of the market
- To forecast the market by type, deployment model, end user, and region
- To forecast the market size of segments for five main regions: North America, Europe, Asia Pacific, the Middle East & Africa, and Latin America
- To analyze the opportunities in the market and provide details of the competitive landscape for stakeholders and market leaders
- To profile the key market players, including top vendors and startups; provide a comparative analysis based on business overviews, regional presence, product offerings, business strategies, and key financials; and provide a detailed competitive landscape of the market
- To analyze the competitive developments, such as mergers & acquisitions (M&A), product launches/enhancements, agreements, partnerships, collaborations, expansions, and R&D activities, in the market
Available Customizations
MarketsandMarkets provides customizations based on the company's unique requirements using market data. The following customization options are available for the report:
Product Analysis
- The product matrix provides a detailed comparison of each company's portfolio.
Geographic Analysis as per Feasibility
- Further breakup of the Fintech as a Service market
Company Information
- Detailed analysis and profiling of five additional market players
Get the Full Fintech as a Service Market Report
Full forecast, segment splits, and company analysis for all Fintech as a Service Market.
- US Fintech as a Service Market
- Canada Fintech as a Service Market
- UK Fintech as a Service Market
- Germany Fintech as a Service Market
- France Fintech as a Service Market
- Italy Fintech as a Service Market
- China Fintech as a Service Market
- Japan Fintech as a Service Market
- India Fintech as a Service Market
- Rest Of Europe Fintech as a Service Market
Need a Tailored Report?
Customize this report to your needs
Get 10% FREE Customization
Customize This Report
