Asia Pacific Green Ammonia Market (2024-2029)

The Asia Pacific Green Ammonia Market was valued at $102.4 Million in 2024 and projected to reach to $2475.1 Million by 2029, representing a compound annual growth rate of 70.1%. Asia Pacific is positioned as the fastest-growing green ammonia market globally, driven by regional decarbonization commitments, energy security imperatives, and industrial demand.


| Market Size in | USD 26.32 MN |
| Market Forecast in | |
| CAGR | |
| Forecast Period | |
| Units Considered | Value (USD MN) |
Asia Pacific Green Ammonia Market Trends and Insights
- In 2024, Asia Pacific's green ammonia market was valued at $102.4 million, reflecting early-stage commercialization across major economies including India, China, Japan, and South Korea.
- By 2029, Asia Pacific is forecast to reach $2,475.1 million, representing explosive growth fueled by government incentives, renewable energy expansion, and industrial demand for clean fertilizers and fuels. The region's 70.1% compound annual growth rate significantly outpaces global trends, positioning Asia Pacific as the fastest-growing green ammonia market worldwide.
- Asia Pacific's abundant renewable energy resources, particularly solar and wind capacity, provide a competitive advantage for electrolyzer-based ammonia production.
- Strategic investments in hydrogen infrastructure and ammonia synthesis facilities across Asia Pacific are accelerating the transition from conventional to green ammonia, with applications spanning agriculture, chemicals, power generation, and maritime sectors. Asia Pacific's market expansion is underpinned by rising fertilizer demand, stringent environmental regulations, and corporate sustainability targets.
- The region's manufacturing expertise and cost-competitive production capabilities position Asia Pacific as both a major consumer and potential exporter of green ammonia by 2029..
Key Market Statistics
- CAGR (2024-2029) 70.1% CAGR
- Market Size, 2024 ~USD 102.4 Million
- Forecast, 2029 ~USD 2475.1 Million
- Geography Asia Pacific
Asia Pacific Green Ammonia Market Overview
Rapid Market Expansion :
Asia Pacific's green ammonia market is experiencing explosive growth with a 70.1% CAGR, significantly outpacing the global average of 66%. The region is projected to grow from $102.4 million in 2024 to $2,475.1 million by 2029, establishing itself as a global growth leader.
China's Market Dominance :
China leads Asia Pacific with a 2024 market size of $1,064.6 million, driven by aggressive decarbonization targets and substantial investments in green hydrogen infrastructure. The country's industrial scale and policy support position it as the regional powerhouse.
Emerging Economies Driving Adoption :
India ($138.6 million) and Japan ($147 million) are rapidly scaling green ammonia production to meet energy security needs and climate commitments. These markets represent significant growth opportunities as commercialization accelerates across the region.
Strategic Regional Positioning :
Australia ($985.9 million) and New Zealand ($64.8 million) leverage abundant renewable energy resources for green ammonia export potential. The region's geographic diversity creates multiple pathways for production, distribution, and industrial application.
Asia Pacific Green Ammonia Market Dynamics
- Major economies including China, India, Japan, and South Korea are investing heavily in green hydrogen and ammonia infrastructure, supported by government incentives and climate targets.
- The region's abundant renewable energy resources, particularly in Australia and emerging markets, create competitive advantages for production and export. By 2029, Asia Pacific's market is expected to reach $2,475.1 million, reflecting accelerating commercialization and industrial adoption.
- Key growth drivers include fertilizer industry decarbonization, power generation applications, and emerging demand from shipping and heavy industry.
- Strategic partnerships, technology transfer, and regional supply chain development will be critical to capturing the region's substantial growth potential..
Market Ecosystem
Related Ecosystem
Decarbonization
- Battery Electric Vehicle (BEV)
- Energy Management Systems
- Fuel Cell
- Fuel Cell Electric Vehicle (FCEV)
- Geographical Information System (GIS)
- TotalEnergies SE
- Siemens ag
- Mitsui & Co., Ltd.
- General Electric Company
- Thyssenkrupp ag
Energy Storage
- Energy Harvesting
- HVAC System
- Applicant Tracking System
- Battery Electric Vehicle (BEV)
- Carboxymethyl Cellulose (CMC)
- MOMENTIVE PERFORMANCE MATERIALS INC.
- Panasonic Holdings Corporation
- Lg corp
- ABB India Limited
- Byd company ltd.
On Highway Off Highway Vehicles
- Internal Combustion Engine (ICE)
- Agricultural Tractors
- Crawler Excavator
- Battery Electric Vehicle (BEV)
- Excavators
- Visteon Corporation
- Deere & Company
- AB VOLVO PENTA
- Honda Motor Co., Ltd.
- Komatsu Ltd.
Key Takeaways
- Asia Pacific's green ammonia market is projected to grow from $102.4M in 2024 to $2,475.1M by 2029, driven by a 70.1% CAGR.
- Asia Pacific's abundant renewable energy resources and manufacturing capabilities position the region as a global leader in green ammonia production.
- Government incentives, hydrogen infrastructure investments, and industrial decarbonization targets are accelerating green ammonia adoption across Asia Pacific.
- Asia Pacific's green ammonia market is expected to serve agriculture, chemicals, power generation, and maritime sectors by 2029.
Green Ammonia Market Report Scope
| Report Metric | Details |
|---|---|
| Base Year | 2024 |
| Fastest Growing Segment | LARGE-SCALE (Capacity) |
| Forecast Period | 2024-2029 |
| Growth Rate | CAGR of 66% from 2024 to 2029 |
| Largest Segment | ALKALINE WATER ELECTROLYSIS (Technology) |
| Market Size Base Year (Billions) | ~USD 0.29 (2024) |
| Revenue Forecast (Billions) | ~USD 6.16 (2029) |
| Segments Covered | Technology, Capacity, Application, Type |
Asia Pacific Green Ammonia Market Report Segmentation
4 segment dimensions are covered across the global market.
By Technology
- Alkaline Water Electrolysis
- Proton Exchange Membrane Electrolysis
- Solid Oxide Electrolysis
By Capacity
- Large-Scale
- Medium-Scale
- Small-Scale
By Application
- Industrial Feedstock
- Power Generation
- Transportation
By Type
- Chemical, Pharmaceutical,
- Fertilizers
Target Audience
- Energy & Utilities Companies : Evaluate green ammonia integration into power generation and energy portfolios. Understand Asia Pacific's renewable energy infrastructure, grid integration opportunities, and demand from industrial customers seeking decarbonized energy solutions.
- Chemical & Fertilizer Manufacturers : Assess decarbonization pathways for ammonia-dependent production. Access market data on green ammonia availability, pricing trends, and adoption rates across Asia Pacific's agricultural and chemical sectors.
- Investment & Private Equity Firms : Identify high-growth investment opportunities in Asia Pacific's green ammonia ecosystem. Evaluate market sizing, growth trajectories, and exit opportunities across production, infrastructure, and technology companies.
- Technology & Equipment Providers : Understand regional demand for green hydrogen and ammonia production technologies. Identify customer segments, infrastructure requirements, and commercialization timelines to guide product development and market expansion strategies.
- Government & Policy Organizations : Inform energy transition planning and industrial decarbonization policies. Access market intelligence on green ammonia's role in achieving climate targets and energy security objectives across Asia Pacific economies.
Countries within Asia Pacific - compare and drill down
| Country | 2025 size (native) |
|---|---|
| China | USD 1064.6 Million |
| India | USD 138.6 Million |
| Japan | USD 147 Million |
| Australia | USD 985.9 Million |
| New Zealand | USD 64.8 Million |
| Rest Of Asia Pacific | USD 74.1 Million |
Country market size visualization
Reasons to Buy this Report
- Regional Growth Intelligence : Gain comprehensive insights into Asia Pacific's 70.1% CAGR green ammonia market, with detailed analysis of country-specific dynamics, competitive landscapes, and growth trajectories across China, India, Japan, Australia, and emerging markets.
- Market Entry Strategy : Identify optimal entry points and expansion opportunities in high-growth Asia Pacific markets. Understand regulatory frameworks, investment incentives, and infrastructure development timelines specific to each major economy in the region.
- Investment Decision Support : Access quantified market forecasts and sizing data for Asia Pacific through 2029. Make informed capital allocation decisions with country-level market valuations and growth projections to guide portfolio development and partnership strategies.
- Competitive Positioning : Benchmark your organization against regional competitors and understand market consolidation trends. Identify white-space opportunities and emerging players reshaping Asia Pacific's green ammonia landscape.
- Supply Chain Optimization : Develop regional supply chain strategies leveraging Asia Pacific's renewable energy advantages and production capabilities. Understand export potential, logistics infrastructure, and cross-border trade dynamics for ammonia and derivatives.
Frequently asked questions
What is the current size of Asia Pacific's green ammonia market?
Asia Pacific's green ammonia market was valued at $102.4 million in 2024 and is forecast to reach $2,475.1 million by 2029.
What is driving growth in Asia Pacific's green ammonia market?
Growth in Asia Pacific is driven by renewable energy expansion, government incentives, rising fertilizer demand, industrial decarbonization targets, and hydrogen infrastructure investments.
Which countries are leading green ammonia development in Asia Pacific?
Major markets in Asia Pacific include India, China, Japan, and South Korea, which are investing heavily in green ammonia production facilities and hydrogen infrastructure.
What are the primary applications for green ammonia in Asia Pacific?
Asia Pacific's green ammonia is used in agriculture as a clean fertilizer, chemicals manufacturing, power generation, maritime fuel, and industrial decarbonization.
How does Asia Pacific's green ammonia growth compare to global trends?
Asia Pacific's 70.1% CAGR significantly exceeds the global CAGR of 66%, making the region the fastest-growing green ammonia market worldwide.
RESEARCH METHODOLOGY
The study involved major activities in estimating the current size of the green ammonia market. Exhaustive secondary research was done to collect information on the peer and parent markets. The next step was to validate these findings, assumptions, and sizing with industry experts across the value chain through primary research. Both top-down and bottom-up approaches were employed to estimate the total market size. Thereafter, market breakdown and data triangulation were used to estimate the market size of the segments and subsegments.
Secondary Research
This research study included secondary sources such as company annual reports, press announcements, and investor presentations, as well as white papers, certified publications, articles by renowned writers, and databases of numerous firms and associations. Secondary research has primarily been used to obtain key information about the industry's supply chain, monetary chain, total pool of key players, market classification and segmentation based on industry trends down to the lowest level, regional markets, and key developments from both market- and technology-oriented perspectives.
Primary Research
Primary research has been conducted to identify segments, industry trends, and the competitive landscape of the green ammonia market. In the primary research process, various primary sources from both the supply and demand sides have been interviewed to obtain qualitative and quantitative information for this report. Primary sources from the supply side include industry experts such as CEOs, vice presidents, marketing directors, technology and innovation directors, and related key executives from various companies and organizations operating in the green ammonia market. Various primary sources from both the supply and demand sides of the market were interviewed to obtain qualitative and quantitative information. Following is the breakdown of primary respondents:
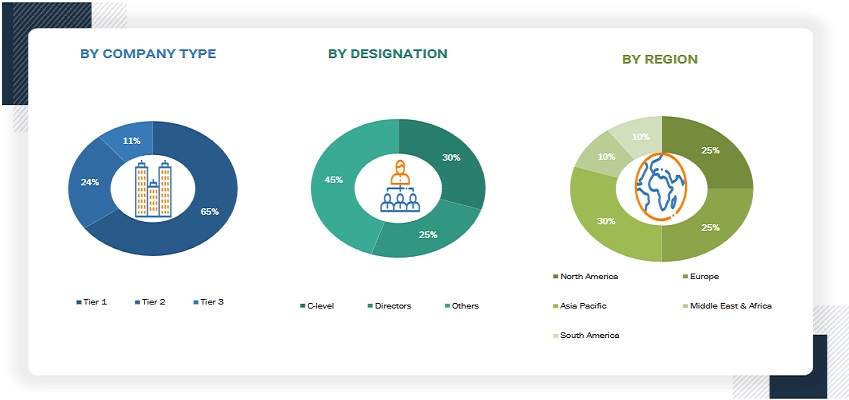
To know about the assumptions considered for the study, download the pdf brochure
Market Size Estimation
Top-down and bottom-up approaches have been used to estimate and validate the size of the green ammonia market and its dependent submarkets. Key players in the market have been identified through secondary research, and their market share in the respective regions has been obtained through both primary and secondary research. The research methodology includes the study of the annual and financial reports of the top market players and interviews with industry experts, such as chief executive officers, vice presidents, directors, sales managers, and marketing executives, to gain key quantitative and qualitative insights related to the green ammonia market. The research methodology used to estimate the market size includes the following:
- Extensive secondary research was used to identify the major players in the industry and market, and their market share was established using both primary and secondary research.
- Both primary and secondary research methods were used to assess the industry's value chain and market size.
- All percentage shares, splits, and breakdowns were obtained using secondary sources and validated by primary sources.
Green Ammonia Market Size: Top-Down and Bottom-Up Approach
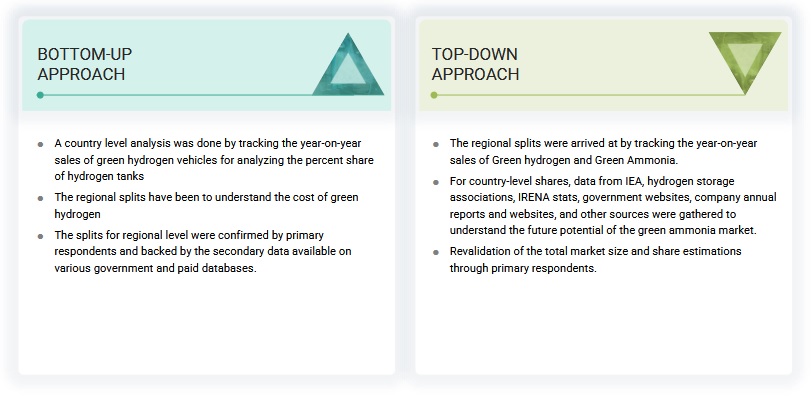
To know about the assumptions considered for the study, Request for Free Sample Report
Data Triangulation
After arriving at the overall market size from the estimation process explained below, the total market has been split into several segments and subsegments. The data triangulation and market breakdown procedures have been employed, wherever applicable, to complete the overall market engineering process and arrive at the exact statistics for all the segments and subsegments. The data has been triangulated by studying numerous factors and trends from both the demand and supply sides. Additionally, the market size has been validated using both top-down and bottom-up approaches.
Market Definition
Green ammonia refers to the manufacture of ammonia that is renewable and carbon-free. It is created by converting energy from sun, wind, and hydropower into an electrolyzer. It extracts hydrogen from water and removes nitrogen from the air using an air separation device. Ammonia is produced by reacting hydrogen and nitrogen at high temperatures and pressures. Green ammonia is used to produce carbon-neutral fertilizer products and decarbonize the food value chain, and it is likely to be used as a climate-neutral transportation fuel in the near future.
The Green ammonia market comprises revenues of companies for various end users such as transportation, power generation and industrial feedstock.
Key Stakeholders
- Industrial gas companies
- Ammonia manufacturers
- Electrolyzer and other equipment providers
- Hydrogen generation product and solution providers
- Engineering, procurement, and construction companies
- R&D laboratories
- Consulting companies from the energy & power sector
- Government and research organizations
- Renewable energy providers
Objectives of the Study
- To define, characterize, segment, and predict the value of the green ammonia market, by technology and end-use application.
- To predict the market size across four important regions: North America, Europe, Asia Pacific, and Rest of the World, as well as country-level analysis in terms of value and volume.
- To describe key elements required to produce green ammonia
- Provide statistical data on ammonia production, hydrogen generation, installed renewable capacity, and greenhouse gas emissions for each area and nation.
- To give extensive information about major drivers, restraints, opportunities, and industry-specific issues that influence the growth of the green ammonia market.
- To strategically study the green ammonia market in terms of individual growth patterns, opportunities, and contributions of each sector to the industry.
- To offer supply chain analysis, trends/disruptions effecting client business, market mapping, price analysis, and regulatory landscape for green ammonia.
- To strategically study micromarkets in terms of individual growth patterns, anticipated expansions, and their contribution to the overall market.
- Analyzing prospects for stakeholders in the green ammonia industry and creating a competitive landscape for market players
- To benchmark market participants, use the company assessment quadrant, which examines market players based on numerous characteristics within the broad areas of business and product strategies.
- To compare the main market participants based on their market share, product characteristics, and applications.
- To strategically profile important players and thoroughly study their market ranking and essential strengths.
- To examine competitive developments in the green ammonia market, such as sales contracts, agreements, investments, expansions, product launches, partnerships, joint ventures, and collaborations.
Available Customizations:
With the given market data, MarketsandMarkets offers customizations according to the specific requirements of companies. The following customization options are available for the report:
Product Analysis
- Product Matrix, which provides a detailed comparison of the product portfolio of each company
Company Information
- Detailed analyses and profiling of additional market players
Get the Full Green Ammonia Market Report
Full forecast, segment splits, and company analysis for all Green Ammonia Market.
- Germany Green Ammonia Market
- UK Green Ammonia Market
- Netherlands Green Ammonia Market
- Denmark Green Ammonia Market
- Norway Green Ammonia Market
- Spain Green Ammonia Market
- Australia Green Ammonia Market
- China Green Ammonia Market
- Japan Green Ammonia Market
- New Zealand Green Ammonia Market
- India Green Ammonia Market
- Canada Green Ammonia Market
- Mexico Green Ammonia Market
- US Green Ammonia Market
- Rest Of Europe Green Ammonia Market
- Rest Of Asia Pacific Green Ammonia Market
- Brazil Green Ammonia Market
- Chile Green Ammonia Market
- Other GCC Countries Green Ammonia Market
- Saudi Arabia Green Ammonia Market
- UAE Green Ammonia Market
Need a Tailored Report?
Customize this report to your needs
Get 10% FREE Customization
Customize This Report
