
US Optical Imaging Market (2022-2027)

The US Optical Imaging Market was valued at $264.2 Million in 2022 and projected to reach to $509.6 Million by 2027, representing a compound annual growth rate of 14.0%. The US optical imaging market is poised for significant expansion through 2027, driven by technological advancements in imaging resolution and real-time diagnostic capabilities.


| Market Size in | USD 26.32 MN |
| Market Forecast in | |
| CAGR | |
| Forecast Period | |
| Units Considered | Value (USD MN) |
US Optical Imaging Market Trends and Insights
- The US market is driven by advancing healthcare infrastructure, increasing adoption of minimally invasive diagnostic procedures, and rising demand for precision medical imaging technologies.
- In the US, optical imaging applications span endoscopy, ophthalmology, dermatology, and surgical guidance, with healthcare providers investing heavily in next-generation imaging systems. The US optical imaging sector benefits from strong regulatory frameworks, robust reimbursement policies, and significant R&D investments from both established medical device manufacturers and emerging technology companies.
- Between 2022 and 2027, the US market will experience accelerated growth as hospitals and diagnostic centers upgrade imaging capabilities and expand their service offerings.
- The US remains a key market for optical imaging innovation, with leading healthcare institutions driving clinical adoption and setting standards for imaging quality and patient outcomes..
Key Market Statistics
- CAGR (2022-2027) 14.0% CAGR
- Market Size, 2022 ~USD 264.2 Million
- Forecast, 2027 ~USD 509.6 Million
- Country US
US Optical Imaging Market Overview
Market Valuation Growth :
The US optical imaging market reached $264.2 million in 2022 and is expected to grow to $509.6 million by 2027, nearly doubling in size over the five-year forecast period.
Strong CAGR Performance :
The US market is expanding at a 14% CAGR, outpacing the global average of 13.5%, indicating robust domestic demand and market maturation in the United States.
Minimally Invasive Procedure Adoption :
US healthcare providers are increasingly adopting optical imaging for minimally invasive diagnostic and surgical procedures, driven by patient preference for reduced recovery times and lower complication rates.
Advanced Healthcare Infrastructure :
The US benefits from cutting-edge medical facilities, substantial R&D investments, and strong reimbursement policies that accelerate the adoption of precision optical imaging technologies.
US Optical Imaging Market Dynamics
- Healthcare institutions across the country are increasingly integrating optical imaging into surgical suites and diagnostic centers to enhance procedural accuracy and patient outcomes.
- The growing prevalence of chronic diseases and the shift toward value-based care models are compelling hospitals and clinics to invest in advanced imaging solutions that reduce complications and improve operational efficiency. Regulatory support from the FDA and favorable reimbursement trends from major payers are expected to further accelerate market penetration.
- Additionally, the rising demand for personalized medicine and precision diagnostics among US healthcare providers will continue to fuel innovation in optical imaging technologies.
- Strategic partnerships between medical device manufacturers and healthcare systems will likely expand market accessibility, particularly in mid-sized and rural healthcare facilities seeking to upgrade their diagnostic capabilities..
Market Ecosystem
Related Ecosystem
Key Takeaways
- The US optical imaging market is projected to nearly double from $264.2M (2022) to $509.6M (2027) at a 14.0% CAGR.
- The US market is driven by minimally invasive procedure adoption, advanced healthcare infrastructure, and strong reimbursement policies.
- In the US, optical imaging spans endoscopy, ophthalmology, dermatology, and surgical guidance applications across major healthcare systems.
- The US leads in optical imaging innovation through significant R&D investments and regulatory support from both established and emerging companies.
Optical Imaging Market Report Scope
| Report Metric | Details |
|---|---|
| Base Year | 2022 |
| Fastest Growing Segment | SOFTWARE (Product) |
| Forecast Period | 2022–2027 |
| Growth Rate | CAGR of 13.5% from 2022 to 2027 |
| Largest Segment | OPTICAL COHERENCE TOMOGRAPHY (OCT) (Technique) |
| Market Size Base Year (Billions) | ~USD 1.54 (2022) |
| Revenue Forecast (Billions) | ~USD 2.9 (2027) |
| Segments Covered | Product, Type, Technique, Application, Therapeutic Area, End User |
US Optical Imaging Market Report Segmentation
6 segment dimensions are covered across the global market.
By Product
- Cameras
- Illumination Systems
- Imaging Systems
- Lenses
- Other Products
- Software
By Type
- Optical Imaging Systems
- Spectral Imaging Systems
By Technique
- Hyperspectral Imaging (Hsi)
- Near-Infrared Spectroscopy (Nirs)
- Optical Coherence Tomography (Oct)
- Photoacoustic Tomography (Pat)
By Application
- Intra-Operative Imaging
- Pathological Imaging
By Therapeutic Area
- Cardiology
- Dermatology
- Neurology
- Oncology
- Ophthalmology
- Other Products
- Other Therapeutic Areas
By End User
- Hospitals & Clinics
- Pharmaceutical & Biotechnology Companies
- Research Laboratories
US: OPTICAL IMAGING MARKET, BY END USER, 2020–2027
| Segment | 2020 | 2021 | 2022 | 2023 | 2024 | 2025 | 2026 | 2027 | CAGR (%) |
|---|---|---|---|---|---|---|---|---|---|
| HOSPITALS & CLINICS | 254.8 | 303.5 | 271.6 | 300.5 | 340.6 | 389.5 | 449.5 | 523.2 | 14 |
| PHARMACEUTICAL & BIOTECHNOLOGY COMPANIES | 76.1 | 86.2 | 73.4 | 77.2 | 83.2 | 90.5 | 99.3 | 109.9 | 8.4 |
| RESEARCH LABORATORIES | 152.3 | 179.4 | 158.8 | 173.8 | 194.8 | 220.3 | 251.4 | 289.4 | 12.7 |
| TOTAL | 483.2 | 569.1 | 503.8 | 551.5 | 618.6 | 700.3 | 800.1 | 922.6 | 12.9 |
Target Audience
- Medical Device Manufacturers : US-based and international optical imaging device makers need market-specific data to guide product launches, pricing strategies, and distribution partnerships in the American healthcare system.
- Healthcare Facility Administrators : Hospital and surgical center leaders require market insights to justify capital expenditures on optical imaging equipment and understand competitive offerings available in the US market.
- Investment & Private Equity Firms : Investors evaluating healthcare technology opportunities need validated US market size and growth forecasts to assess portfolio companies and identify acquisition targets in optical imaging.
- Healthcare Consultants & Strategists : Consulting firms advising healthcare organizations on technology adoption and digital transformation need US-specific market data to develop evidence-based recommendations for clients.
- Regulatory & Compliance Officers : Compliance professionals in medical device companies need US market context to navigate FDA requirements, reimbursement policies, and competitive positioning within the American healthcare landscape.
Key Companies in the US Optical Imaging Market
| Company | HQ | Ownership | Strongest segments |
|---|---|---|---|
| HOYA CORPORATION | Japan | Public Company | Eyeglasses and ophthalmic lenses,Contact lenses and Eyecity retail,Medical endoscopes and surgical instruments, |
| BRUKER CORPORATION | United States | Public Company | NMR/EPR and preclinical imaging (BSI BioSpin),Mass spectrometry, molecular diagnostics, and CALID solutions,Nano analysis, X-ray, AFM, and semiconductor metrology, |
| VARIAN MEDICAL SYSTEMS, INC | United States | Private Company | Oncology Systems – Linacs and Treatment Delivery Hardware,Oncology Systems – Software, Informatics, and QA,Proton Solutions, |
| XILINX, INC. | United States | Private Company | High-end FPGAs and adaptive compute platforms,Mid/low-range PLDs and configuration devices,SoC platforms, development boards, and kits, |
| CARL ZEISS MEDITEC AG | Germany | Public Company | Ophthalmology – diagnostics and imaging,Ophthalmology – surgical (cataract, refractive, IOLs, consumables),Microsurgery – neurosurgery and spine visualization, |
| TOPCON CORPORATION | Japan | Private Company | Eye Care (OCT, retinal imaging, refraction, ophthalmic software),Positioning – Surveying instruments (total stations, GNSS, laser products),Positioning – IT construction systems, |
| CANON INC. | Japan | Public Company | Printing Business Unit,Medical Business Unit,Imaging Business Unit, |
| ABBOTT LABORATORIES INC. | United States | Public Company | Diagnostic Products,Medical Devices,Nutritional Products, |
| KONINKLIJKE PHILIPS N.V. | Netherlands | Public Company | Diagnostic Imaging (MR, CT, X-ray, Ultrasound),Image Guided Therapy Systems and Devices,Monitoring and Enterprise Informatics, |
| PERKINELMER, INC. | United States | Public Company | Diagnostics screening (prenatal, neonatal, infectious disease),Life science reagents and assays (BioLegend, AlphaLISA, Dharmacon, etc.),Instruments, imaging, and detection platforms, |
| AGFA-GEVAERT N.V. | Belgium | Public Company | Healthcare enterprise imaging and diagnostic imaging (incl. SmartXR),Analog X-ray film, hardcopy film, and chemicals,Sign and display, packaging printing (printers, inks, software), |
| HAMAMATSU PHOTONICS K.K. | Japan | Public Company | Electron Tube (incl. photomultiplier tubes, X-ray sensors),Opto-Semiconductor (photodiodes, APDs, SPADs, sensors),Imaging and Measurement Instruments (cameras, systems, software), |
| OPTOS | United Kingdom | Private Company | Standalone UWF retinal imaging (optomap, Daytona, California),OCT-integrated platforms (Silverstone, Monaco, Monacopro),Service, software, and support (viewing, reference resources, self-help), |
HOYA CORPORATION
HOYA Corporation is a Japanese public company founded in 1941 that employs 37,752 people. The company operates as a diversified manufacturer with significant global operations.
BRUKER CORPORATION
Bruker Corporation is a United States-based public company founded in 1960 with 11,085 employees. The company specializes in scientific instruments and analytical solutions.
VARIAN MEDICAL SYSTEMS, INC
Varian Medical Systems, Inc. is a United States-based private company founded in 1948 with approximately 10,000 employees. The company operates in the medical technology sector.
XILINX, INC.
Xilinx, Inc. is a United States-based private company founded in 1984 with 4,890 employees. The company operates in the semiconductor and technology industry.
CARL ZEISS MEDITEC AG
Carl Zeiss Meditec AG is a German public company founded in 1846 with 5,798 employees. The company specializes in medical technology and optical solutions.
TOPCON CORPORATION
Topcon Corporation is a Japanese private company founded in 1932 with 5,327 employees. The company operates in the optical and precision instruments industry.
CANON INC.
Canon Inc. is a Japanese public company founded in 1933 with 165,547 employees. The company is a diversified manufacturer of imaging and optical products.
ABBOTT LABORATORIES INC.
Abbott Laboratories Inc. is a United States-based public company founded in 1888 with 115,000 employees. The company operates in the healthcare and pharmaceutical sectors.
KONINKLIJKE PHILIPS N.V.
Koninklijke Philips N.V. is a Netherlands-based public company founded in 1891 with 64,317 employees. The company is a diversified technology and healthcare conglomerate.
PERKINELMER, INC.
PerkinElmer, Inc. is a United States-based public company founded in 1937 with 11,000 employees. The company provides scientific instruments and diagnostic solutions.
AGFA-GEVAERT N.V.
Agfa-Gevaert N.V. is a Belgian public company founded in 1867 with 4,211 employees. The company operates in imaging and printing technology sectors.
HAMAMATSU PHOTONICS K.K.
Hamamatsu Photonics K.K. is a Japanese public company founded in 1953 with 6,601 employees. The company specializes in photonics and optical sensor technologies.
OPTOS
Optos is a United Kingdom-based private company founded in 1992 with 302 employees. The company operates in the optical or imaging technology industry.
Reasons to Buy this Report
- Market Size & Growth Validation : Confirm the US market opportunity with precise valuation data ($264.2M in 2022) and validated growth projections ($509.6M by 2027), enabling confident investment and expansion decisions.
- Competitive Positioning Intelligence : Understand the US-specific competitive landscape, market dynamics, and regional adoption patterns to identify gaps and opportunities for product differentiation and market entry strategies.
- Reimbursement & Regulatory Insights : Access detailed analysis of US FDA approval pathways, Medicare/insurance reimbursement trends, and healthcare policy drivers that directly impact market accessibility and revenue potential.
- End-User Demand Analysis : Gain actionable insights into US hospital, surgical center, and diagnostic facility requirements, enabling targeted marketing strategies and product development aligned with regional healthcare priorities.
- Investment Decision Support : Leverage comprehensive US market data to support funding decisions, M&A strategies, and resource allocation for companies seeking to capitalize on the 14% CAGR growth opportunity.
Frequently asked questions
What is the current size of the US optical imaging market?
The US optical imaging market was valued at $264.2 million in 2022 and is expected to reach $509.6 million by 2027.
What is the growth rate of the US optical imaging market?
The US optical imaging market is growing at a compound annual growth rate (CAGR) of 14.0% from 2022 to 2027.
Which applications drive the US optical imaging market?
In the US, key applications include endoscopy, ophthalmology, dermatology, and surgical guidance, with strong adoption across hospitals and diagnostic centers.
What factors support growth in the US optical imaging market?
The US market benefits from advanced healthcare infrastructure, increasing minimally invasive procedure adoption, robust reimbursement policies, and significant R&D investments.
Why is the US a leading market for optical imaging?
The US leads in optical imaging due to strong regulatory frameworks, high healthcare spending, leading medical device manufacturers, and innovation-driven healthcare institutions.
RESEARCH METHODOLOGY
This study involved four major approaches in estimating the current optical imaging market size. Extensive research was conducted to collect information on the market as well as its peer and parent markets. The next step was to validate these findings, assumptions, and sizing with industry experts across the value chain through primary research. Both top-down and bottom-up approaches were employed to estimate the value market. After that, market breakdown and data triangulation procedures were used to estimate the market size of segments and subsegments.
Secondary Research
The secondary research process involves the widespread use of secondary sources, directories, databases (such as Bloomberg Business, Factiva, and D&B Hoovers), white papers, annual reports, companies house documents, investor presentations, and SEC filings of companies. Secondary research was used to identify and collect information useful for the extensive, technical, market-oriented, and commercial study of the optical imaging market. It was also used to obtain important information about the key players and market classification & segmentation according to industry trends to the bottom-most level, and key developments related to market and technology perspectives. A database of the key industry leaders was also prepared using secondary research.
Some of the key secondary resources referred to in this study include:
- The United States Department of Health & Human Services (HHS)
- Center for Drug Evaluation and Research (CDER)
- Center for Disease Control and Prevention
- National Institute of Biomedical Imaging and Bioengineering (NIBIB)
- Center for Devices & Radiological Health
- World Health Organisation
- American Hospital Association
- U.S. Bureau of Labor Statistics
Primary Research
In the primary research process, various sources from both the supply and demand sides were interviewed to obtain qualitative and quantitative information for this report. Primary sources from the supply side include CEOs, consultants, subject-matter experts, directors, general managers, developers, and other key opinion leaders of the various companies that offer optical imaging products. Primary sources from the demand side include industry experts such as hospital directors, research professionals, pharmaceutical company research and development head, and other medical professionals.
Primary research was conducted to identify segmentation types; industry trends; technology trends; key players; and key market dynamics such as drivers, restraints, opportunities, challenges, and key player strategies.
Market Size Estimation
The total size of the optical imaging market was arrived at after data triangulation from four different approaches, as mentioned below.
Bottom-up Approach: Revenues of individual companies were gathered from public sources and databases. Shares of the medical device cleaning businesses of leading players were gathered from secondary sources to the extent available. In certain cases, the share of the business unit was ascertained after a detailed analysis of various parameters, including product portfolio, market positioning, selling price, and geographic reach and strength. Individual shares or revenue estimates were validated through expert interviews.
Country level Analysis: The size of the global market was obtained from the annual presentations of leading players and secondary data available in the public domain. The share of optical imaging products in the overall market was obtained from secondary data and validated by primary participants to arrive at the total market. Primary participants further validated the numbers.
Primary Interviews: As a part of the primary research process, individual respondent insights on the market size and growth were taken during the interview (regional and global, as applicable). All the responses were collated, and a weighted average was taken to derive a probabilistic estimate of the market size and growth rate.
Geographic market assessment (by region & country): The geographic assessment was done using the following approaches:
Approach 1: Geographic revenue contributions/splits of leading players in the market (wherever available) and respective growth trends
Approach 2: Geographic adoption trends for individual product segments by end users and growth prospects for each of the segments (assumptions and indicative estimates validated from primary interviews)
At each point, the assumptions and approaches were validated through industry experts contacted during primary research. Considering the limitations of data available from secondary research, revenue estimates for individual companies (for the overall optical imaging market and geographic market assessment) were ascertained based on a detailed analysis of their respective product offerings, geographic reach/strength (direct or through distributors or suppliers), and the shares of the leading players in a particular region or country.
After complete market engineering with calculations for market statistics, market size estimations, market forecasting, market breakdown, and data triangulation, extensive primary research was conducted to gather information and verify and validate the critical numbers arrived at. In the complete market engineering process, both top-down and bottom-up approaches were extensively used, along with several data triangulation methods to perform market estimation and market forecasting for the overall market segments and subsegments listed in this report. Extensive qualitative and further quantitative analysis was also done from all the numbers arrived at in the complete market engineering process to list key information throughout the report.
Breakdown of Primary Interviews (Supply Side): By End-User Type, Designation, and Region
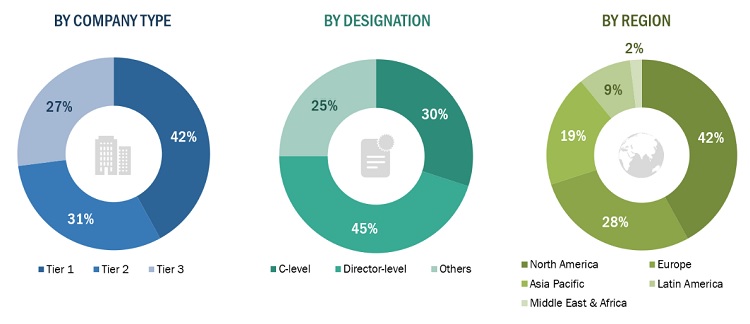
* Others include sales managers, marketing managers, and product managers
Note: Tiers of companies are defined by their total revenues; as of 2020, Tier 1>= USD 500 million, Tier 2 = USD 200 million to USD 500 million, and Tier 3<= USD 200 million
To know about the assumptions considered for the study, download the pdf brochure
Breakdown of Primary Interviews (Demand Side): By End-User Type, Designation, and Region
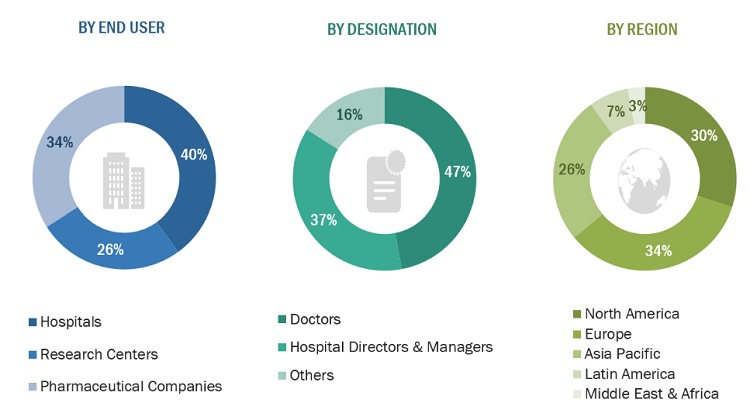
Note: Other designation includes type-c executives of hospitals and clinics.
Data Triangulation
After arriving at the market size, the total market was divided into several segments and subsegments. To complete the overall market engineering process and arrive at the exact statistics for all segments and subsegments, data triangulation and market breakdown procedures were employed wherever applicable.
Approach to derive the market size and estimate market growth
The market rankings for leading players were ascertained after a detailed assessment of their revenues from the optical imaging business using secondary data available through paid and unpaid sources. Owing to data limitations, in certain cases, the revenue share was arrived at after a detailed assessment of the product portfolios of major companies and their respective sales performance. At each point, this data was validated through primary interviews with industry experts.
Objectives of the Study
- To define, describe, and forecast the optical imaging market by product, application, end user, therapeutic area, techniques, and region.
- To provide detailed information about the major factors influencing the market growth (such as drivers, restraints, opportunities, and challenges)
- To strategically analyze micromarkets with respect to individual growth trends, prospects, and contributions to the overall market
- To analyze market opportunities for stakeholders and provide details of the competitive landscape for key players
- To forecast the size of the global market with respect to five major regions, namely, North America, Europe, Asia Pacific, Latin America, and the Middle East & Africa
- To profile the key players and comprehensively analyze their market shares and core competencies in the global market
- To track and analyze competitive developments such as partnerships, agreements, acquisitions, product launches, and expansions in the global market
Available Customizations
With the given market data, MarketsandMarkets offers customizations as per the company’s specific needs. The following customization options are available for the report:
Company Information
- Detailed analysis and profiling of additional market players
Geographic Analysis
- Further breakdown of the Rest of Asia Pacific optical imaging market into Thailand, New Zealand, and other countries.
Get the Full Optical Imaging Market Report
Full forecast, segment splits, and company analysis for all Optical Imaging Market.
- Canada Optical Imaging Market
- France Optical Imaging Market
- Germany Optical Imaging Market
- Italy Optical Imaging Market
- Spain Optical Imaging Market
- UK Optical Imaging Market
- Australia Optical Imaging Market
- China Optical Imaging Market
- India Optical Imaging Market
- Japan Optical Imaging Market
- South Korea Optical Imaging Market
- Brazil Optical Imaging Market
Need a Tailored Report?
Customize this report to your needs
Get 10% FREE Customization
Customize This Report
