
South Korea Quantum Dot Market (2024-2029)

The South Korea Quantum Dot Market was valued at $567.6 Million in 2024 and projected to reach to $1296.9 Million by 2029, representing a compound annual growth rate of 18.0%. South Korea's quantum dot market is poised for accelerated growth through 2029, driven by the country's world-class semiconductor and display manufacturing infrastructure.


| Market Size in | USD 26.32 MN |
| Market Forecast in | |
| CAGR | |
| Forecast Period | |
| Units Considered | Value (USD MN) |
South Korea Quantum Dot Market Trends and Insights
- South Korea's advanced semiconductor and display manufacturing ecosystem positions the country as a critical hub for quantum dot technology adoption, particularly in consumer electronics and next-generation display applications.
- The 18.0% compound annual growth rate reflects South Korea's strong investment in quantum dot research, development, and commercialization across display panels, lighting, and medical imaging sectors. South Korea's leadership in display technology, driven by major electronics manufacturers, accelerates quantum dot market penetration throughout the forecast period.
- South Korea's commitment to semiconductor innovation and government support for advanced materials research further strengthens market fundamentals.
- Between 2024 and 2029, South Korea is expected to capture significant market share within the Asia Pacific region, supported by increasing demand for high-performance displays and emerging applications in quantum computing and photonics..
Key Market Statistics
- CAGR (2024-2029) 18.0% CAGR
- Market Size, 2024 ~USD 567.6 Million
- Forecast, 2029 ~USD 1296.9 Million
- Country South Korea
South Korea Quantum Dot Market Overview
Market Valuation & Growth :
South Korea's quantum dot market reached $567.6 million in 2024, with a robust 18.0% CAGR projected through 2029, outpacing the global growth rate of 17.7% and demonstrating strong regional momentum.
Display Manufacturing Leadership :
South Korea's dominance in semiconductor and display manufacturing, led by companies like Samsung and LG, positions the nation as a critical hub for quantum dot technology integration in premium consumer electronics and next-generation displays.
Consumer Electronics Adoption :
Quantum dot technology is rapidly penetrating South Korea's consumer electronics sector, particularly in high-end televisions, monitors, and mobile devices, driven by domestic demand for superior color accuracy and energy efficiency.
Forecast Growth Trajectory :
The market is anticipated to expand to $1,296.9 million by 2029, representing a 128% increase over five years, reflecting accelerating commercialization and increased investment in quantum dot R&D and manufacturing capabilities.
South Korea Quantum Dot Market Dynamics
- Major domestic players are investing heavily in quantum dot technology for premium display applications, including QLED televisions and next-generation monitors.
- The convergence of advanced manufacturing capabilities, strong consumer demand for high-performance displays, and government support for semiconductor innovation creates a favorable environment for market expansion. The 18.0% CAGR reflects South Korea's strategic positioning in the global quantum dot ecosystem.
- Continued investments in R&D, coupled with increasing adoption across consumer electronics and emerging applications in automotive and industrial displays, will sustain growth momentum.
- South Korea's export-oriented economy ensures that domestic quantum dot innovations will have significant global market implications, reinforcing the country's role as a technology leader in this high-growth sector..
Market Ecosystem
Related Ecosystem
Electronics System And Components
- Sensors
- Temperature Sensors
- Pressure Sensors
- Actuators
- Image Sensors
- Lenovo
- Samsung
- Texas Instruments Incorporated
- HONEYWELL INTERNATIONAL INC.
- Teledyne Technologies Incorporated
Energy Storage
- Energy Harvesting
- HVAC System
- Applicant Tracking System
- Battery Electric Vehicle (BEV)
- Carboxymethyl Cellulose (CMC)
- MOMENTIVE PERFORMANCE MATERIALS INC.
- Panasonic Holdings Corporation
- Lg corp
- ABB India Limited
- Byd company ltd.
Key Takeaways
- South Korea's quantum dot market will more than double from $567.6M (2024) to $1,296.9M (2029), representing an 18.0% CAGR.
- South Korea's dominant display manufacturing sector drives quantum dot adoption in premium consumer electronics and next-generation televisions.
- South Korea's government-backed R&D initiatives and semiconductor expertise position the country as a regional innovation leader in quantum dot applications.
- South Korea's quantum dot market growth is supported by expanding use cases in medical imaging, lighting, and emerging quantum computing applications.
Quantum Dot Market Report Scope
| Report Metric | Details |
|---|---|
| Base Year | 2024 |
| Fastest Growing Segment | OTHER PRODUCTS (Product Type) |
| Forecast Period | 2024-2029 |
| Growth Rate | CAGR of 17.7% from 2024 to 2029 |
| Largest Segment | QUANTUM DOT DISPLAYS (Product Type) |
| Market Size Base Year (Billions) | ~USD 10.58 (2024) |
| Revenue Forecast (Billions) | ~USD 23.9 (2029) |
| Segments Covered | Display Type, Material, Product Type, Product, Vertical |
South Korea Quantum Dot Market Report Segmentation
5 segment dimensions are covered across the global market.
By Display Type
- Mini-Led
- Qd-Lcd
- Qd-Oled
By Material
- Cadmium-Based Quantum Dots
- Cadmium-Free Quantum Dots
By Product Type
- Other Products
- Quantum Dot Displays
By Product
- Qd Displays
- Qd Lasers
- Qd Led Products
- Qd Medical Devices
- Qd Other Products
- Qd Photodetectors/Sensors
- Qd Solar Cells/Modules
By Vertical
- Commercial
- Consumer
- Defense
- Healthcare
- Telecommunications
Target Audience
- Display Manufacturers : South Korean and international display manufacturers need detailed market analysis to optimize quantum dot integration strategies, assess competitive positioning, and plan production capacity investments.
- Semiconductor Companies : Semiconductor firms operating in or targeting South Korea require market-specific data to evaluate quantum dot material demand, identify partnership opportunities with local manufacturers, and guide R&D investments.
- Investment & Private Equity Firms : Investors seeking exposure to South Korea's high-growth quantum dot sector need comprehensive market forecasts, valuation benchmarks, and competitive intelligence to identify acquisition and funding opportunities.
- Technology & Component Suppliers : Suppliers of quantum dot materials, equipment, and components require South Korea-specific demand forecasts and customer insights to develop targeted sales strategies and optimize supply chain positioning.
- Government & Policy Organizations : South Korean government agencies and policy makers need market data to inform semiconductor industry strategy, R&D funding priorities, and export competitiveness initiatives in quantum dot technology.
Reasons to Buy this Report
- Regional Market Intelligence : Gain comprehensive insights specific to South Korea's quantum dot ecosystem, including market size, growth projections, and competitive dynamics that differ from global trends and other regional markets.
- Strategic Investment Decisions : Identify high-growth opportunities within South Korea's advanced manufacturing sector, enabling informed capital allocation and partnership strategies with leading domestic semiconductor and display manufacturers.
- Competitive Benchmarking : Understand South Korea's market position relative to global competitors, assess the competitive landscape dominated by Samsung and LG, and evaluate market entry or expansion strategies in this critical technology hub.
- Technology Adoption Trends : Track quantum dot adoption patterns across South Korea's consumer electronics, display, and emerging automotive sectors, providing actionable intelligence on commercialization timelines and application priorities.
- Export & Supply Chain Insights : Leverage South Korea's export-oriented economy to understand global quantum dot supply chain dynamics, manufacturing capabilities, and opportunities for component suppliers and technology partners.
Frequently asked questions
What is the current size of South Korea's quantum dot market?
South Korea's quantum dot market was valued at $567.6 million in 2024 and is projected to reach $1,296.9 million by 2029.
What is the expected growth rate for South Korea's quantum dot market?
South Korea's quantum dot market is expected to grow at a compound annual growth rate (CAGR) of 18.0% from 2024 to 2029.
Which industries drive quantum dot demand in South Korea?
South Korea's quantum dot demand is primarily driven by display manufacturing, consumer electronics, medical imaging, and emerging applications in quantum computing and photonics.
Why is South Korea a key market for quantum dot technology?
South Korea's advanced semiconductor infrastructure, dominant display manufacturers, government R&D support, and innovation ecosystem make it a critical hub for quantum dot commercialization in Asia Pacific.
What factors will support South Korea's quantum dot market growth through 2029?
South Korea's quantum dot market growth will be supported by increasing demand for premium displays, expanding medical imaging applications, government innovation initiatives, and the country's leadership in consumer electronics manufacturing.
RESEARCH METHODOLOGY
The research study involved 4 major activities in estimating the size of the quantum dot market. Exhaustive secondary research has been done to collect important information about the market and peer markets. The validation of these findings, assumptions, and sizing with the help of primary research with industry experts across the supply chain has been the next step. Both top-down and bottom-up approaches have been used to estimate the market size. Post which the market breakdown and data triangulation have been adopted to estimate the market sizes of segments and sub-segments.
Secondary Research
In the secondary research process, sources such as annual reports, press releases, and investor presentations of companies, white papers, and articles by recognized authors were referred to. Secondary research was mainly done to obtain key information about the industry’s supply chain, the value chain of the market, the pool of key market players, market segmentation according to industry trends, region, and developments from both, market and technology perspectives.
Primary Research
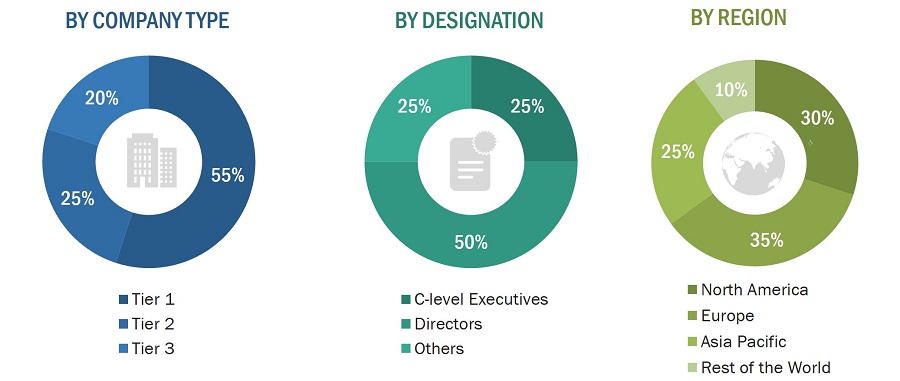
In primary research, various primary sources from the supply and demand sides were interviewed to obtain qualitative and quantitative insights required for this report. Primary sources from the supply side included experts such as CEOs, vice presidents, marketing directors, application developers, technology & innovation directors, application users, and related executives from multiple key companies and organizations operating in the quantum dot market ecosystem.
To know about the assumptions considered for the study, download the pdf brochure
Market Size Estimation
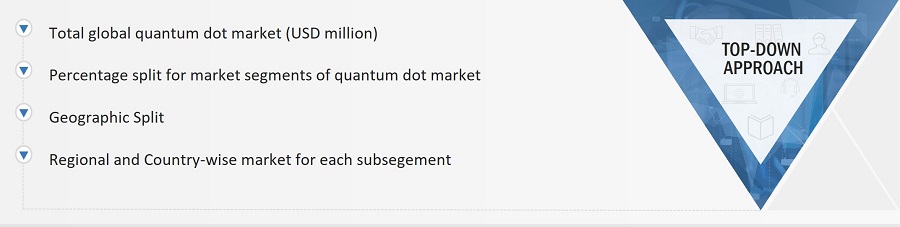
In the market engineering process, the top-down and bottom-up approaches were used along with multiple data triangulation methods to estimate and validate the size of the quantum dot market and other dependent submarkets. Key market players were identified through secondary research, and their market share in the targeted regions was determined with the help of primary and secondary research. This entire research methodology included the study of annual and financial presentations of the top market players, as well as interviews with experts for key insights (quantitative and qualitative). The percentage share, splits, and breakdowns were determined using secondary sources and verified through primary research. All the possible parameters that affect the quantum dot market were verified in detail with the help of primary sources and analyzed to obtain quantitative and qualitative data. This data was supplemented with detailed inputs and analysis from MarketsandMarkets and presented in the report.
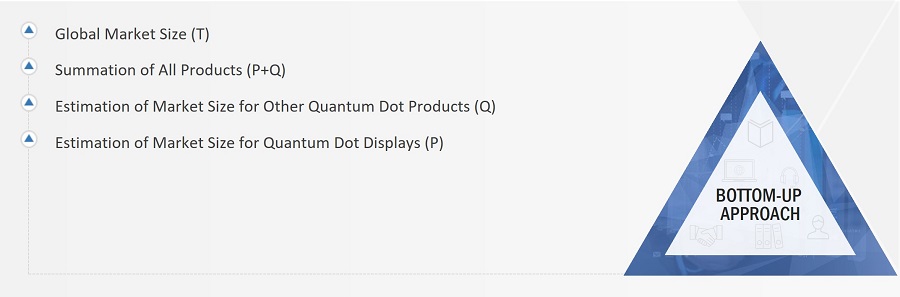
In the market engineering process, both top-down and bottom-up approaches have been used along with data triangulation methods to estimate and validate the size of the quantum dot market and other dependent submarkets. The research methodology used to estimate the market sizes includes the following:
- Analyzing the size of the global quantum dot market by identifying segment and subsegment revenue related to the market
- Identifying the total number of quantum dot displays shipped globally, which includes various types of displays
- Estimating the ASP of quantum dot displays
- Estimating the size of the quantum dot display market (quantum dot display shipment * ASP of quantum dot displays)
- Estimating the market size of other quantum dot products
- Estimating the quantum dot market size (summation of quantum dot display market and market of other quantum dot products)
- Identifying the upcoming projects related to quantum dots by various companies in different regions and forecasting the market size based on these developments and other important parameters.
Market Size Estimation Methodology-Bottom-up Approach
Market Size Estimation Methodology-Top-Down Approach
Data Triangulation
After arriving at the overall market size, the overall quantum dot market was divided into several segments and subsegments. To complete the overall market engineering process and arrive at the exact statistics for all segments and subsegments, the data triangulation and market breakdown procedures were used, wherever applicable. The data was triangulated by studying various factors and trends from the demand and supply sides. Along with data triangulation and market breakdown, the market size was validated by the top-down and bottom-up approaches.
Market Definition
Quantum dots (QDs) are semiconductor nanocrystals ranging in diameter from 2 to 10 nanometers (nm). When exposed to UV light, they emit specific colors determined by their nanoparticle size. Quantum dots are poised to transform display technologies by offering advantages such as high brightness, reliability, cost-effectiveness, and low power consumption. The market for quantum dots is expanding due to rising demand in display devices, their superiority over conventional displays, and their versatile applications across various industries. Manufacturers of quantum dot and related products are presented with numerous growth opportunities, driven by increased adoption in LEDs, escalating demand for large and high-resolution displays, and the expanding utilization of quantum dots in sectors like defense, aerospace, and agriculture.
Stakeholders
- Raw material and manufacturing equipment suppliers
- Integrated device manufacturers (IDMs)
- Component manufacturers
- Original device manufacturers (ODMs)
- Original equipment manufacturers (OEMs)
- ODM and OEM technology solution providers
- Assembly, testing, and packaging vendors
- Distributors and traders
- Research organizations
- Organizations, forums, alliances, and associations
- Governments, Financial Institutions, and Regulatory Bodies
The main objectives of this study are as follows:
- To define, analyze and forecast the quantum dot market size, by material, product, display, and vertical in terms of value
- To define, analyze and forecast the quantum dot market size, in terms of volume.
- To forecast the market size for various segments with respect to four main regions, namely, North America, Europe, Asia Pacific and Rest of the World (RoW)
- To provide detailed information regarding the major drivers, restraints, opportunities, and challenges influencing the growth of the quantum dot market
- To study the complete supply chain and related industry segments for the quantum dot market
- To strategically analyze the micromarkets1 with respect to individual growth trends, prospects, and contributions to the total market
- To analyze the value chain, market ecosystem; trends/disruptions impacting customer’s business; technology analysis; pricing analysis; Porter’s five forces model; key stakeholders & buying criteria; case study analysis; trade analysis; patent analysis; key conferences & events, 2024–2025; regulations related to the quantum dot market; and investment and funding scenario.
- To analyze opportunities in the market for various stakeholders by identifying the high-growth segments of the market.
- To strategically profile the key players and comprehensively analyze their market position in terms of ranking, core competencies2, company valuation and financial metrics and product/brand comparison; along with detailing the competitive landscape for the market leaders.
- To analyze competitive developments such as product launches, agreements, collaborations and acquisitions and research and development (R&D) activities carried out by players in the quantum dot market.
Customizations Options:
With the given market data, MarketsandMarkets offers customizations according to the company’s specific needs. The following customization options are available for the report:
Product Analysis
- Detailed analysis of quantum dot products for consumer, commercial, healthcare, defense, telecommunications and other verticals
Company Information
- Detailed analysis and profiling of additional market players (up to 5)
Geographic Information
- Detailed analysis of additional countries (up to 5)
Get the Full Quantum Dot Market Report
Full forecast, segment splits, and company analysis for all Quantum Dot Market.
- US Quantum Dot Market
- Canada Quantum Dot Market
- Mexico Quantum Dot Market
- Germany Quantum Dot Market
- UK Quantum Dot Market
- France Quantum Dot Market
- Spain Quantum Dot Market
- Italy Quantum Dot Market
- Rest Of Europe Quantum Dot Market
- China Quantum Dot Market
- Japan Quantum Dot Market
- India Quantum Dot Market
- Rest Of Asia Pacific Quantum Dot Market
Need a Tailored Report?
Customize this report to your needs
Get 10% FREE Customization
Customize This Report
