
Asia Pacific Simulation Software Market (2024-2029)

The Asia Pacific Simulation Software Market was valued at $4968.5 Million in 2024 and projected to reach to $10946.8 Million by 2029, representing a compound annual growth rate of 14.1%. The Asia Pacific simulation software market is poised for exceptional growth through 2029, driven by rapid industrialization, digital transformation initiatives, and increased R&D spending across the region.


| Market Size in | USD 26.32 MN |
| Market Forecast in | |
| CAGR | |
| Forecast Period | |
| Units Considered | Value (USD MN) |
Asia Pacific Simulation Software Market Trends and Insights
- Asia Pacific's 14.1% compound annual growth rate significantly outpaces the global average of 10.4%, reflecting the region's accelerating digital transformation and industrial modernization.
- This growth is driven by increasing adoption across manufacturing, automotive, aerospace, and semiconductor sectors throughout Asia Pacific, where enterprises are leveraging simulation tools to optimize product development cycles and reduce time-to-market. Asia Pacific's dominance in electronics manufacturing and rising investments in Industry 4.0 technologies are propelling simulation software demand across the region.
- Countries within Asia Pacific are prioritizing digital innovation and smart manufacturing initiatives, creating substantial opportunities for simulation software vendors.
- The forecast period through 2029 indicates Asia Pacific will remain a critical growth engine, with enterprises in the region increasingly recognizing simulation software as essential for competitive advantage and operational efficiency..
Key Market Statistics
- CAGR (2024-2029) 14.1% CAGR
- Market Size, 2024 ~USD 4968.5 Million
- Forecast, 2029 ~USD 10946.8 Million
- Geography Asia Pacific
Asia Pacific Simulation Software Market Overview
Outpacing Global Growth :
Asia Pacific's 14.1% CAGR significantly exceeds the global average of 10.4%, positioning the region as the fastest-growing simulation software market worldwide through 2029.
Substantial Market Expansion :
The region's market is projected to more than double from $4,968.5 million in 2024 to $10,946.8 million by 2029, representing a $5.98 billion increase in market value.
Digital Transformation Leadership :
Asia Pacific's accelerating digital transformation and industrial modernization initiatives are driving widespread adoption of simulation software across manufacturing, automotive, and aerospace sectors.
Emerging Market Opportunities :
Rising investments in Industry 4.0, smart manufacturing, and R&D activities across China, India, and Southeast Asia are creating unprecedented growth opportunities for simulation software vendors.
Asia Pacific Simulation Software Market Dynamics
- Manufacturing sectors in China, Japan, and India are increasingly adopting simulation technologies to optimize production processes, reduce costs, and accelerate product development cycles.
- Government support for Industry 4.0 adoption and smart manufacturing initiatives further accelerates market expansion. Key growth catalysts include rising demand for virtual prototyping, enhanced engineering capabilities, and the need for risk mitigation in complex industrial processes.
- The region's expanding automotive, aerospace, and electronics industries are major consumers of simulation software.
- Additionally, growing awareness of simulation's ROI and increasing availability of cloud-based solutions are democratizing access to these tools across small and medium enterprises, creating a broader addressable market throughout Asia Pacific..
Market Ecosystem
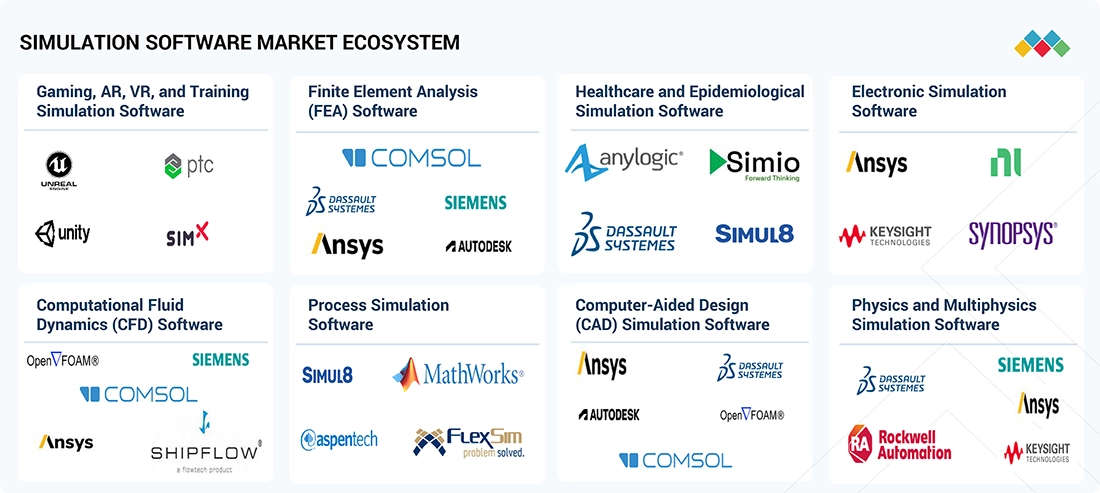
SIMULATION SOFTWARE MARKET: COMMERCIAL USE CASES ACROSS INDUSTRIES
| COMPANY | USE CASE DESCRIPTION | BENEFITS |
|---|---|---|
 |
Altair provided automated FEA post-processing to help NGSC calculate combined stresses from complex NASTRAN outputs efficiently. | Enabled faster, error-free stress calculations, improved collaboration, streamlined engineering workflows, and ensured consistent, repeatable results across multiple structural models. |
 |
Dassault Systèmes supplied EM simulation tools enabling Anywaves to design and optimize miniature satellite antennas for harsh space conditions. | Improved antenna precision, reduced electromagnetic interference, enhanced reliability and performance, and enabled efficient creation of complex 3D-printed ceramic antenna shapes.. |
 |
Siemens delivered 3D CAD and integrated simulation tools to help GEA streamline machinery design, reduce prototypes, and accelerate development. | Lower manufacturing costs, improved product quality and performance, enhanced collaboration, and significantly faster design turnaround using integrated CAD and simulation. |
 |
Ansys provided Fluent and Twin Builder simulation tools to help Wärtsilä build an advanced, integrated battery energy storage model. | Reduced CFD simulation time, improved battery behavior prediction, enhanced design decisions with long-term insights, and validated system performance across development stages. |
 |
Autodesk delivered Moldflow Simulation enabling Napino to improve handle switch case design, minimize defects, and resolve dimensional inaccuracies. | Improved product quality, reduced part warpage, accelerated development, and enabled better confidence and efficiency in resolving complex mold and manufacturing challenges. |
Logos and trademarks shown above are the property of their respective owners. Their use here is for informational and illustrative purposes only.
Related Ecosystem
Software And Services
- Natural Language Processing (NLP)
- Machine Learning
- Supply Chain Management
- Predictive Analytics
- Image Sensors
- International Business Machines Corporation
- MICROSOFT CORPORATION
- Oracle Corporation
- SAP SE
- Amazon.com, Inc.
Space
- C-Band
- Small Satellite
- Antennas
- Ka-Band
- Microsatellite
- AIRBUS
- L3Harris Technologies, Inc.
- Thales group
- Northrop Grumman Corporation
- LOCKHEED MARTIN CORPORATION
Unmanned Systems
- Rotary Wing Aircraft
- Fixed-Wing Drones
- Sensors
- Fuel Cell
- Fixed Wing Aircraft
- LOCKHEED MARTIN CORPORATION
- Northrop Grumman Corporation
- ISRAEL AEROSPACE INDUSTRIES LTD
- Thales group
- BAE Systems plc
Key Takeaways
- Asia Pacific simulation software market will more than double from $4,968.5M (2024) to $10,946.8M (2029), growing at 14.1% CAGR.
- Asia Pacific's growth rate of 14.1% significantly exceeds the global CAGR of 10.4%, positioning the region as the fastest-growing market.
- Manufacturing, automotive, and semiconductor industries in Asia Pacific are primary drivers of simulation software adoption and investment.
- Digital transformation initiatives and Industry 4.0 adoption across Asia Pacific are accelerating demand for advanced simulation solutions.
Simulation Software Market Report Scope
| Report Metric | Details |
|---|---|
| Base Year | 2024 |
| Fastest Growing Segment | SMES (Enterprise Size) |
| Forecast Period | 2024-2029 |
| Growth Rate | CAGR of 10.4% from 2024 to 2029 |
| Largest Segment | LARGE ENTERPRISES (Organization Size) |
| Market Size Base Year (Billions) | ~USD 20 (2024) |
| Revenue Forecast (Billions) | ~USD 32.81 (2029) |
| Segments Covered | Offering, Software Type, Deployment Mode, Organization Size, Application, Vertical, Enterprise Size, Industry, Component, Deployment Type, Industry Vertical |
Asia Pacific Simulation Software Market Report Segmentation
11 segment dimensions are covered across the global market.
By Offering
- Professional Services
- Software
By Software Type
- Cad Simulation Software
- Cfd
- Computational Fluid Dynamics Software
- Computer-Aided Design Simulation Software
- Electromagnetic Simulation Software
- Electronic Simulation Software
- Fea
- Finite Element Analysis Software
- Gaming, Ar, Vr, And Training Simulation Software
- Healthcare & Epidemiological Simulation Software
- Manufacturing Simulation Software
- Other Software Types
- Physics & Multiphysics Simulation Software
- Process Simulation Software
By Deployment Mode
- Cloud
- On-Premises
By Organization Size
- Large Enterprises
- Smes
By Application
- Automotive & Vehicle Simulation
- Business Optimization
- Engineering, Research, Modeling, And Simulated Testing
- Gamification, Vr, Ar, And Immersive Experience
- Healthcare & Medical Device Simulation
- Inventory Management
- Manufacturing & Process Optimization
- Other Application
- Other Applications
- Performance Monitoring
- Predictive Maintenance
- Product Design & Development
- Supply Chain, Logistics Management, And Transportation
- Urban Planning
By Vertical
- Aerospace & Defense
- Automotive
- Chemicals
- Construction
- Electrical & Electronics
- Gaming
- Healthcare & Pharmaceuticals
- Oil, Gas, And Mining
- Other Verticals
- Shipbuilding & Marine Engineering
By Enterprise Size
- Large Enterprises
- Smes
By Industry
- Aerospace
- Agriculture
- Automotive & Transportation
- Energy & Utilities
- Healthcare
- Infrastructure
- Oil & Gas
- Other Industries
- Retail
- Telecommunications
By Component
- Services
- Solutions
By Deployment Type
- Cloud
- On-Premises
By Industry Vertical
- Aerospace And Defense
- Automotive
- Energy And Utilities
- High-Tech
- Industrial Equipment
- Medical Devices And Components
- Others*
Target Audience
- Software Vendors & Solution Providers : Identify market opportunities, assess competitive positioning, and develop region-specific strategies to capture share in Asia Pacific's high-growth simulation software market.
- Manufacturing & Industrial Companies : Evaluate simulation software investments to optimize production processes, reduce time-to-market, and enhance operational efficiency across Asia Pacific operations.
- Investment & Private Equity Firms : Assess market growth potential, identify acquisition targets, and evaluate investment opportunities in Asia Pacific's rapidly expanding simulation software ecosystem.
- Technology Consultants & System Integrators : Understand regional demand patterns and client requirements to develop tailored simulation software implementation solutions for Asia Pacific enterprises.
- Government & Policy Makers : Leverage market insights to inform industrial policy, R&D funding decisions, and digital transformation initiatives supporting simulation technology adoption across Asia Pacific.
Countries within Asia Pacific - compare and drill down
| Country | 2025 size (native) |
|---|---|
| China | USD 3158 Million |
| Japan | USD 1829.5 Million |
| India | USD 1695.6 Million |
| Singapore | USD 1102.2 Million |
| Rest Of Asia Pacific | USD 3161.4 Million |
Country market size visualization
Reasons to Buy this Report
- Regional Market Sizing & Forecasts : Obtain precise market valuations for Asia Pacific and individual country-level data, enabling accurate budgeting and resource allocation for regional expansion strategies.
- Competitive Landscape Intelligence : Understand market dynamics, key players, and competitive positioning specific to Asia Pacific to identify partnership opportunities and market entry strategies.
- Growth Driver Analysis : Gain insights into region-specific growth catalysts including Industry 4.0 adoption, manufacturing modernization, and government initiatives driving simulation software demand.
- Segment & Application Insights : Access detailed breakdowns of simulation software adoption across Asia Pacific's automotive, aerospace, electronics, and manufacturing sectors to target high-potential segments.
- Strategic Decision Support : Leverage comprehensive Asia Pacific market intelligence to inform product development, pricing strategies, and go-to-market approaches tailored to regional opportunities.
Frequently asked questions
What is the current size of the Asia Pacific simulation software market?
The Asia Pacific simulation software market was valued at $4,968.5 million in 2024 and is projected to reach $10,946.8 million by 2029.
What is the growth rate for simulation software in Asia Pacific?
Asia Pacific's simulation software market is growing at a compound annual growth rate (CAGR) of 14.1% from 2024 to 2029.
How does Asia Pacific's growth compare to the global market?
Asia Pacific's 14.1% CAGR outpaces the global average of 10.4%, making it the fastest-growing region for simulation software.
Which industries are driving simulation software adoption in Asia Pacific?
Manufacturing, automotive, aerospace, and semiconductor sectors are the primary drivers of simulation software demand throughout Asia Pacific.
What factors are contributing to Asia Pacific's rapid market growth?
Digital transformation initiatives, Industry 4.0 adoption, electronics manufacturing dominance, and smart manufacturing investments are key growth factors in Asia Pacific.
RESEARCH METHODOLOGY
Secondary research was conducted to collect information useful for this technical, market-oriented, and commercial study of the global simulation software market. The next step was to validate these findings, assumptions, and sizing with industry experts across the value chain using primary research. Different approaches, such as top-down and bottom-up, were employed to estimate the total market size. After that, the market breakup and data triangulation procedures were used to estimate the market size of the segments and subsegments of the market.
Secondary Research
In the secondary research process, various secondary sources were referred to identify and collect information related to the study. Secondary sources included simulation software news, simulation software foundations, annual reports, press releases, investor presentations of simulation software vendors, forums, certified publications, and whitepapers. The secondary research was used to obtain software segmentation from the market and technology-oriented perspectives.
Primary Research
In the primary research process, various primary sources from the supply and demand sides of the simulation software market were interviewed to obtain qualitative and quantitative information for the study. The primary sources from the supply side included industry experts, such as Chief Executive Officers (CEOs), Vice Presidents (VPs), marketing directors, technology and innovation directors, and related key executives of various vendors providing simulation software solutions, tools and applications, associated service providers, and system integrators operating in the targeted regions. All possible parameters that affect the market covered in this research study have been accounted for, viewed in extensive detail, verified through primary research, and analyzed to obtain the final quantitative and qualitative data.
After the complete market engineering process (including calculations for market statistics, market breakups, market size estimations, market forecasting, and data triangulation), extensive primary research was conducted to gather information and verify and validate the critical numbers arrived at. The primary research helped identify and validate the segmentation types, industry trends, key players, a competitive landscape of simulation software solutions, tools, and applications offered by several market vendors, and fundamental market dynamics, such as drivers, restraints, opportunities, challenges, industry trends, and key strategies.
In the complete market engineering process, the bottom-up and top-down approaches and several data triangulation methods were extensively used to estimate and forecast the overall market segments and subsegments listed in this report. An extensive qualitative and quantitative analysis was performed on the complete market engineering process to list the key information/insights throughout the report.
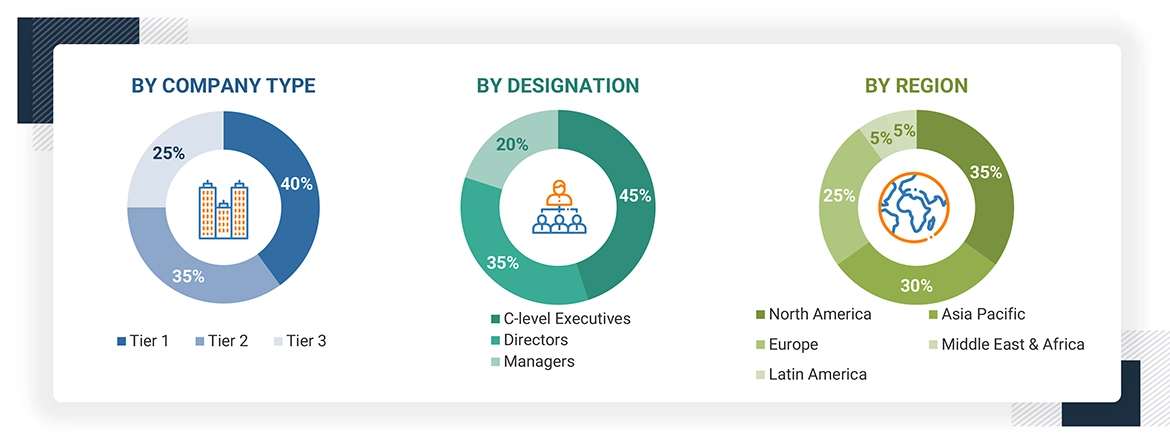
Note: Other levels include sales, marketing, and product managers.
Tier 1 companies receive revenues higher than USD 10 billion; Tier 2 companies' revenues range between USD 1 and 10 billion; and Tier 3 companies' revenues range between USD 500 million and USD 1 billion.
Source: Industry Experts
To know about the assumptions considered for the study, download the pdf brochure
Market Size Estimation
Top-down and bottom-up approaches were used to estimate and validate the simulation software market's size and various other dependent sub-segments in the overall simulation software market. The research methodology used to estimate the market size includes the following details: key players in the market were identified through secondary research, and their market shares in the respective regions were determined through primary and secondary research. This entire procedure included the study of the annual and financial reports of the top market players, and extensive interviews were conducted for key insights from the industry leaders, such as CEOs, VPs, directors, and marketing executives.
All percentage splits and breakdowns were determined using secondary sources and verified through primary sources. All possible parameters that affect the market covered in this research study have been accounted for, viewed in extensive detail, verified through primary research, and analyzed to get the final quantitative and qualitative data. This data is consolidated and added to detailed inputs and analysis from MarketsandMarkets.
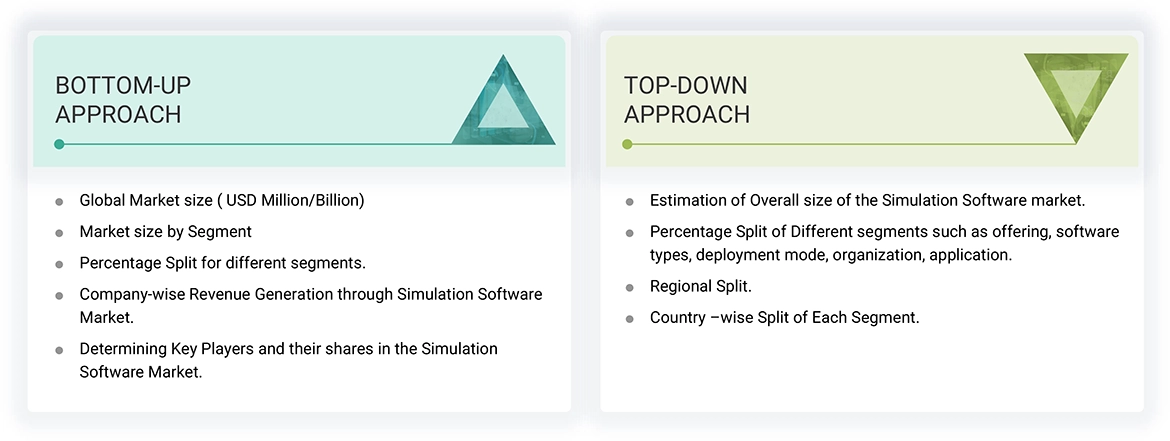
Data Triangulation
After arriving at the overall market size using the market size estimation processes explained above, the market was split into several segments and subsegments. The data triangulation and market breakup procedures were employed, wherever applicable, to complete the overall market engineering process and arrive at the exact statistics of each market segment and subsegment. The data was triangulated by studying various factors and trends from both the demand and supply sides.
Market Definition
Simulation software refers to a tool that models real-world environments to predict system behavior under various conditions, such as mechanical stress, thermal changes, or fluid dynamics. By utilizing mathematical models expressed as diagrams or code, it evaluates new designs, diagnoses existing issues, and tests scenarios that are difficult to reproduce. The software breaks down complex geometries into discrete structures, calculating how these elements interact with real-world forces. Additionally, it features visualization tools, such as data displays and 3D animations, to monitor the simulation process and enhance understanding of the system's performance over time.
Stakeholders
- Chief technology and data officers
- Simulation service professionals
- Business analysts
- Information Technology (IT) professionals
- Investors and venture capitalists
- Third-party providers
- Consultants/Consultancies/Advisory firms
- Product designers/Computer-aided software engineers
- System integrators
- Value-added Resellers (VARs)
Report Objectives
- To describe and forecast the global Simulation Software market based on offering, software type, deployment mode, organization size, application, vertical, and region
- To provide detailed information about the major factors (drivers, opportunities, restraints, and challenges) influencing the growth of the market
- To analyze the opportunities for stakeholders by identifying the high-growth segments of the market
- To forecast the size of the market segments with respect to five regions: North America, Europe, Middle East & Africa, Asia Pacific and Latin America
- To analyze subsegments of the market with respect to individual growth trends, prospects, and contributions to the overall market
- To profile the key players and comprehensively analyze their market sizes and core competencies
- To track and analyze competitive developments such as product enhancements and new product launches, acquisitions, and partnerships and collaborations in the market globally
Available Customizations
With the given market data, MarketsandMarkets offers customizations based on company-specific needs. The following customization options are available for the report:
Geographic Analysis
- Further breakup of the Asia Pacific market into countries contributes to the rest of the regional market size.
- Further breakup of the North American market into countries contributes to the rest of the regional market size.
- Further breakup of the Latin American market into countries contributes to the rest of the regional market size.
- Further breakup of the Middle East & African market into countries contributing to the rest of the regional market size
- Further breakup of the European market into countries contributes to the rest of the regional market size.
Company Information
- Detailed analysis and profiling of additional market players (up to 5)
Get the Full Simulation Software Market Report
Full forecast, segment splits, and company analysis for all Simulation Software Market.
- Canada Simulation Software Market
- US Simulation Software Market
- UK Simulation Software Market
- Germany Simulation Software Market
- France Simulation Software Market
- Italy Simulation Software Market
- China Simulation Software Market
- Japan Simulation Software Market
- India Simulation Software Market
- Singapore Simulation Software Market
- UAE Simulation Software Market
- South Africa Simulation Software Market
- Brazil Simulation Software Market
- Mexico Simulation Software Market
- Rest Of Europe Simulation Software Market
- Rest Of Asia Pacific Simulation Software Market
- Rest Of Latin America Simulation Software Market
- GCC Countries Simulation Software Market
- Ksa Simulation Software Market
- Rest Of GCC Countries Simulation Software Market
Need a Tailored Report?
Customize this report to your needs
Get 10% FREE Customization
Customize This Report
