
Asia Pacific Smart Appliances Market (2025-2030)

The Asia Pacific Smart Appliances Market was valued at $17368.5 Million in 2025 and projected to reach to $32205 Million by 2030, representing a compound annual growth rate of 13.1%. Asia Pacific is poised to become the global epicenter of smart appliances innovation and consumption, driven by accelerating digital transformation across major economies.


| Market Size in | USD 26.32 MN |
| Market Forecast in | |
| CAGR | |
| Forecast Period | |
| Units Considered | Value (USD MN) |
Asia Pacific Smart Appliances Market Trends and Insights
- This region is experiencing accelerated adoption driven by rising disposable incomes, rapid urbanization, and increasing consumer demand for connected home solutions across major economies.
- Asia Pacific's 13.1% compound annual growth rate significantly outpaces the global average, reflecting the region's pivotal role in shaping the future of intelligent home technology. The Asia Pacific smart appliances market is characterized by intense competition among both established multinational players and emerging local manufacturers.
- Asia Pacific consumers are increasingly prioritizing energy efficiency, convenience, and IoT integration in their appliance purchases, creating substantial opportunities for innovation.
- Between 2025 and 2030, Asia Pacific is expected to capture a disproportionate share of global market expansion, driven by smartphone penetration, smart home ecosystem development, and government initiatives promoting sustainable living standards across the region..
Key Market Statistics
- CAGR (2025-2030) 13.1% CAGR
- Market Size, 2025 ~USD 17368.5 Million
- Forecast, 2030 ~USD 32205 Million
- Geography Asia Pacific
Asia Pacific Smart Appliances Market Overview
Dominant Regional Growth :
Asia Pacific's 13.1% CAGR significantly outpaces the global average of 11%, positioning the region as the fastest-growing market for smart appliances with expansion from USD 17,368.5 million in 2025 to USD 32,205 million by 2030.
China's Market Leadership :
China commands the largest market share in Asia Pacific at USD 12,921.6 million, driven by massive urbanization, tech-savvy consumers, and government initiatives promoting smart home adoption across residential and commercial sectors.
India's Emerging Opportunity :
India represents a high-growth frontier with USD 6,131.8 million in market size, fueled by rising middle-class disposable incomes, smartphone penetration, and increasing preference for energy-efficient connected appliances in urban centers.
Diverse Regional Ecosystem :
Japan (USD 4,226.3M), South Korea (USD 5,018.1M), and Rest of Asia Pacific (USD 3,907.1M) collectively contribute significant market value, each with distinct adoption patterns and technology preferences driving regional innovation.
Asia Pacific Smart Appliances Market Dynamics
- Rising disposable incomes, rapid urbanization, and government smart city initiatives are catalyzing widespread adoption of IoT-enabled appliances.
- The region's tech-forward consumer base and competitive manufacturing ecosystem create ideal conditions for market expansion. Key growth catalysts include increasing smartphone penetration, expanding e-commerce infrastructure, and growing awareness of energy efficiency benefits.
- China and India will lead volume growth, while Japan and South Korea drive premium segment innovation.
- By 2030, Asia Pacific's market is expected to nearly double, reflecting the region's critical importance to global smart appliances manufacturers and technology providers seeking high-growth opportunities..
Market Ecosystem
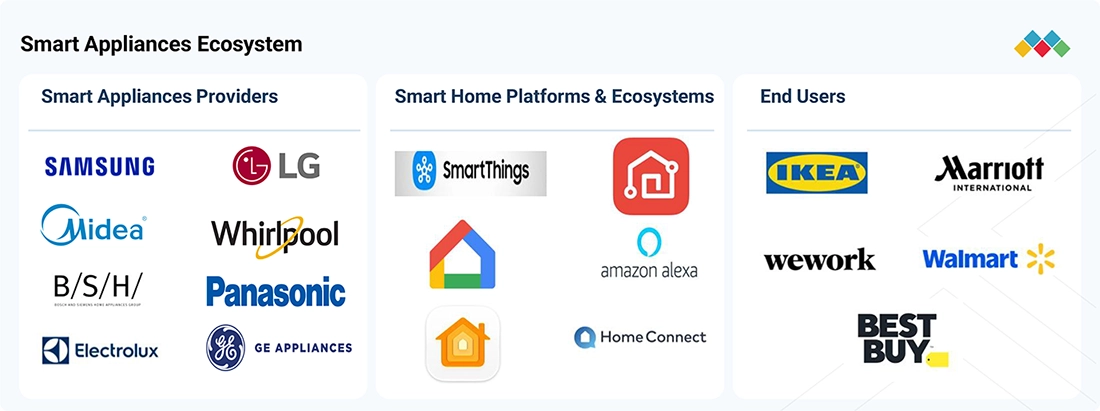
SMART APPLIANCES MARKET: COMMERCIAL USE CASES ACROSS INDUSTRIES
| COMPANY | USE CASE DESCRIPTION | BENEFITS |
|---|---|---|
 |
Samsung offers smart refrigerators, washing machines, air conditioners, and other connected appliances. Its SmartThings ecosystem enables users to connect compatible appliances, monitor their status, control functions remotely, and automate selected operations. | Enables centralized appliance management | Supports remote operation | Improves convenience | Provides energy monitoring features on compatible appliances |
 |
LG offers smart refrigerators, washing machines, dryers, and air conditioners with ThinQ connectivity, enabling users to monitor appliance status, control selected functions remotely, and access smart diagnosis features. | Improves convenience through remote control | Supports appliance monitoring and diagnostics | Helps users manage household appliances efficiently |
 |
Midea offers smart air conditioners, refrigerators, washing machines, and other connected appliances with mobile application controls and intelligent operating features. | Enables remote appliance control | Improves user convenience | Supports temperature and operating adjustments | Helps optimize appliance operation |
 |
Whirlpool offers connected kitchen and laundry appliances with smart features that allow users to monitor appliance status, receive notifications, and control selected functions through compatible applications. | Simplifies kitchen and laundry management | Provides appliance status notifications | Enables remote control | Improves day-to-day convenience |
 |
Panasonic offers connected appliances, including selected air conditioners, refrigerators, and washing machines, with smart functions that support remote operation, monitoring, and automated control where available. | Supports remote appliance management | Improves convenience | Enables automated operation of compatible appliances | Helps users monitor appliance performance |
Logos and trademarks shown above are the property of their respective owners. Their use here is for informational and illustrative purposes only.
Related Ecosystem
Electrical System And Components
- Natural Language Processing (NLP)
- Sensors
- Machine Learning
- Temperature Sensors
- Actuators
- ABB India Limited
- Siemens ag
- SCHNEIDER ELECTRIC SE
- Eaton Corporation plc
- General Electric Company
Electronics System And Components
- Sensors
- Temperature Sensors
- Pressure Sensors
- Actuators
- Image Sensors
- Lenovo
- Samsung
- Texas Instruments Incorporated
- HONEYWELL INTERNATIONAL INC.
- Teledyne Technologies Incorporated
Key Takeaways
- Asia Pacific smart appliances market will nearly double from USD 17.4B (2025) to USD 32.2B (2030), driven by 13.1% CAGR
- Asia Pacific's growth rate of 13.1% significantly exceeds the global average of 11%, positioning the region as the fastest-growing market
- Rising urbanization and middle-class expansion in Asia Pacific are accelerating consumer adoption of connected home technologies
- Asia Pacific manufacturers are increasingly competing on IoT integration and energy efficiency to capture growing demand through 2030
Smart Appliances Market Report Scope
| Report Metric | Details |
|---|---|
| Base Year | 2025 |
| Fastest Growing Segment | VACUUM CLEANING ROBOTS (Product) |
| Forecast Period | 2025-2030 |
| Growth Rate | CAGR of 11% from 2025 to 2030 |
| Largest Segment | WI-FI (Connectivity) |
| Market Size Base Year (Billions) | ~USD 42.3 (2025) |
| Revenue Forecast (Billions) | ~USD 71.28 (2030) |
| Segments Covered | Product, Vertical, Sales Channel, Connectivity |
Asia Pacific Smart Appliances Market Report Segmentation
4 segment dimensions are covered across the global market.
By Product
- Air Conditioners
- Air Purifiers
- Coffee Makers
- Cookers/Cooking Robots
- Dishwashers
- Microwaves
- Other Smart Appliances
- Ovens & Cooktops
- Refrigerators
- Vacuum Cleaning Robots
- Washing Machines & Dryers
- Water Heaters
By Vertical
- Commercial
- Residential
By Sales Channel
- Offline
- Online
By Connectivity
- Bluetooth
- Wi-Fi
- Wifi
Target Audience
- Smart Appliance Manufacturers : Manufacturers need Asia Pacific market intelligence to guide product localization, capacity expansion, and competitive positioning in the world's fastest-growing smart appliances region with USD 32.2B opportunity by 2030.
- Semiconductor & Electronics Suppliers : Component suppliers require detailed regional forecasts to plan chip production, supply chain optimization, and strategic partnerships with OEMs across China, India, Japan, and South Korea's growing smart appliance ecosystems.
- IoT & Smart Home Platform Providers : Platform companies need country-specific adoption data and growth trajectories to prioritize market entry, localize connectivity solutions, and build partnerships with regional appliance manufacturers and retailers.
- Private Equity & Investment Firms : Investors require comprehensive Asia Pacific market sizing and CAGR analysis to evaluate acquisition targets, assess portfolio company growth potential, and identify emerging opportunities in high-growth smart appliance segments.
- Market Strategists & Business Consultants : Consultants need regional market data and forecasts to advise clients on market entry strategies, competitive positioning, and growth opportunities across Asia Pacific's diverse smart appliances landscape.
Countries within Asia Pacific - compare and drill down
| Country | 2025 size (native) |
|---|---|
| China | USD 12921.6 Million |
| India | USD 6131.8 Million |
| Japan | USD 4226.3 Million |
| South Korea | USD 5018.1 Million |
| Rest Of Asia Pacific | USD 3907.1 Million |
Country market size visualization
Reasons to Buy this Report
- Regional Growth Outperformance : Gain competitive intelligence on Asia Pacific's 13.1% CAGR—2.1 percentage points above global average—to identify high-growth market segments and prioritize regional expansion strategies ahead of competitors.
- Country-Level Market Sizing : Access granular market data for China (USD 12.9B), India (USD 6.1B), Japan (USD 4.2B), and South Korea (USD 5.0B) to tailor product development, pricing, and go-to-market strategies for each distinct market.
- Emerging Market Opportunity Assessment : Evaluate India's high-growth potential and Rest of Asia Pacific markets (USD 3.9B) to identify untapped segments, distribution partnerships, and localization opportunities in underserved regions.
- 2030 Forecast Planning : Leverage detailed projections showing market expansion to USD 32.2B by 2030 to inform long-term capital allocation, manufacturing capacity planning, and supply chain investments across the region.
- Competitive Benchmarking : Compare regional performance metrics and market dynamics to understand competitive positioning, identify white-space opportunities, and develop differentiated value propositions for Asia Pacific consumers.
Frequently asked questions
What is the projected market size for smart appliances in Asia Pacific by 2030?
Asia Pacific's smart appliances market is projected to reach USD 32,205 million by 2030, up from USD 17,368.5 million in 2025.
What is the CAGR for Asia Pacific smart appliances market?
Asia Pacific smart appliances market is expected to grow at a compound annual growth rate of 13.1% from 2025 to 2030.
How does Asia Pacific's growth compare to the global smart appliances market?
Asia Pacific's 13.1% CAGR outpaces the global average of 11%, making it the fastest-growing region for smart appliances.
What are the primary drivers of smart appliances adoption in Asia Pacific?
Key drivers include rising disposable incomes, rapid urbanization, smartphone penetration, IoT ecosystem development, and government sustainability initiatives across Asia Pacific.
Which factors are influencing consumer preferences in Asia Pacific's smart appliances market?
Asia Pacific consumers prioritize energy efficiency, convenience, IoT connectivity, and smart home integration when selecting appliances.
RESEARCH METHODOLOGY
The study involved four major activities to estimate the current size of the smart appliances market. Extensive secondary research was conducted to gather information on the smart appliances market, related industries, and the broader smart home and connected appliance ecosystem. Primary research was then conducted with stakeholders across the value chain, including smart appliance manufacturers, technology providers, distributors, retailers, and end users across residential and commercial segments to validate market estimates and assumptions. Both top-down and bottom-up approaches were used to estimate the overall market size, followed by market breakdown and data triangulation to determine the size of individual segments and subsegments. Secondary and primary research were combined to provide a comprehensive analysis of the smart appliances market.
Secondary Research
Various secondary sources were referred to during the secondary research process to identify and collect information relevant to the smart appliances market. These sources included annual reports, press releases, investor presentations of key companies, product brochures, product and solution pages, technical documents, white papers, industry journals, certified publications, industry associations, company websites, trade directories, government databases, and smart home, connected devices, and consumer electronics industry sources. Secondary research was conducted to obtain key insights into the market's supply chain, value chain, competitive landscape, and segmentation across residential and commercial applications. It also helped analyze industry trends and the adoption of smart appliances, connected technologies, and IoT-enabled features across residential and commercial settings.
The collected data was further analyzed to estimate the overall market size and validate findings, which were subsequently refined through primary research with industry experts and key stakeholders.
Primary Research
Extensive primary research was conducted after gaining knowledge about the current scenario of the Smart Appliances market through secondary research. Several primary interviews were conducted with experts from the demand and supply sides across four major regions: North America, Europe, Asia Pacific, and RoW. This primary data was collected through questionnaires, emails, and telephonic interviews.
Breakdown of Primary Interviews
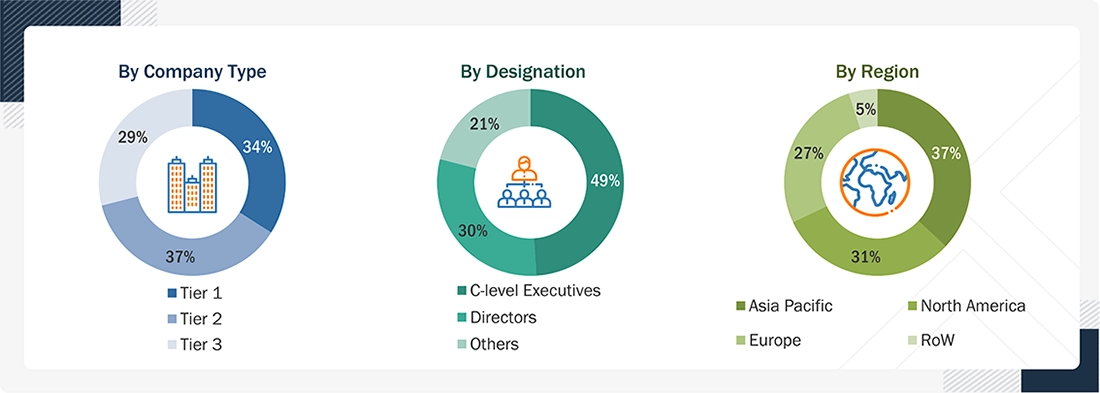
Note: The three tiers of companies are defined based on their total revenue in 2025: Tier 1 - revenue greater than or equal to USD 1 billion; Tier 2 - revenue between USD 100 million and USD 1 billion; and Tier 3 - revenue less than or equal to USD 100 million. Other designations include sales managers, marketing managers, and product managers.
To know about the assumptions considered for the study, download the pdf brochure
Market Size Estimation
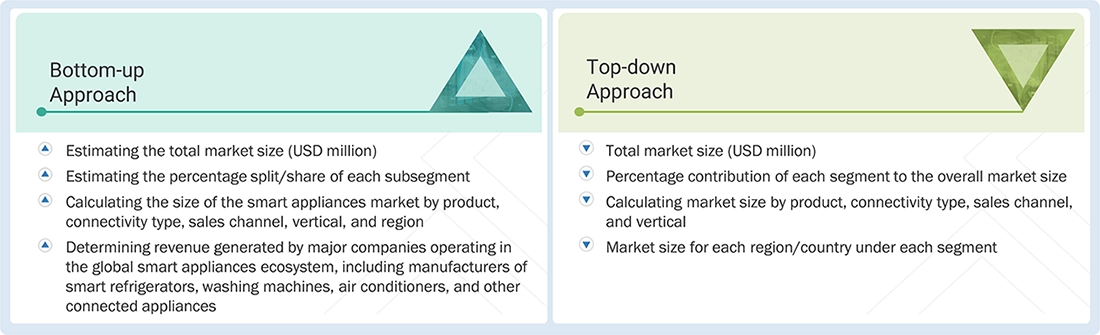
- Both top-down and bottom-up approaches were used to estimate and validate the total size of the smart appliances market. These approaches were also used extensively to estimate the size of various segments and subsegments in the market. The following research methodology was used to estimate the market size:
- Major players in the smart appliances industry and related smart home, connected device, and consumer electronics markets were identified through extensive secondary research.
- The industry value chain and market size (in terms of value) were determined through primary and secondary research processes.
- All percentage shares, splits, and segment-level breakdowns across residential and commercial applications were determined using secondary sources and validated through primary research.
Smart Appliances Market: Top-Down and Bottom-Up Approach
Data Triangulation
After arriving at the overall size of the smart appliances market through the market size estimation process described above, the total market was divided into relevant segments and subsegments. Data triangulation and market breakdown procedures were used, wherever applicable, to complete the overall market engineering process and derive statistics for all segments and subsegments. The data was triangulated by analyzing various factors and trends from both the demand and supply sides, including the adoption of smart appliances, technological advancements, connectivity features, and developments across residential and commercial applications. In addition, the market size was validated using both top-down and bottom-up approaches to ensure consistency across the overall market and individual segments.
Market Definition
A smart appliance is an electronic device equipped with connectivity, sensors, software, or intelligent control capabilities that enable automated functions, remote monitoring, and control. Smart appliances help users improve convenience, energy efficiency, operational performance, and resource management across residential and commercial settings. Smart appliance offerings include connected appliances and related technologies that enable remote access, automated operation, and integration with smart home or building management systems. Smart appliances are particularly important for applications that require efficient energy management, automated control, remote monitoring, and improved operational convenience. They support functions such as cleaning, cooking, food preservation, climate control, and other household and commercial operations. A typical smart appliance environment may integrate appliances with mobile applications, voice assistants, smart home platforms, Internet of Things (IoT) systems, and building management systems. The configuration and functionality of smart appliances vary depending on appliance type, connectivity capabilities, level of automation, application requirements, and end-user needs across residential and commercial segments.
Key Stakeholders
- Manufacturers and Suppliers
- Component Suppliers
- Software & Platform Providers
- Distributors & Retailers
- System Integrators & Service Providers
- Telecom & Connectivity Providers
- Regulatory & Standards Bodies
- End-user industries
- Research & Development Firms
Report Objectives
- To define, describe, and forecast the smart appliances market in terms of value across residential and commercial segments
- To forecast the market size, in terms of value, across four major regions—North America, Europe, Asia Pacific, and the Rest of the World
- To provide detailed information regarding the major factors influencing the growth of the smart appliances market, including drivers, restraints, opportunities, and challenges
- To analyze the micromarkets¹ for individual growth trends, prospects, and contributions to the overall market
- To provide a detailed overview of the value chain of the smart appliances market
- To analyze opportunities for various stakeholders by identifying high-growth segments of the market
- To profile key players and comprehensively analyze their market positions in terms of ranking and core competencies², along with detailing the competitive landscape of the market
- To analyze competitive developments, such as product launches and developments, partnerships, acquisitions, contracts, expansions, and research and development activities in the smart appliances market
Available customizations:
With the given market data, MarketsandMarkets offers customizations according to the company’s specific needs. The following customization options are available for the report:
Company Information
-
Detailed analysis and profiling of additional market players (up to 5)
Get the Full Smart Appliances Market Report
Full forecast, segment splits, and company analysis for all Smart Appliances Market.
- Canada Smart Appliances Market
- Mexico Smart Appliances Market
- US Smart Appliances Market
- France Smart Appliances Market
- Germany Smart Appliances Market
- Italy Smart Appliances Market
- Rest Of Europe Smart Appliances Market
- UK Smart Appliances Market
- China Smart Appliances Market
- India Smart Appliances Market
- Japan Smart Appliances Market
- Rest Of Asia Pacific Smart Appliances Market
- South Korea Smart Appliances Market
Need a Tailored Report?
Customize this report to your needs
Get 10% FREE Customization
Customize This Report