
Rest Of Asia Pacific Smart Appliances Market (2025-2030)

The Rest Of Asia Pacific Smart Appliances Market was valued at $2327.2 Million in 2025 and projected to reach to $3907.1 Million by 2030, representing a compound annual growth rate of 10.9%. Rest Of Asia Pacific represents a critical growth frontier for the global smart appliances market, driven by expanding middle-class populations and accelerating digital transformation across the region.


| Market Size in | USD 26.32 MN |
| Market Forecast in | |
| CAGR | |
| Forecast Period | |
| Units Considered | Value (USD MN) |
Rest Of Asia Pacific Smart Appliances Market Trends and Insights
- This region is experiencing robust adoption of connected home technologies driven by rising disposable incomes, urbanization, and increasing consumer awareness of energy efficiency.
- Rest Of Asia Pacific's 10.9% compound annual growth rate reflects strong demand for IoT-enabled appliances across emerging markets, positioning the region as a key contributor to the broader Asia Pacific smart appliances ecosystem. The expansion of Rest Of Asia Pacific's smart appliances market is underpinned by accelerating digital transformation and smart home penetration in developing economies.
- Rest Of Asia Pacific consumers are increasingly investing in connected refrigerators, washing machines, air conditioning units, and kitchen appliances that offer remote monitoring and automation capabilities.
- Between 2025 and 2030, Rest Of Asia Pacific is expected to capture growing market share as infrastructure improvements, smartphone proliferation, and competitive pricing strategies lower barriers to adoption.
- The region's trajectory demonstrates the substantial opportunity for manufacturers and technology providers targeting emerging middle-class consumers seeking convenience and sustainability..
Key Market Statistics
- CAGR (2025-2030) 10.9% CAGR
- Market Size, 2025 ~USD 2327.2 Million
- Forecast, 2030 ~USD 3907.1 Million
- Country Rest Of Asia Pacific
Rest Of Asia Pacific Smart Appliances Market Overview
Rapid Market Expansion :
Rest Of Asia Pacific's smart appliances market is projected to grow from $2,327.2 million in 2025 to $3,907.1 million by 2030, representing a robust 10.9% CAGR and outpacing many mature markets globally.
Rising Disposable Incomes :
Increasing purchasing power across emerging economies in Rest Of Asia Pacific is driving consumer adoption of premium connected home technologies and smart kitchen appliances.
Urbanization & Smart Homes :
Rapid urbanization in Rest Of Asia Pacific is accelerating demand for IoT-enabled appliances as consumers seek convenience, automation, and integrated home management solutions.
Energy Efficiency Focus :
Growing environmental consciousness and rising utility costs in Rest Of Asia Pacific are motivating consumers to invest in energy-efficient smart appliances that reduce consumption and operational expenses.
Rest Of Asia Pacific Smart Appliances Market Dynamics
- The 10.9% CAGR reflects strong momentum as consumers increasingly prioritize connected home solutions that enhance lifestyle convenience and reduce energy consumption.
- Urbanization trends and improving internet infrastructure are creating favorable conditions for smart appliance penetration. The forecast period through 2030 will see intensified competition as both regional and global manufacturers establish stronger footholds in Rest Of Asia Pacific.
- Rising awareness of smart home benefits, coupled with declining device costs and improved local distribution networks, will further democratize access to these technologies.
- Strategic investments in manufacturing capabilities and consumer education will be critical for capturing market share in this high-growth region..
Market Ecosystem
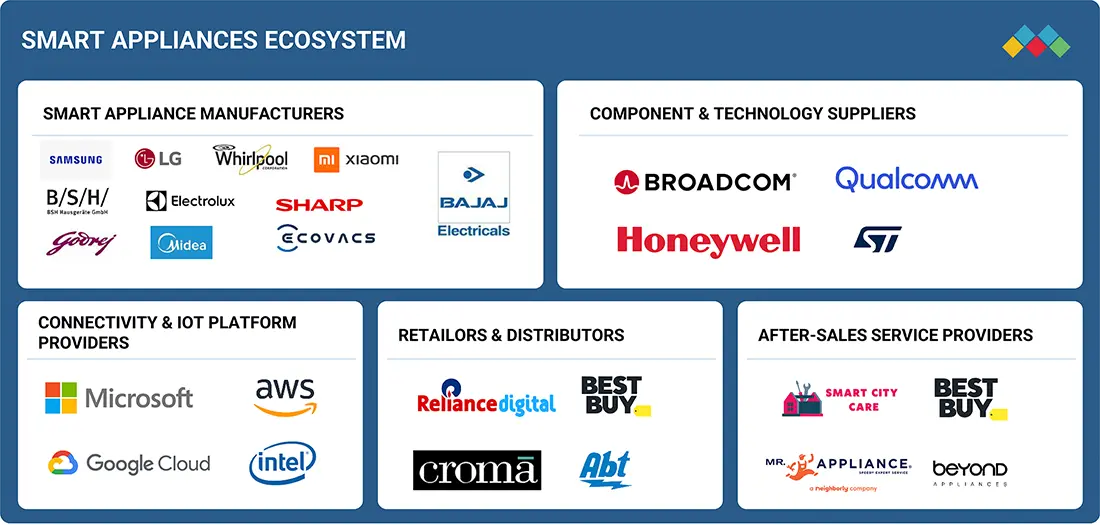
Smart Appliances Market: COMMERCIAL USE CASES ACROSS INDUSTRIES
| COMPANY | USE CASE DESCRIPTION | BENEFITS |
|---|---|---|
 |
Panasonic introduced a facial recognition system at Denmark’s football stadium to enhance security by identifying and preventing troublemakers from entering. | Improved stadium safety | Reduced manual checks | Encouraged fans and families to return to matches |
 |
Haier implemented IoT-based Smart Laundry solutions in China, integrating mobile apps for cycle monitoring and predictive maintenance. | Reduced equipment downtime | Improved customer experience | Lowered operational costs for service providers |
 |
Whirlpool partnered with Amazon Alexa and Google Assistant to enable voice-controlled smart ovens, dishwashers, and washing machines. | Increased consumer convenience | Seamless integration with connected home ecosystems | Better appliance efficiency monitoring |
 |
LG Electronics introduced ThinQ-enabled AI smart refrigerators in Europe, providing automated grocery tracking and energy-saving modes. | Enhanced food management | Reduced energy consumption | Improved sustainability by minimizing food waste |
 |
Miele rolled out Wi-Fi–enabled dishwashers and ovens with remote diagnostics and smart cooking programs in Germany. | Boosted customer satisfaction through predictive maintenance | Better food preparation outcomes | Reduced servicing delays |
Logos and trademarks shown above are the property of their respective owners. Their use here is for informational and illustrative purposes only.
Related Ecosystem
Electrical System And Components
- Natural Language Processing (NLP)
- Sensors
- Machine Learning
- Temperature Sensors
- Actuators
- ABB India Limited
- Siemens ag
- SCHNEIDER ELECTRIC SE
- Eaton Corporation plc
- General Electric Company
Electronics System And Components
- Sensors
- Temperature Sensors
- Pressure Sensors
- Actuators
- Image Sensors
- Lenovo
- Samsung
- Texas Instruments Incorporated
- HONEYWELL INTERNATIONAL INC.
- Teledyne Technologies Incorporated
Key Takeaways
- Rest Of Asia Pacific's smart appliances market is valued at $2,327.2 million in 2025 and will reach $3,907.1 million by 2030, representing a 10.9% CAGR.
- Rest Of Asia Pacific is driven by urbanization, rising disposable incomes, and growing consumer demand for energy-efficient connected home solutions.
- Rest Of Asia Pacific's emerging middle-class population and improving digital infrastructure are accelerating smart appliance adoption across the region.
- Rest Of Asia Pacific presents significant opportunities for manufacturers offering competitively priced IoT-enabled appliances tailored to local consumer preferences.
Smart Appliances Market Report Scope
| Report Metric | Details |
|---|---|
| Base Year | 2025 |
| Fastest Growing Segment | VACUUM CLEANING ROBOTS (Product) |
| Forecast Period | 2025-2030 |
| Growth Rate | CAGR of 11% from 2025 to 2030 |
| Largest Segment | WI-FI (Connectivity) |
| Market Size Base Year (Billions) | ~USD 42.3 (2025) |
| Revenue Forecast (Billions) | ~USD 71.28 (2030) |
| Segments Covered | Product, Vertical, Sales Channel, Connectivity |
Rest Of Asia Pacific Smart Appliances Market Report Segmentation
4 segment dimensions are covered across the global market.
By Product
- Air Conditioners
- Air Purifiers
- Coffee Makers
- Cookers/Cooking Robots
- Dishwashers
- Microwaves
- Other Smart Appliances
- Ovens & Cooktops
- Refrigerators
- Vacuum Cleaning Robots
- Washing Machines & Dryers
- Water Heaters
By Vertical
- Commercial
- Residential
By Sales Channel
- Offline
- Online
By Connectivity
- Bluetooth
- Wi-Fi
- Wifi
Target Audience
- Appliance Manufacturers : Smart appliance producers need Rest Of Asia Pacific-specific market data to develop localized product strategies, identify high-potential sub-markets, and optimize manufacturing and distribution investments in this 10.9% CAGR growth region.
- Technology & IoT Companies : IoT platform providers and smart home technology firms require detailed Rest Of Asia Pacific insights to identify partnership opportunities, assess market readiness, and develop region-appropriate connectivity and integration solutions.
- Retail & Distribution Partners : Distributors and retailers operating in Rest Of Asia Pacific need market forecasts and consumer behavior data to optimize inventory management, plan store layouts, and develop effective go-to-market strategies for smart appliances.
- Investment & Private Equity Firms : Investors evaluating opportunities in Rest Of Asia Pacific's smart appliances sector require comprehensive market analysis, growth projections, and competitive intelligence to assess investment viability and potential returns.
- Market Strategists & Consultants : Business consultants and strategic planners need Rest Of Asia Pacific-specific market data to advise clients on market entry, competitive positioning, and growth strategies within this rapidly expanding regional market.
Reasons to Buy this Report
- Regional Market Sizing & Forecasts : Obtain precise valuation data specific to Rest Of Asia Pacific ($2,327.2M in 2025) with detailed 5-year projections to 2030, enabling accurate business planning and investment decisions tailored to this high-growth region.
- Competitive Landscape Intelligence : Understand market dynamics, key players, and competitive positioning within Rest Of Asia Pacific to identify partnership opportunities, market entry strategies, and differentiation approaches for this emerging market.
- Growth Driver Analysis : Gain insights into region-specific growth catalysts including urbanization rates, disposable income trends, and energy efficiency awareness that directly influence smart appliance adoption in Rest Of Asia Pacific.
- Consumer Behavior & Preferences : Access detailed analysis of Rest Of Asia Pacific consumer preferences, purchasing patterns, and technology adoption rates to inform product development, marketing strategies, and localization efforts.
- Investment & Expansion Strategy : Leverage comprehensive market intelligence to evaluate expansion opportunities, assess market entry risks, and prioritize resource allocation across Rest Of Asia Pacific's diverse sub-markets and demographics.
Frequently asked questions
What is the market size of smart appliances in Rest Of Asia Pacific?
Rest Of Asia Pacific's smart appliances market is estimated at $2,327.2 million in 2025 and is projected to grow to $3,907.1 million by 2030.
What is the CAGR for smart appliances in Rest Of Asia Pacific?
Rest Of Asia Pacific's smart appliances market is expected to grow at a compound annual growth rate of 10.9% from 2025 to 2030.
What factors are driving growth in Rest Of Asia Pacific's smart appliances market?
Rest Of Asia Pacific's market growth is driven by urbanization, rising disposable incomes, smartphone penetration, improved digital infrastructure, and increasing consumer awareness of energy efficiency and smart home convenience.
Which product categories are most popular in Rest Of Asia Pacific?
Rest Of Asia Pacific consumers are increasingly adopting connected refrigerators, washing machines, air conditioning units, and kitchen appliances that offer remote monitoring and automation capabilities.
What opportunities exist for manufacturers in Rest Of Asia Pacific?
Rest Of Asia Pacific presents significant opportunities for manufacturers offering competitively priced, locally tailored IoT-enabled appliances that address the needs of the region's emerging middle-class consumers seeking convenience and sustainability.
RESEARCH METHODOLOGY
The study used four major activities to estimate the market size of smart appliances. Exhaustive secondary research was conducted to gather information on the market and its peer and parent markets. The next step was to validate these findings, assumptions, and sizing with industry experts across the value chain through primary research. Both top-down and bottom-up approaches were employed to estimate the total market size. Finally, market breakdown and data triangulation methods were utilized to estimate the market size for different segments and subsegments.
Secondary Research
The research methodology used to estimate and forecast the size of the smart appliances market began with the acquisition of data related to the revenues of key vendors in the market through secondary research. Various secondary sources have been referred to in the secondary research process to identify and collect information for this study. Secondary sources include annual reports, press releases, and investor presentations of companies; white papers, journals, certified publications, and articles by recognized authors; websites; directories; and databases. Secondary research has mainly been used to obtain key information about the value chain of the smart appliances market, key players, market classification, and segmentation according to the industry trends to the bottom-most level, geographic markets, and key developments from both market and technology-oriented perspectives. The secondary research referred to for this research study involves various white papers, such as User Interface Design for Smart Appliances, Study on Smart Appliances, Next-Generation Smart Home: Building for the Future, and various other sources. Moreover, the study involved extensive use of secondary sources, directories, and databases, such as Hoovers, Bloomberg Businessweek, and Factiva, to identify and collect valuable information for a technical, market-oriented, and commercial study of the smart appliances market.
Primary Research
In the primary research process, various primary sources from both the supply and demand sides have been interviewed to obtain the qualitative and quantitative information relevant to this report. Primary sources from the supply side include key industry participants, subject-matter experts (SMEs), and C-level executives and consultants from various key companies and organizations in the smart appliances ecosystem. After the complete market engineering (including calculations for the market statistics, the market breakdown, the market size estimations, the market forecasting, and the data triangulation), extensive primary research has been conducted to verify and validate the critical market
numbers obtained. Several primary interviews have been conducted with market experts from the demand and supply-side players across key regions: North America, Europe, Asia Pacific, and the Rest of the World (Middle East, Africa, and South America).
Primary data has been collected through questionnaires, emails, and telephone interviews. In the canvassing of primaries, various departments within organizations, such as sales, operations, and administration, were covered to provide a holistic viewpoint in our report. This and the opinions of in-house subject matter experts have led us to the findings described in the remainder of this report.
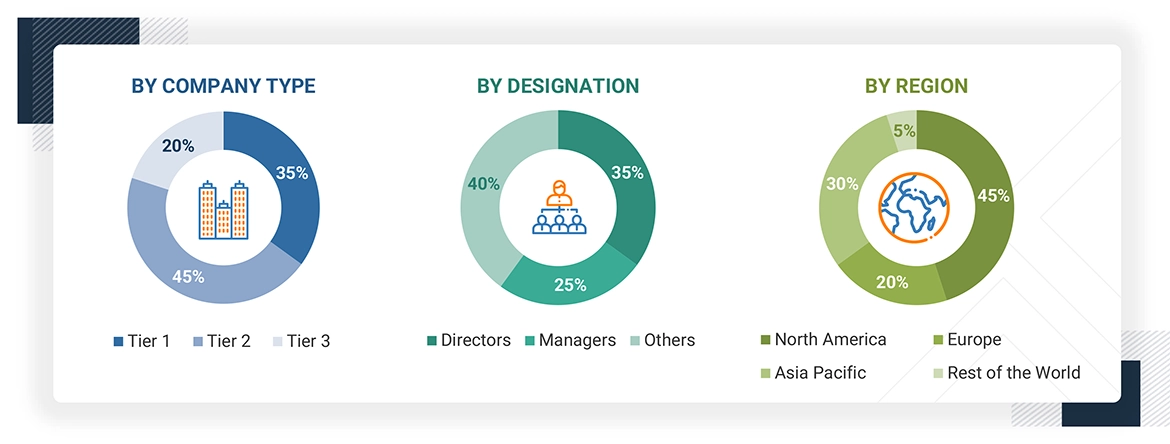
Note: The three tiers of the companies are defined based on their total revenue in 2024: Tier 1 - revenue greater than or equal to USD 1 billion; Tier 2 - revenue between USD 100 million and USD 1 billion; and Tier 3 revenue less than or equal to USD 100 million. Other designations include sales managers, marketing managers, and product managers.
To know about the assumptions considered for the study, download the pdf brochure
Market Size Estimation
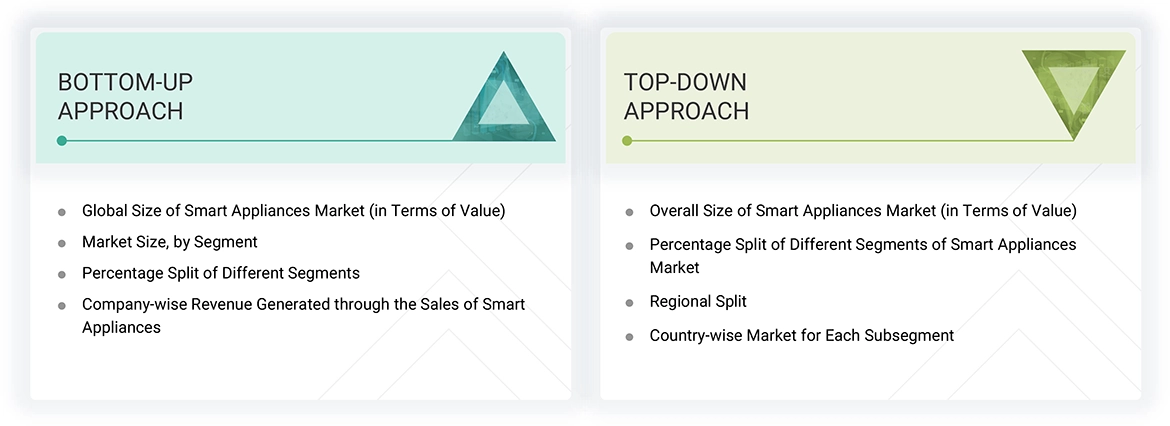
Both top-down and bottom-up approaches were utilized to estimate and validate the size of the smart appliances market and its submarkets. Secondary research was conducted to identify the key players in the market, and primary and secondary research were used to determine their market share in specific regions. The entire process involved studying top players' annual and financial reports and conducting extensive interviews with industry leaders such as CEOs, VPs, directors, and marketing executives. Secondary sources were used to determine all percentage shares and breakdowns, which were verified through primary sources. All parameters that could impact the markets covered in this research study were accounted for, analyzed in detail, verified through primary research, and consolidated to obtain the final quantitative and qualitative data.
Smart Appliances Market : Top-Down and Bottom-Up Approach
Data Triangulation
Once the overall size of the smart appliances market was determined using the methods described above, it was divided into multiple segments and subsegments. Market engineering was performed for each segment and subsegment using market breakdown and data triangulation methods, as applicable, to obtain accurate statistics. To triangulate the data, various factors and trends from the demand and supply sides were studied. The market was validated using both the top-down and bottom-up approaches.
Market Definition
The smart appliances market comprises a wide range of connected and intelligent household and commercial devices that enhance convenience, efficiency, and energy management. These offerings are designed to simplify daily tasks, optimize energy consumption, and provide seamless user experiences. Smart appliances are segmented by product type into refrigerators, washing machines and dryers, dishwashers, ovens and cooktops, air conditioners, water heaters, microwaves, coffee makers, vacuum cleaning robots, air purifiers, cookers/cooking robots, and other smart appliances.
By connectivity type, these appliances leverage Wi-Fi and Bluetooth to enable remote control, automation, and integration into broader smart home ecosystems. Through online and offline sales channels, smart appliances are accessible to both residential and commercial consumers, supporting daily operations, convenience, and energy efficiency. Smart appliances contribute to sustainable living, smarter energy usage, and more connected, intuitive environments, driving adoption across urban and emerging markets globally.
Key Stakeholders
- Manufacturers and suppliers
- Component Suppliers
- Software & Platform Providers
- Distributors & Retailers
- System Integrators & Service Providers
- Telecom & Connectivity Providers
- Regulatory & Standards Bodies
- End-user industries
- Research & Development Firms
Report Objectives
- To estimate and forecast the size of the smart appliances market, in terms of value, based on product, connectivity, sales channel, vertical, and region
- To describe and forecast the market size, in terms of value, for four major regions - North America, Europe, Asia Pacific, and the Rest of World (RoW)
- To provide detailed information regarding major factors such as drivers, restraints, opportunities, and challenges influencing market growth
- To provide a detailed overview of the smart appliances value chain
- To strategically analyze micromarkets regarding individual market trends, growth prospects, and contributions to the total market
- To strategically profile key players and comprehensively analyze their market position in terms of ranking and core competencies, along with a detailed competitive landscape for the market leaders
- To analyze major growth strategies such as product launches/developments and acquisitions adopted by the key market players to enhance their market position
- To assess the impact of AI on the growth and adoption of the smart appliances market
Available Customizations
With the given market data, MarketsandMarkets offers customizations according to the specific requirements of companies. The following customization options are available for the report:
- Detailed analysis and profiling of additional market players (up to 5)
- Additional country-level analysis of the smart appliances market
Product Analysis
- Product matrix, which provides a detailed comparison of the product portfolio of each company in the smart appliances market.
Get the Full Smart Appliances Market Report
Full forecast, segment splits, and company analysis for all Smart Appliances Market.
- Canada Smart Appliances Market
- Mexico Smart Appliances Market
- US Smart Appliances Market
- France Smart Appliances Market
- Germany Smart Appliances Market
- Italy Smart Appliances Market
- Rest Of Europe Smart Appliances Market
- UK Smart Appliances Market
- China Smart Appliances Market
- India Smart Appliances Market
- Japan Smart Appliances Market
- South Korea Smart Appliances Market
Need a Tailored Report?
Customize this report to your needs
Get 10% FREE Customization
Customize This Report
