
Asia Pacific Smart Factory Market (2025-2030)

The Asia Pacific Smart Factory Market was valued at $40240.4 Million in 2025 and projected to reach to $69714.4 Million by 2030, representing a compound annual growth rate of 11.6%. Asia Pacific's smart factory market is positioned for sustained expansion through 2030, driven by China's manufacturing dominance, Japan's technological innovation, and India's emerging industrial base.


| Market Size in | USD 26.32 MN |
| Market Forecast in | |
| CAGR | |
| Forecast Period | |
| Units Considered | Value (USD MN) |
Asia Pacific Smart Factory Market Trends and Insights
- In 2025, Asia Pacific's smart factory market is estimated at $40.24 billion USD, driven by rapid industrialization, digital transformation initiatives, and increasing adoption of Industry 4.0 technologies across manufacturing facilities.
- The region is projected to expand significantly, reaching $69.71 billion USD by 2030, reflecting a compound annual growth rate (CAGR) of 11.6%. Asia Pacific's growth trajectory outpaces the global average of 10.2%, underscoring the region's strategic importance in smart factory deployment.
- Key drivers include government support for automation, rising labor costs spurring factory modernization, and substantial investments in IoT, artificial intelligence, and robotics integration.
- Asia Pacific manufacturers are increasingly leveraging smart factory solutions to enhance productivity, reduce operational costs, and maintain competitive advantage in global supply chains. The region's diverse industrial base—spanning electronics, automotive, pharmaceuticals, and consumer goods—creates substantial demand for intelligent manufacturing systems.
- Asia Pacific's position as a global manufacturing powerhouse ensures sustained momentum through 2030, with emerging economies accelerating digital factory adoption alongside established industrial leaders..
Key Market Statistics
- CAGR (2025-2030) 11.6% CAGR
- Market Size, 2025 ~USD 40240.4 Million
- Forecast, 2030 ~USD 69714.4 Million
- Geography Asia Pacific
Asia Pacific Smart Factory Market Overview
Market Leadership :
Asia Pacific commands 71% of the global smart factory market in 2025, with China alone representing $28.86 billion USD. The region's dominance reflects its position as the world's manufacturing powerhouse and early adopter of Industry 4.0 technologies.
Robust Growth Trajectory :
The Asia Pacific smart factory market is projected to grow from $40.24 billion in 2025 to $69.71 billion by 2030, representing a 11.6% CAGR—outpacing the global average of 10.2%. This accelerated growth is driven by government digitalization initiatives and competitive manufacturing pressures.
Diverse Market Composition :
Japan ($14.03B), India ($6.26B), and South Korea ($6.66B) represent significant secondary markets alongside China. Australia, Indonesia, Thailand, Vietnam, and Malaysia contribute emerging opportunities, with combined market value exceeding $13 billion USD.
Industry 4.0 Adoption Surge :
Rapid industrialization across Asia Pacific, coupled with government support for smart manufacturing and digital transformation initiatives, is accelerating adoption of IoT, AI, robotics, and advanced automation in semiconductor and electronics facilities.
Asia Pacific Smart Factory Market Dynamics
- Government policies promoting Industry 4.0 adoption, coupled with rising labor costs and competitive pressures, are compelling manufacturers to invest in automation and digital solutions.
- The region's semiconductor and electronics sectors are particularly active in deploying smart factory technologies to enhance productivity and supply chain resilience. Key growth catalysts include increasing foreign direct investment in manufacturing hubs, rising demand for consumer electronics and semiconductors, and accelerating digital transformation across supply chains.
- Emerging economies like Vietnam, Indonesia, and Thailand are rapidly adopting smart factory solutions, while established markets like Japan and South Korea continue to innovate.
- The 11.6% CAGR reflects strong momentum, with market value expected to nearly double by 2030, solidifying Asia Pacific's role as the global epicenter of smart manufacturing innovation..
Market Ecosystem
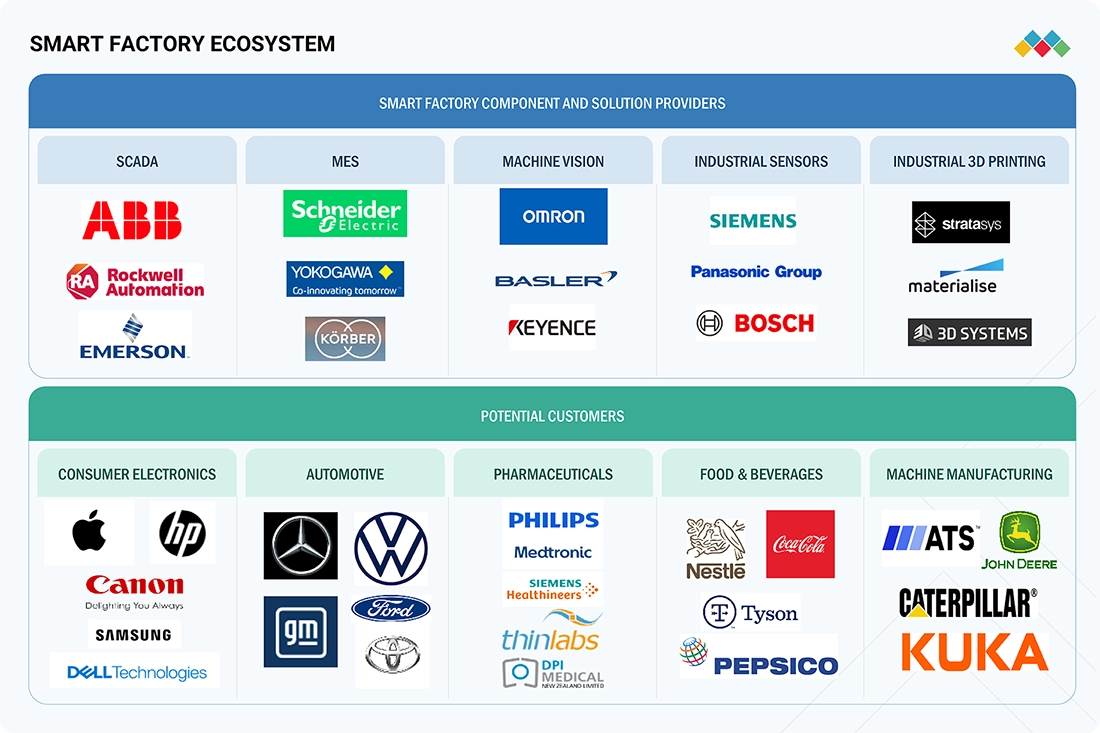
Smart Factory Market Trends: COMMERCIAL USE CASES ACROSS INDUSTRIES
| COMPANY | USE CASE DESCRIPTION | BENEFITS |
|---|---|---|
 |
Intelligent automation systems, robotics, and digital twins to optimize manufacturing and assembly lines | Increased operational efficiency, predictive maintenance, reduced downtime, scalable smart factory deployment |
 |
Advanced process control, industrial IoT (IIoT) platforms, and real-time data analytics for production lines | Enhanced productivity, real-time visibility, improved decision-making, reduced operational costs |
 |
Connected factory solutions integrating sensors, analytics, and cybersecurity for end-to-end automation | Improved plant safety, better asset management, energy efficiency, and enhanced regulatory compliance |
 |
Smart manufacturing systems using edge computing, industrial control, and AI-based analytics | Faster time to market, real-time optimization, agile production, reduced waste |
 |
EcoStruxure platform enabling smart energy management and automation across manufacturing environments | Sustainable operations, lower energy consumption, improved machine uptime, integrated systems control |
Logos and trademarks shown above are the property of their respective owners. Their use here is for informational and illustrative purposes only.
Related Ecosystem
Industrial Automation
- Sensors
- Image Sensors
- Manufacturing Execution System (MES)
- Actuators
- Flow Sensors
- Siemens ag
- ABB India Limited
- Emerson Electric Co.
- HONEYWELL INTERNATIONAL INC.
- SCHNEIDER ELECTRIC SE
Industrial Iot
- Sensors
- Pressure Sensors
- Flow Sensors
- Gas Sensors
- Image Sensors
- Siemens ag
- ABB India Limited
- HONEYWELL INTERNATIONAL INC.
- Emerson Electric Co.
- SCHNEIDER ELECTRIC SE
Key Takeaways
- Asia Pacific smart factory market valued at $40.24B in 2025, expanding to $69.71B by 2030 at 11.6% CAGR
- Asia Pacific growth rate of 11.6% exceeds global CAGR of 10.2%, reflecting accelerated regional adoption
- Government automation initiatives and rising labor costs drive Asia Pacific manufacturers toward smart factory solutions
- Asia Pacific's diverse industrial ecosystem across electronics, automotive, and pharmaceuticals sustains long-term market expansion
Smart Factory Market Report Scope
| Report Metric | Details |
|---|---|
| Base Year | 2025 |
| Fastest Growing Segment | INDUSTRIAL 3D PRINTING (Component) |
| Forecast Period | 2025–2030 |
| Growth Rate | CAGR of 10.2% from 2025 to 2030 |
| Largest Segment | PROCESS INDUSTRIES (Industry) |
| Market Size Base Year (Billions) | ~USD 104.44 (2025) |
| Revenue Forecast (Billions) | ~USD 169.73 (2030) |
| Segments Covered | Component, Sensor Type, Industry, Process Industries, Discrete Industries, Type, Offering, Solution, Deployment Mode |
Asia Pacific Smart Factory Market Report Segmentation
9 segment dimensions are covered across the global market.
By Component
- Cameras
- Frame Grabbers
- Industrial 3D Printing
- Industrial Robots
- Industrial Sensors
- Led Lighting
- Machine Vision
- Optics
- Other Hardware Components
- Processors
- Software
By Sensor Type
- Flow Sensors
- Force Sensors
- Gas Sensors
- Humidity & Moisture Sensors
- Image Sensors
- Level Sensors
- Position Sensors
- Pressure Sensors
- Temperature Sensors
By Industry
- Discrete Industries
- Process Industries
By Process Industries
- Chemicals
- Energy & Power
- Food & Beverages
- Metals & Mining
- Oil & Gas
- Other Process Industries
- Pharmaceuticals
- Pulp & Paper
By Discrete Industries
- Aerospace & Defense
- Automotive
- Machine Manufacturing
- Medical Devices
- Other Discrete Industries
- Semiconductor & Electronics
By Type
- Articulated Robots
- Cartesian Robots
- Collaborative Robots
- Cylindrical Robots
- Other Traditional Robots
- Parallel Robots
- Scara Robots
- Traditional Robots
By Offering
- Hardware
- Material
- Printer
- Service
- Services
- Software
By Solution
- Industrial Safety
- Mes
- Pam
- Scada
By Deployment Mode
- Cloud
- Hybrid
- On-Premises
Target Audience
- Manufacturing Technology Vendors : Smart factory solution providers, IoT platform developers, and automation equipment manufacturers need Asia Pacific market data to identify high-potential customer segments, prioritize regional expansion, and tailor offerings to local manufacturing needs.
- Semiconductor & Electronics OEMs : Manufacturers in the semiconductor and electronics sectors require detailed market intelligence to benchmark smart factory adoption rates, identify technology gaps, and plan digital transformation investments across their Asia Pacific operations.
- Private Equity & Investment Firms : Investors evaluating opportunities in manufacturing technology, industrial automation, and digital transformation need comprehensive Asia Pacific market sizing and growth forecasts to assess portfolio companies and identify acquisition targets.
- Government & Policy Makers : Regional and national government agencies developing Industry 4.0 initiatives and manufacturing competitiveness strategies require market data to inform policy decisions, incentive programs, and technology adoption roadmaps.
- Management Consultants & Analysts : Strategy consultants and business analysts advising manufacturing clients on digital transformation need Asia Pacific-specific market insights, competitive dynamics, and growth trends to develop credible recommendations and business cases.
Key Companies in the Asia Pacific Smart Factory Market
| Company | HQ | Ownership | Strongest segments |
|---|---|---|---|
| KORE WIRELESS GROUP | United States | Public Company | IoT connectivity-as-a-service,Connectivity enablement-as-a-service and location-based services,Device solutions and device management services, |
| SES S.A. | Canada | Public Company | Waste Management,Energy Infrastructure, |
| ALTRAN | France | Private Company | Engineering & R&D Services,Organization & IT Systems Consulting,Specialized Regulatory & Safety Consulting, |
| FOXCONN INDUSTRIAL INTERNET CO LTD | China | Public Company | Servers and storage hardware,Networking equipment,Industrial automation systems, |
| KEC INTERNATIONAL LIMITED | India | Public Company | Transmission line EPC (including towers and lines),Substations and power distribution EPC,Railway and transport EPC, |
| ELECTROCOMPONENTS | United Kingdom | Public Company | Automation, control and electrification,Cables, connectors, semiconductors and passive components,Mechanical and fluid power (transmission, pneumatics, hydraulics), |
| LENOVO | China | Public Company | Commercial SFF PCs and embedded signage controllers,Thin clients and dedicated media players,Tablets and smart devices for kiosks/POS displays, |
| ZENSAR TECHNOLOGIES LTD | India | Public Company | Digital and Application Services,Cloud Infrastructure and Security Services,Brand, Creative, and Marketing/Insights Solutions, |
| ABB | Switzerland | Public Company | Electrification,Motion,Automation, |
| EMERSON ELECTRIC CO. | United States | Public Company | Final Control,Measurement & Analytical,Discrete Automation, |
| SIEMENS | Germany | Public Company | Digital Industries (automation, PLM, simulation),Smart Infrastructure (electrification, buildings, grid),Mobility (rail systems and services), |
| SCHNEIDER ELECTRIC | France | Public Company | Low- and Medium-Voltage Products and Systems,Building Management, Power Metering, and Cooling,Industrial Automation and Drives, |
| ROCKWELL AUTOMATION, INC. | United States | Public Company | Intelligent Devices,Software & Control,Lifecycle Services, |
| HONEYWELL INTERNATIONAL INC. | United States | Public Company | Industrial Automation,Building Automation,Energy and Sustainability Solutions (UOP and digital), |
| MITSUBISHI ELECTRIC CORPORATION | Japan | Public Company | Infrastructure, Energy, Defense & Space Systems,Factory Automation & Industrial Systems,Automotive Equipment, |
| GE VERNOVA | United States | Public Company | Power (gas, nuclear, hydro, steam),Wind (onshore and offshore),Electrification (grid, power conversion, software, solar and storage), |
| YOKOGAWA ELECTRIC CORPORATION | Japan | Public Company | Control Business (DCS, control systems, field instruments, software, services),Measuring Instruments Business (waveform, optical communications, signal generators, power/temperature/pressure instruments),New Businesses and Other (industrial IoT, cloud, life science, solutions), |
| OMRON CORPORATION | Japan | Public Company | Industrial Automation (sensors, safety, motion, robotics, automation systems),Device and Module Solutions (relays, switches, connectors, components),Healthcare (cardiovascular, respiratory, pain management, remote monitoring), |
| FANUC CORPORATION | Japan | Public Company | CNC systems and servo/laser FA components,Industrial robots,Robomachines (machining centers, electric injection molding, wire EDM), |
| STRATASYS | United States | Public Company | FDM printers and consumables,PolyJet, DentaJet, and Digital Anatomy solutions,SAF, Origin P3, and Neo SLA industrial systems, |
KORE WIRELESS GROUP
KORE WIRELESS GROUP is a public company founded in 2002 in the United States with 403 employees.
SES S.A.
SES S.A. is a public company founded in 2007 in Canada with 1937 employees.
ALTRAN
ALTRAN is a private company founded in 1970 in France with 50124 employees.
FOXCONN INDUSTRIAL INTERNET CO LTD
FOXCONN INDUSTRIAL INTERNET CO LTD is a public company founded in 2015 in China with 217084 employees.
KEC INTERNATIONAL LIMITED
KEC INTERNATIONAL LIMITED is a public company founded in 1945 in India with 6709 employees.
ELECTROCOMPONENTS
ELECTROCOMPONENTS is a public company founded in 1937 in the United Kingdom with 8500 employees.
LENOVO
LENOVO is a public company founded in 1984 and based in China.
ZENSAR TECHNOLOGIES LTD
ZENSAR TECHNOLOGIES LTD is a public company founded in 1963 in India with 10066 employees.
ABB
ABB is a public company founded in 1883 in Switzerland with 112700 employees.
EMERSON ELECTRIC CO.
EMERSON ELECTRIC CO. is a public company founded in 1890 in the United States with 71000 employees.
SIEMENS
SIEMENS is a public company founded in 1847 in Germany with 310312 employees.
SCHNEIDER ELECTRIC
SCHNEIDER ELECTRIC is a public company founded in 1836 in France with 158122 employees.
ROCKWELL AUTOMATION, INC.
ROCKWELL AUTOMATION, INC. is a public company founded in 1903 in the United States with 26000 employees.
HONEYWELL INTERNATIONAL INC.
HONEYWELL INTERNATIONAL INC. is a public company founded in 1885 in the United States with 101000 employees.
MITSUBISHI ELECTRIC CORPORATION
MITSUBISHI ELECTRIC CORPORATION is a public company founded in 1921 in Japan with 150386 employees.
GE VERNOVA
GE VERNOVA is a public company founded in 2023 in the United States with 78000 employees.
YOKOGAWA ELECTRIC CORPORATION
YOKOGAWA ELECTRIC CORPORATION is a public company founded in 1915 in Japan with 18313 employees.
OMRON CORPORATION
OMRON CORPORATION is a public company founded in 1933 in Japan with 26050 employees.
FANUC CORPORATION
FANUC CORPORATION is a public company founded in 1950 in Japan with 10040 employees.
STRATASYS
STRATASYS is a public company founded in the United States with 1757 employees.
Countries within Asia Pacific - compare and drill down
| Country | 2025 size (native) |
|---|---|
| Australia | USD 2671.8 Million |
| China | USD 28859.5 Million |
| India | USD 6256.4 Million |
| Indonesia | USD 1888.7 Million |
| Japan | USD 14029.7 Million |
| Malaysia | USD 803.2 Million |
| South Korea | USD 6655.7 Million |
| Thailand | USD 977.4 Million |
| Vietnam | USD 380.3 Million |
| Rest Of Asia Pacific | USD 7191.6 Million |
Country market size visualization
Reasons to Buy this Report
- Regional Market Dominance Insights : Understand why Asia Pacific controls 71% of global smart factory market share and how China, Japan, and India are reshaping manufacturing technology adoption across the semiconductor and electronics sectors.
- Country-Level Competitive Intelligence : Access detailed market sizing for 9 Asia Pacific countries, enabling targeted go-to-market strategies and competitive positioning in high-growth markets like India ($6.26B) and emerging hubs like Vietnam and Indonesia.
- Growth Acceleration Opportunity : Capitalize on the 11.6% CAGR—exceeding global average by 140 basis points. Identify investment opportunities in fast-growing segments and emerging markets before competitors establish market presence.
- Industry 4.0 Adoption Trends : Gain actionable insights into smart factory technology adoption patterns, government digitalization initiatives, and manufacturing automation trends specific to Asia Pacific's semiconductor and electronics industries.
- Strategic Expansion Planning : Leverage comprehensive market forecasts through 2030 to inform product development, partnership strategies, and resource allocation across Asia Pacific's diverse manufacturing ecosystems and regulatory environments.
Frequently asked questions
What is the current size of the Asia Pacific smart factory market?
In 2025, Asia Pacific's smart factory market is estimated at $40.24 billion USD, making it a dominant segment within the global smart factory industry.
What is the projected market size for Asia Pacific smart factories by 2030?
Asia Pacific's smart factory market is forecasted to reach $69.71 billion USD by 2030, representing substantial growth over the five-year period.
How does Asia Pacific's growth rate compare to the global smart factory market?
Asia Pacific's CAGR of 11.6% outpaces the global CAGR of 10.2%, indicating faster regional adoption and investment in smart factory technologies.
What factors are driving smart factory adoption in Asia Pacific?
Key drivers include government support for Industry 4.0, rising labor costs, digital transformation mandates, and increasing investments in IoT, AI, and robotics integration across manufacturing sectors.
Which industries in Asia Pacific are leading smart factory adoption?
Electronics, semiconductors, automotive, pharmaceuticals, and consumer goods sectors are driving smart factory deployment across Asia Pacific, leveraging automation to enhance competitiveness.
RESEARCH METHODOLOGY
The research study involved four major steps in estimating the size of the smart factory market. Exhaustive secondary research has been done to collect important information about the market and peer markets. The next step has been to validate these findings and assumptions and size them with the help of primary research with industry experts across the value chain. Both top-down and bottom-up approaches have been used to estimate the market size. After this, the market breakdown and data triangulation approaches have been adopted to estimate the market sizes of segments and subsegments.
Secondary Research
Various secondary sources were referred to in the secondary research process to identify and collect the information required for this study. These sources include annual reports, press releases, investor presentations of companies, white papers, and articles from recognized authors. Secondary research was mainly done to obtain key information about the market’s value chain, the pool of key market players, market segmentation according to industry trends, regional outlook, and developments from market and technology perspectives.
In the smart factory market report, the global market size has been estimated using the top-down and bottom-up approaches, along with several other dependent submarkets. The major players in the market were identified using extensive secondary research, and their presence in the market was determined using secondary and primary research. All the percentage splits and breakdowns have been determined using secondary sources and verified through primary sources.
Primary Research
Extensive primary research has been conducted after understanding the smart factory market scenario through secondary research. Several primary interviews have been conducted with key opinion leaders from demand- and supply-side vendors across four major regions—North America, Europe, Asia Pacific, and RoW. Approximately 40% of the primary interviews were conducted with the demand-side vendors and 60% with the supply-side vendors. Primary data has been collected mainly through telephonic interviews, which consist of 80% of the total primary interviews; questionnaires and emails have also been used to collect the data.
After successful interaction with industry experts, brief sessions were conducted with highly experienced independent consultants to reinforce the findings of our primary research. This, along with the in-house subject matter experts’ opinions, led us to the findings described in the report. The breakdown of primary respondents is as follows:
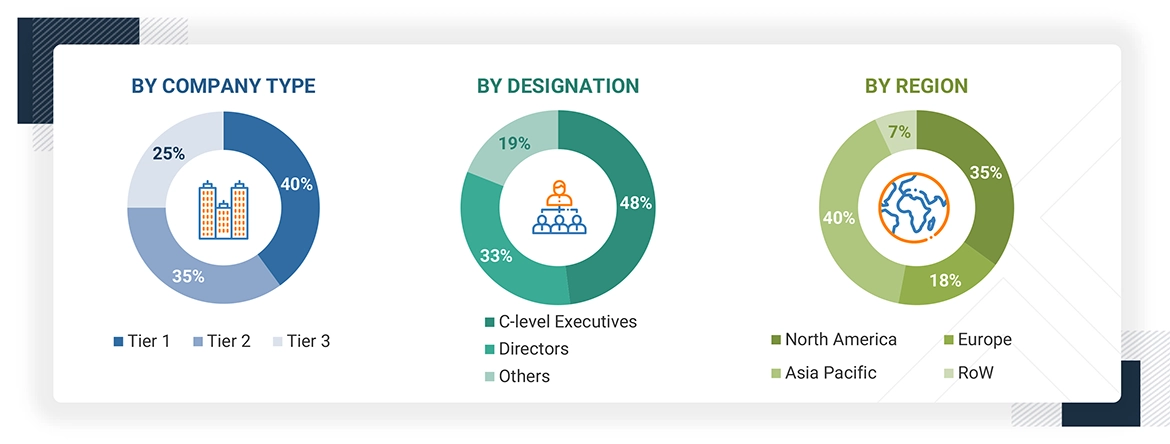
Note: Others include sales, marketing, and product managers. RoW comprises the Middle East, Africa, and South America. Three tiers of companies have been defined based on their total revenue as of 2024: tier 3: revenue less than USD 500 million; tier 2: revenue between USD 500 million and USD 1 billion; and tier 1: revenue more than USD 1 billion.
To know about the assumptions considered for the study, download the pdf brochure
Market Size Estimation
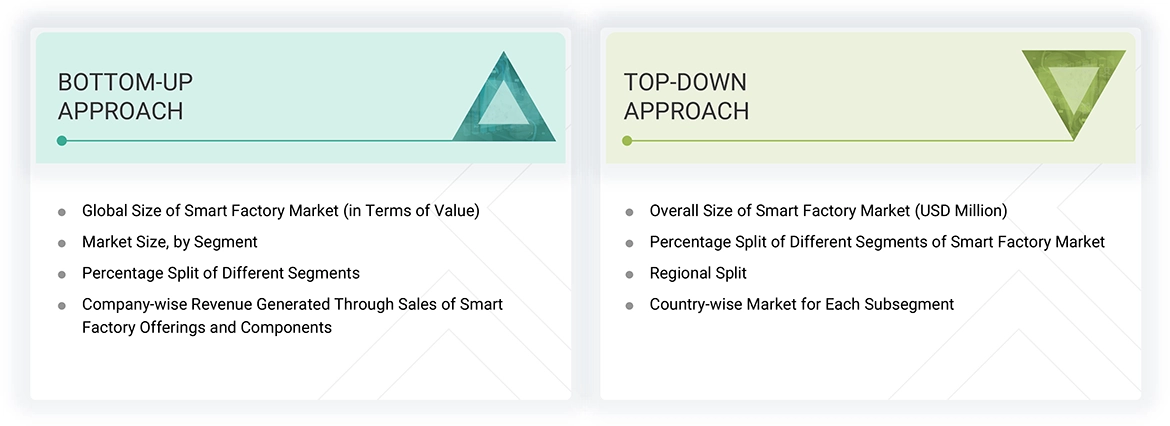
In the complete market engineering process, top-down and bottom-up approaches and several data triangulation methods have been used to estimate and forecast the overall market segments and subsegments listed in this report. The key players in the market have been identified through secondary research, and their market shares in the respective regions have been determined through primary and secondary research. This entire procedure includes the study of annual and financial reports of the top market players and extensive interviews for key insights (quantitative and qualitative) with industry experts (CEOs, VPs, directors, and marketing executives).
All percentage shares, splits, and breakdowns have been determined using secondary sources and verified through primary sources. All the parameters affecting the markets covered in this research study have been accounted for, viewed in detail, verified through primary research, and analyzed to obtain the final quantitative and qualitative data. This data has been consolidated and supplemented with detailed inputs and analysis from MarketsandMarkets and presented in this report.
Bottom-Up Approach
- Identifying various industries using or expected to deploy different types of smart factory solutions at their facilities
- Analyzing use cases across regions and companies
- Estimating the size of the smart factory market based on the demand from these industries and companies
- Tracking the ongoing and upcoming installation contracts, acquisitions, expansions, and product launches by various companies, and forecasting the market based on these developments and other critical parameters
- Conducting multiple discussions with key opinion leaders to understand smart factory components and solutions by companies in these industries, and analyzing the breakdown of the scope of work carried out by each major company providing smart factory components
- Arriving at the market estimates by analyzing the country-wise sales of smart factory solutions to companies, and combining this data to get the regional market estimates
- Verifying and cross-checking the estimates at each level through discussions with key opinion leaders, including CEOs, directors, operations managers, and domain experts at MarketsandMarkets
- Studying various paid and unpaid information sources, such as annual reports, press releases, and white papers
Top-Down Approach
- Information related to the revenue of key manufacturers and providers of smart factory components and solutions was studied and analyzed to estimate the global size of the smart factory market.
- Multiple discussions were conducted with key opinion leaders to understand the demand for smart factory components and analyze the break-up of the scope of work carried out by each major company.
- Revenue, geographic presence, key industries served, and the diverse offerings of all identified players in the smart factory market were studied to estimate and arrive at the percentage split of different market segments.
- All major players in the smart factory market were identified through secondary research and verified through brief discussions with industry experts.
- Multiple discussions were conducted with key opinion leaders of all major companies involved in developing smart factory solutions to validate the market split based on component, solution, industry, and region.
- Geographic splits were estimated through secondary sources based on factors such as the number of players offering smart factory solutions in a specific country or region, and the industries for which these players offer solutions.
Smart Factory Market : Top-Down and Bottom-Up Approach
Data Triangulation
After arriving at the overall market size from the estimation process explained above, the overall market has been split into several segments and subsegments. The data triangulation procedure has been employed wherever applicable to complete the overall market engineering process and arrive at the exact statistics for all segments and subsegments. The data has been triangulated by studying various factors and trends from both the demand and supply sides. Additionally, the market size has been validated using top-down and bottom-up approaches.
Market Definition
A smart factory is a highly digitalized and automated production system connected throughout all the production processes in a facility. It can self-optimize performance across a broad network, self-adapt to changing production conditions and requirements in real time, and autonomously run an entire production system. The main advantage of a smart factory is its ability to evolve with the changing needs of the organization. A smart factory uses a network to connect the virtual and physical elements of the production process to manufacturing operations. It represents an autonomous manufacturing environment that can handle any technical issues in real time during production using fragmented information and communication structures for the optimum management of production processes.
Key Stakeholders
- End Users
- Government Bodies, Venture Capitalists, and Private Equity Firms
- Smart Factory Manufacturers
- Smart Factory Solution & Component Distributors
- Smart Factory Industry Associations
- Professional Service/Solution Providers
- Research Institutions and Organizations
- Standards, Organizations, and Regulatory Authorities in Smart Factory Market
- System Integrators
- Technology Consultants
Report Objectives
- To describe and forecast the smart factory market, in terms of value, based on component, solution, and industry, in terms of value
- To forecast the market size for the four main regions—North America, Europe, Asia Pacific, and the Rest of the World (RoW), in terms of value
- To provide detailed information regarding the drivers, restraints, opportunities, and challenges influencing market growth
- To provide a detailed overview of the smart factory value chain and ecosystem
- To strategically analyze micromarkets with respect to individual growth trends, prospects, and contributions to the total market
- To strategically profile the key players and comprehensively analyze their market positions in terms of ranking and core competencies
- To analyze competitive developments, such as product launches, acquisitions, collaborations, agreements, and partnerships, in the smart factory market
- To provide ecosystem analysis, case study analysis, patent analysis, technology analysis, key conferences and events, Porter’s five forces analysis, regulatory landscape, impact of AI/Gen AI, and impact of the 2025 US Tariff on the smart factory market
- To provide a macroeconomic outlook for all the regions in the region chapter
Available customizations:
With the given market data, MarketsandMarkets offers customizations according to the specific requirements of companies. The following customization options are available for the report:
- Detailed analysis and profiling of additional market players based on various blocks of the supply chain
Get the Full Smart Factory Market Report
Full forecast, segment splits, and company analysis for all Smart Factory Market.
- Canada Smart Factory Market
- Mexico Smart Factory Market
- US Smart Factory Market
- France Smart Factory Market
- Germany Smart Factory Market
- Italy Smart Factory Market
- Nordics Smart Factory Market
- Poland Smart Factory Market
- Rest Of Europe Smart Factory Market
- Spain Smart Factory Market
- UK Smart Factory Market
- Australia Smart Factory Market
- China Smart Factory Market
- India Smart Factory Market
- Indonesia Smart Factory Market
- Japan Smart Factory Market
- Malaysia Smart Factory Market
- Rest Of Asia Pacific Smart Factory Market
- South Korea Smart Factory Market
- Thailand Smart Factory Market
- Vietnam Smart Factory Market
- North America Smart Factory Market
- Europe Smart Factory Market
- Rest of World Smart Factory Market
- Industrial Sensors Smart Factory Market
- Industrial Robots Smart Factory Market
- Industrial 3D Printing Smart Factory Market
- Machine Vision Smart Factory Market
- Mes Smart Factory Market
- Scada Smart Factory Market
- Pam Smart Factory Market
- Industrial Safety Smart Factory Market
Need a Tailored Report?
Customize this report to your needs
Get 10% FREE Customization
Customize This Report
