
Asia Pacific Water Bus Market (2024-2029)

The Asia Pacific Water Bus Market was valued at $243.6 Million in 2024 and projected to reach to $319.8 Million by 2029, representing a compound annual growth rate of 4.6%. The Asia Pacific water bus market is poised for sustained growth through 2029, driven by accelerating urbanization and government commitments to sustainable transportation infrastructure.


| Market Size in | USD 26.32 MN |
| Market Forecast in | |
| CAGR | |
| Forecast Period | |
| Units Considered | Value (USD MN) |
Asia Pacific Water Bus Market Trends and Insights
- Asia Pacific's water bus sector is driven by increasing urbanization, rising demand for sustainable public transportation, and government investments in maritime infrastructure across key economies.
- The region's strategic focus on reducing traffic congestion and carbon emissions positions Asia Pacific as a critical growth market within the global aerospace and defence sector. Asia Pacific's water bus market benefits from favorable demographic trends and expanding coastal city populations requiring alternative transit solutions.
- Between 2024 and 2029, Asia Pacific is expected to capture significant market share through technological advancements in vessel design and operational efficiency.
- The region's competitive landscape reflects diverse regulatory environments and varying levels of infrastructure development, creating both opportunities and challenges for stakeholders operating in Asia Pacific's water transportation ecosystem..
Key Market Statistics
- CAGR (2024-2029) 4.6% CAGR
- Market Size, 2024 ~USD 243.6 Million
- Forecast, 2029 ~USD 319.8 Million
- Geography Asia Pacific
Asia Pacific Water Bus Market Overview
Market Valuation & Growth Trajectory :
Asia Pacific water bus market valued at USD 243.6 million in 2024, with projected expansion to USD 319.8 million by 2029, representing a steady 4.6% CAGR over the forecast period.
Urbanization & Infrastructure Investment :
Rapid urbanization across Asia Pacific economies is driving demand for sustainable public transportation solutions, supported by government investments in maritime infrastructure and smart city initiatives.
Sustainability Focus :
Growing emphasis on reducing traffic congestion and carbon emissions is positioning water buses as a viable eco-friendly alternative to traditional land-based public transport in coastal and riverine cities.
Regional Economic Drivers :
Key Asia Pacific economies including China, Japan, India, and South Korea are leading adoption through modernization of port facilities and development of integrated water transportation networks.
Asia Pacific Water Bus Market Dynamics
- Major economies in the region are investing heavily in maritime connectivity solutions to address congestion in densely populated coastal cities.
- The sector benefits from rising environmental awareness and regulatory support for low-emission public transit alternatives. Key growth catalysts include expanding middle-class populations, increasing tourism demand, and integration of water buses into multimodal transportation networks.
- Strategic partnerships between government agencies and private operators are facilitating fleet modernization and technology adoption.
- Asia Pacific's competitive advantage in manufacturing and innovation positions the region as a critical growth engine for the global water bus market..
Market Ecosystem
Related Ecosystem
Marine
- Tankers
- Fuel Cell
- HVAC System
- Navigation Systems
- Sensors
- Wartsila
- Kongsberg Gruppen ASA
- L3Harris Technologies, Inc.
- ABB India Limited
- Thales group
Key Takeaways
- Asia Pacific water bus market valued at USD 243.6 million in 2024, growing at 4.6% CAGR through 2029.
- Asia Pacific's urbanization and sustainability initiatives are primary drivers of water bus adoption and infrastructure investment.
- Asia Pacific represents a high-growth region within the global water bus market, with expanding coastal city populations.
- Asia Pacific's diverse regulatory landscape and infrastructure development levels create differentiated growth opportunities across sub-regions.
Water Bus Market Report Scope
| Report Metric | Details |
|---|---|
| Base Year | 2024 |
| Fastest Growing Segment | FULLY ELECTRIC (Propulsion) |
| Forecast Period | 2024-2029 |
| Growth Rate | CAGR of 5.1% from 2024 to 2029 |
| Largest Segment | INTERCITY (Operation) |
| Market Size Base Year (Billions) | ~USD 1.22 (2024) |
| Revenue Forecast (Billions) | ~USD 1.56 (2029) |
| Segments Covered | Capacity, Operation, Propulsion |
Asia Pacific Water Bus Market Report Segmentation
3 segment dimensions are covered across the global market.
By Capacity
- 25-50 Pax
- 26-50 Pax
- 50-75 Pax
- 50-75 Pax
- 51-75 Pax
- <25 Pax
By Operation
- Intercity
- Intra City
- Intracity
By Propulsion
- Fuel Powered
- Fully Electric
- Hybrid Electric
Target Audience
- Transportation & Infrastructure Operators : Public transit authorities and private operators need Asia Pacific market data to plan fleet expansion, assess regional demand patterns, and identify investment opportunities in water bus infrastructure.
- Aerospace & Defence Manufacturers : OEMs and suppliers require detailed Asia Pacific insights to develop region-specific water bus solutions, understand local regulatory requirements, and establish manufacturing partnerships.
- Government & Policy Makers : Regional and national government agencies use market intelligence to inform sustainable transportation policies, allocate infrastructure budgets, and evaluate water bus viability for urban mobility solutions.
- Investment & Financial Institutions : Private equity firms, venture capital, and institutional investors need Asia Pacific market forecasts to evaluate funding opportunities and assess ROI potential in the water transportation sector.
- Technology & Innovation Providers : Software, automation, and propulsion technology companies require Asia Pacific market data to identify adoption trends, develop localized solutions, and target key customer segments.
Countries within Asia Pacific - compare and drill down
| Country | 2025 size (native) |
|---|---|
| China | USD 109.3 Million |
| India | USD 49 Million |
| Japan | USD 83.7 Million |
| South Korea | USD 39.2 Million |
| Rest Of Asia Pacific | USD 38.6 Million |
Country market size visualization
Reasons to Buy this Report
- Regional Market Intelligence : Gain comprehensive insights into Asia Pacific water bus market dynamics, including country-level analysis of China, Japan, India, and South Korea with specific market valuations and growth trajectories.
- Investment Decision Support : Access detailed forecasts through 2029 to identify high-growth opportunities and make informed capital allocation decisions across Asia Pacific's emerging water transportation sector.
- Competitive Landscape Analysis : Understand regional competitive positioning, key market players, and strategic initiatives driving adoption of water bus solutions across major Asia Pacific metropolitan areas.
- Policy & Infrastructure Insights : Evaluate government investment trends, regulatory frameworks, and infrastructure development plans supporting water bus expansion in Asia Pacific's fastest-growing urban centers.
- Market Entry Strategy : Develop targeted go-to-market strategies with country-specific data on market maturity, demand drivers, and partnership opportunities in the Asia Pacific water bus ecosystem.
Frequently asked questions
What is the current size of the Asia Pacific water bus market?
The Asia Pacific water bus market was valued at USD 243.6 million in 2024 and is projected to reach USD 319.8 million by 2029.
What is the growth rate of the Asia Pacific water bus market?
Asia Pacific's water bus market is expected to grow at a compound annual growth rate (CAGR) of 4.6% from 2024 to 2029.
What factors are driving growth in Asia Pacific's water bus market?
Key drivers in Asia Pacific include rapid urbanization, government investments in sustainable public transportation, rising environmental concerns, and expanding coastal city populations requiring alternative transit solutions.
Which countries in Asia Pacific are leading the water bus market?
Asia Pacific's water bus market is led by developed and emerging economies with significant coastal populations and established maritime infrastructure, though specific country rankings vary by sub-region and market maturity.
How does Asia Pacific's water bus market compare to global trends?
Asia Pacific's 4.6% CAGR is slightly below the global average of 5.1%, reflecting regional variations in infrastructure development, regulatory frameworks, and adoption rates across different sub-regions.
RESEARCH METHODOLOGY
The research study conducted on the water bus market involved the extensive use of secondary sources, directories, and databases, such as D&B Hoovers, Bloomberg, and Factiva, to identify and collect relevant information. Primary sources included industry experts from the market as well as suppliers, manufacturers, solution providers, technology developers, alliances, and organizations related to all segments of the value chain of this industry. In-depth interviews of various primary respondents, including key industry participants, subject matter experts (SMEs), industry consultants, and C-level executives, were conducted to obtain and verify critical qualitative and quantitative information pertaining to the market as well as assess the growth prospects of the market. A deductive approach, also known as the bottom-up approach combined with the top-down approach, was used to forecast the market size of different market segments.
Secondary Research
In the secondary research process, various secondary sources were referred to identify and collect information for this study on the water bus market. Secondary sources included annual reports, press releases, and investor presentations of companies; white papers and certified publications; articles from recognized authors; manufacturers' associations; directories; and databases. Secondary research was mainly used to obtain key information about the supply chain of the marine industry, the monetary chain of the market, the total pool of key players, market classification and segmentation according to the industry trends to the bottom-most level, regional markets, and key developments from both market and technology-oriented perspectives.
Primary Research
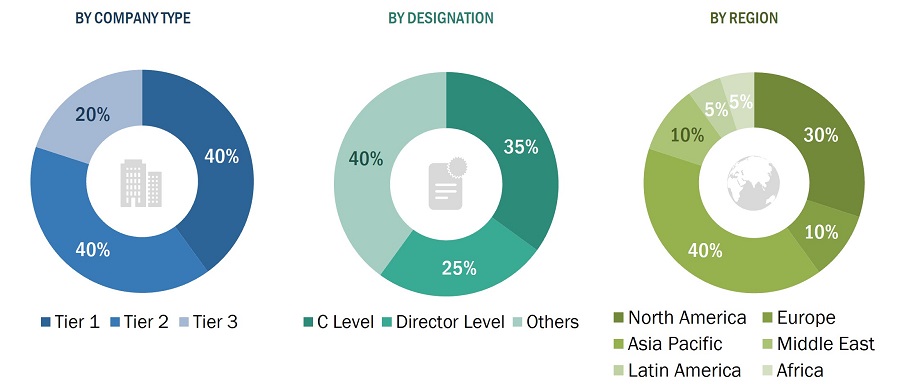
Extensive Extensive primary research was conducted to obtain qualitative and quantitative information for this report on the water bus market. Several primary interviews were conducted with market experts from both the demand and supply sides across major regions, namely, North America, Europe, Asia Pacific, the Middle East, Latin America & Africa. Primary sources from the supply side included industry experts such as business development managers, sales heads, technology and innovation directors, and related key executives from various key companies and organizations operating in the autonomous boats market.
To know about the assumptions considered for the study, download the pdf brochure
Market Size Estimation
The top-down and bottom-up approaches were used to estimate and validate the size of the autonomous boats market. The research methodology used to estimate the market size includes the following details. Key players in the market were identified through secondary research, and their market share was determined through primary and secondary research. This included a study of the annual and financial reports of top market players and extensive interviews with industry stakeholders such as CEOs, technical advisors, military experts, marine vessel maintenance professionals, and SMEs of leading companies operating in the water bus market.
All percentage shares, splits, and breakdowns were determined using secondary sources and verified through primary sources. All possible parameters that affect the markets covered in this research study were accounted for, viewed in extensive detail, verified through primary research, and analyzed to obtain the final quantitative and qualitative data on the water bus market. This data was consolidated, enhanced with detailed inputs, analyzed by MarketsandMarkets, and presented in this report.
Bottom-Up Approach
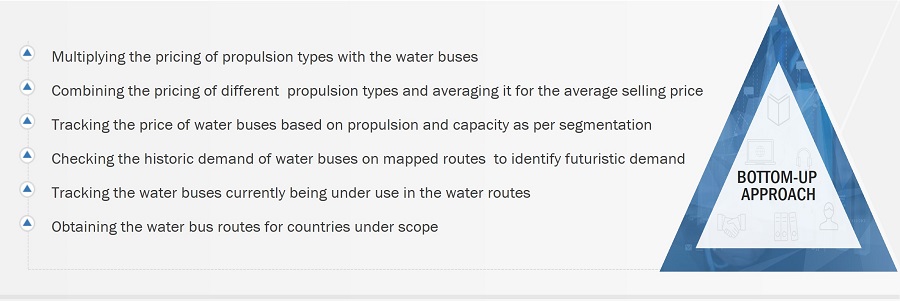
The bottom-up approach was employed to determine the overall size of the water bus market. Calculations for the market relied on water bus market were based on regional demand for each country. The bottom-up approach was also implemented to extract secondary research data to validate different market segments' revenues. With the data triangulation procedure and data validation through primaries, the overall sizes of the water bus market from the revenues of key players and their shares in the market and each market segment were determined and confirmed in this study.
Top-Down Approach
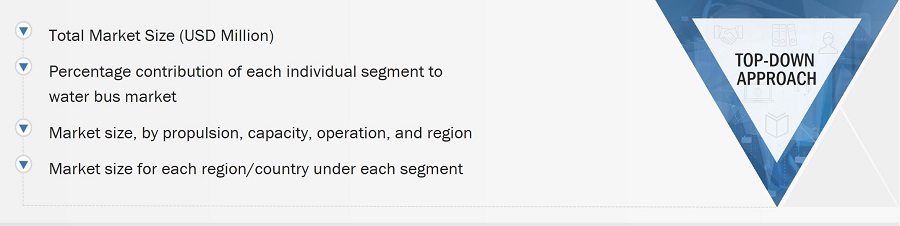
In the top-down approach, the overall market size was used to estimate the size of individual markets (mentioned in market segmentation) through percentage splits based on secondary and primary research.
For calculating the sizes of specific market segments, the most appropriate and immediate parent market size was used to implement the top-down approach. The bottom-up approach was also implemented to validate the market segment revenues obtained.
Market shares were then estimated for each company to verify the revenue shares used earlier in the bottom-up approach. With the data triangulation procedure and validation of data through primaries, the sizes of the parent market and each individual market were determined and confirmed in this study. The data triangulation procedure used for this study is explained in the market breakdown and triangulation section.
Data triangulation
After arriving at the overall market size through the market size estimation process explained above, the total market was split into several segments and subsegments. To complete the overall market engineering process and arrive at the exact statistics for market segments and subsegments, market breakdown & data triangulation procedures explained below were implemented, wherever applicable. Data was triangulated by studying various factors and trends from both the demand and supply sides. Along with this, the market size was validated using both top-down and bottom-up approaches.
Market Definition
Water bus refers to marine vessels that are used to navigate through rivers, canals, or harbors within cities and tourist areas and accommodating around 50 to 75 people. Water buses provide public transportation services by offering scheduled or on-demand services, connecting various points along waterways. Water buses follow fixed routes or schedules for commutes and focus on connecting specific points across a waterway, making them suitable for short and longe intercity and intra city travel.
Stakeholders
Various stakeholders of the market are listed below:
- Water Bus Manufacturers
- Subcomponent Manufacturers
- Water Bus Service Providers
- Raw Material Suppliers
- Technology Support Providers
- System Integrators
- Government Agencies
- Commercial Vessel Operators
- Research Organizations
Report Objectives
- To define, describe, segment, and forecast the size of the water bus market based on propulsion, capacity, operation, and region.
- To analyze the degree of competition in the market by mapping the recent developments, products, and services of key market players
- To understand the structure of the water bus market by identifying its various segments and subsegments.
- To identify and analyze key drivers, restraints, opportunities, and challenges that influence market growth.
- To forecast the size of market segments across North America, Europe, Asia Pacific, Middle East, Latin America & Africa along with major countries in each region
- To analyze micromarkets1 with respect to individual technological trends and their contribution to the total market
- To profile key market players and comprehensively analyze their market share and core competencies2.
- To provide a detailed competitive landscape of the market, along with an analysis of business and strategies, such as mergers and acquisitions, partnerships, and agreements, in the water bus market.
- To identify detailed financial positions, key products, and unique selling points of leading companies in the market.
1. Micromarkets are further segments and subsegments of the water bus market market.
2. Core competencies of companies were captured in terms of their key developments and strategies adopted to sustain their position in the market
Available customizations
Along with the market data, MarketsandMarkets offers customizations as per the specific needs of companies. The following customization options are available for the report:
Product Analysis
- Product matrix, which gives a detailed comparison of the product portfolio of each company.
Regional Analysis
- Further breakdown of the market segments at the country level
Company Information
- Detailed analysis and profiling of additional market players (up to 5)
Get the Full Water Bus Market Report
Full forecast, segment splits, and company analysis for all Water Bus Market.
- Canada Water Bus Market
- US Water Bus Market
- UK Water Bus Market
- France Water Bus Market
- Germany Water Bus Market
- Denmark Water Bus Market
- Norway Water Bus Market
- Italy Water Bus Market
- China Water Bus Market
- India Water Bus Market
- Japan Water Bus Market
- South Korea Water Bus Market
- UAE Water Bus Market
- Saudi Arabia Water Bus Market
- Brazil Water Bus Market
- Mexico Water Bus Market
- Rest Of Europe Water Bus Market
- Rest Of Asia Pacific Water Bus Market
- Rest Of Middle East Water Bus Market
- Africa Water Bus Market
Need a Tailored Report?
Customize this report to your needs
Get 10% FREE Customization
Customize This Report
